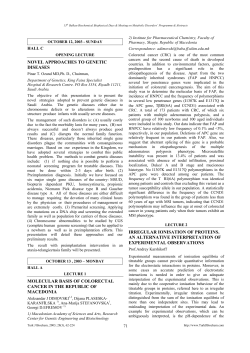
1. Active yet responsive. What is the biochemical advantage of having a KM approximately equal to the substrate con- centration normally available to an enzyme? 2. Destroying the Trojan horse. Penicillin is hydrolyzed and thereby rendered inactive by penicillinase (also known as �-lactamase), an enzyme present in some resistant bacteria. The mass of this enzyme in Staphylococcus aureus is 29.6 kd. The amount of penicillin hydrolyzed in 1 minute in a 10-ml solution containing 10�9 g of purified penicillinase was measured as a function of the concentration of penicillin. Assume that the concentration of penicillin does not change appreciably during the assay. Penicillin uM 1 3 5 10 30 50 Amount Hydrolyzed (nanomoles) 0.11 0.25 0.34 0.45 0.58 0.61 (a) Plot V0 versus [S] and 1/V0 versus 1/[S] for these data. Does penicillinase appear to obey Michaelis–Menten kinetics? If so, what is the value of KM? (b) What is the value of Vmax? (c) What is the turnover number of penicillinase under- these experimental conditions? Assume one active site per enzyme molecule. 3. A fresh view. The plot of 1/V0 versus 1/[S] is sometimes called a Lineweaver–Burk plot. Another way of expressing the kinetic data is to plot V0 versus V0/[S], which is known as an Eadie–Hofstee plot. (a) Rearrange the Michaelis–Menten equation to give V0 as a function of V0/[S]. 
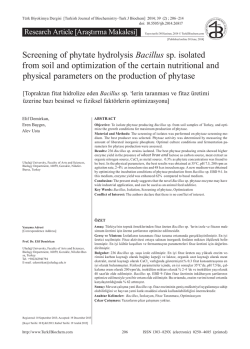
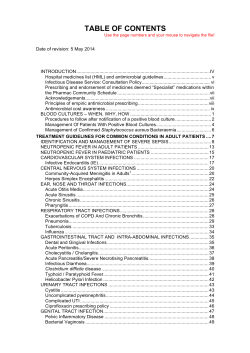
 (b) What is the significance of the slope, the vertical intercept, and the horizontal intercept in a plot of V0 versus V0/[S]? 4. Competing substrates. Suppose that two substrates, A and B, compete for an enzyme. Derive an expression relat- ing the ratio of the rates of utilization of A and B, VA/VB, to the concentrations of these substrates and their values of kcat and KM. (Hint: Express VA as a function of kcat/KM for substrate A, and do the same for VB.) Is specificity determined by KM alone? 5. More Michaelis–Menten. For an enzyme that follows simple Michaelis–Menten kinetics, what is the value of Vmax if V0 is equal to 1 mol minute-1 when [S] = 1/10 KM? 6. Angry biochemists. Many biochemists go bananas, and justifiably, when they see a Michaelis–Menten plot like the one shown here. To see why they go bananas, determine the V0 as a fraction of Vmax when the substrate concentration is equal to 10 KM and 20 KM. Please control your outrage. Data Interpretation Problems 7. KM matters. The amino acid asparagine is required by cancer cells to proliferate. Treating patients with the enzyme asparaginase is sometimes used as a chemotherapy treatment. Asparaginase hydrolyzes asparagine to aspartate and ammo- nia. The adjoining illustration shows the Michaelis–Menten curves for two asparaginases from different sources, as well as the concentration of asparagine in the environment (indi- cated by the arrow). Which enzyme would make a better chemotherapeutic agent? 8. Varying the enzyme. For a one-substrate, enzyme-cat- alyzed reaction, double-reciprocal plots were determined for three different enzyme concentrations. Which of the following three families of curve would you expect to be obtained? Explain. 9. Too much of a good thing. A simple Michaelis–Menten enzyme, in the absence of any inhibitor, displayed the fol- lowing kinetic behavior. The expected value of Vmax is shown on the y-axis. (a) Draw a double-reciprocal plot that corresponds to the velocityversus-substrate curve.
 (b) Provide an explanation for the kinetic results. 10. Rate-limiting step. In the conversion of A into D in the following biochemical pathway, enzymes EA, EB, and EC have the KM values indicated under each enzyme. If all of the substrates and products are present at a concentration of 10-4 M and the enzymes have approximately the same Vmax, which step will be rate limiting and why? A KM = B 10-2M C 10-4M D 10-4M 11.Paradoxical at first glance. Phosphonacetyl-L-aspartate 
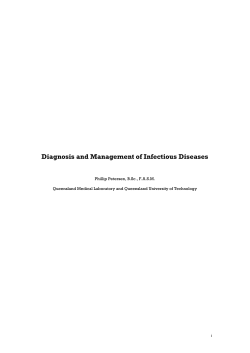
 (PALA) is a potent inhibitor of the allosteric enzyme aspartate transcarbamoylase (ATCase), which has six active sites, because it mimics the two physiological substrates. ATCase controls the synthesis of pyrimidine nucleotides. However, low concentrations of this unreactive bisubstrate analog increase the reaction velocity. On the addition of PALA, the reaction rate increases until an average of three molecules of PALA are bound per molecule of enzyme. This maximal velocity is 17-fold greater than it is in the absence of PALA. The reaction rate then decreases to nearly zero on the addition of three more molecules of PALA per molecule of enzyme. Why do low concentrations of PALA activate ATCase? 12. R versus T. An allosteric enzyme that follows the con- certed mechanism has a T/R ratio of 300 in the absence of substrate. Suppose that a mutation reversed the ratio. How would this mutation affect the relation between the rate of the reaction and the substrate concentration? 13. Distinguishing between models. The following graph shows the fraction of an allosteric enzyme in the R state ( fR) and the fraction of active sites bound to substrate (Y) as a function of substrate concentration. Which model, the con- certed or sequential, best explains these results? 14. Reporting live from ATCase 1. The allosteric enzyme aspartate transcarbamoylase (ATCase) has six active sites, arranged as two catalytic trimers. ATCase was modified with tetranitromethane to form a colored nitrotyrosine group (�max � 430 nm) in each of its catalytic chains. The absorp- tion by this reporter group depends on its immediate environment. An essential lysine residue at each catalytic site also was modified to block the binding of substrate. Cat- alytic trimers from this doubly modified enzyme were then combined with native trimers to form a hybrid enzyme. The absorption by the nitrotyrosine group was measured on addition of the substrate analog succinate. What is the sig- nificance of the alteration in the absorbance at 430 nm? 15. Reporting live from ATCase 2. A different ATCase hybrid was constructed to test the effects of allosteric acti- vators and inhibitors. Normal regulatory subunits were combined with nitrotyrosinecontaining catalytic subunits. The addition of ATP, an allosteric activator of ATCase, in the absence of substrate increased the absorbance at 430 nm, the same change elicited by the addition of succinate (see the graph in problem 14). Conversely, CTP, an allosteric inhibitor, in the absence of substrate decreased the absorbance at 430 nm. What is the significance of the changes in absorption of the reporter groups?
© Copyright 2026 Paperzz