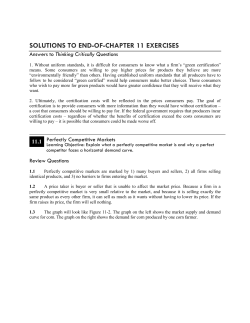
What Is Meant By Resources?
The word resources refers to anything which can be used in the production process.
Resources are also called Factors of Production. Economists categorise all resources into four
categories:
1. Land
also known as natural resources
2. Capital
also known as capital resources
3. Labour
also known as human resources
All these are
used to produce
finished goods
and services
4. Enterprise
Land:
This includes all elements of the natural environment. Examples include minerals, soil,
forests, climate, water, marine stocks and scenic landscapes. Many natural resources are limited in
their supply, for example coal, iron and oil. They are called exhaustible or non-renewable resources
and cannot be replaced.
Other natural resources are non-exhaustible or renewable because with careful management
they renew themselves and are available indefinitely. Examples include fish stocks, forests and water
resources. However if used up to fast without any thought for their future availability, they will be
exhausted too.
Labour:
In economics labour includes all human intellectual and physical effort and skills which go into the
production of goods and services. There are many different occupations which people do and which
require different skills. Some jobs are labour-intensive and need lots of workers while others require
fewer workers with higher skills because they work with complex machinery or equipment. The work
they do is intellectual not physical. In our rapidly changing and competitive world, workers need
higher levels of education and training and need to continually update their skills and knowledge.
Capital:
Capital refers to man-made or manufactured goods used to make final products. It includes
tools and equipment, machinery, roads, dams, buildings, office furniture and equipment, motor
vehicles used in business and industry, railways, computers and so on. Some manufactured goods
may be both a consumer good and a capital good. A car or a computer is a consumer good if it is
purchased by a household for personal use. However if the car or computer is purchased to be used in
a business, then they are capital goods. A train or a jumbo jet are clearly capital goods because they
are used to produce a service which consumers buy. Spending by a business on the purchase of
capital goods is called investment or capital expenditure.
Enterprise:
This, like labour, is a human resource. It can also be called entrepreneurship or
entrepreneurial skill. It refers to the ability to combine the other three factors of production into a
production process which produces a good or service wanted by consumers. A successful
entrepreneur is a person who sees an opportunity in the market and creates a new business. In doing
this a consumer want is satisfied and jobs are created providing employment for people who are
looking for work. A successful entrepreneur will choose a combination of factors which minimises
costs and set a price for the final product which maximises profit but which doesn’t discourage
consumers from buying the product. An enterprising person is a risk taker. Setting up and running a
new business is a risky venture in a competitive environment. Things can go wrong and the business
can fail leaving the entrepreneur bankrupt. Prosperous economies value and encourage
entrepreneurship.
1. Write true or false for each of the following statements.
i) The word resources refers to anything which is provided by nature.
___________
ii) Iron ore and oil are examples of renewable resources.
___________
iii) Labour is a resource which includes intellectual and physical skills.
___________
iv) The family car is an example of a capital good.
___________
v) A farmer's tractor is an example of a capital good.
___________
vi) Being able to combine land, labour and capital into production is the
objective of enterprise.
___________
vii) Investment is spending by households on capital
___________
2. In the table below write each of the items in the list under the appropriate resource heading in the
table
a) the Great Barrier Reef
g) coal deposits
b) Swan river
h) a telecommunications satellite
c) a computer
i) a business owner
d) a hospital building
j) a shop assistant
e) a migrant from Vietnam
k) fertiliser
f) a farmer's dam
Land
Labour
Capital
Enterprise
SCARCITY
Scarcity – unlimited wants versus limited resources
By now you should clearly understand that economics is about using available resources to
satisfy as many needs and wants of as many people as possible. All societies are faced with this basic
problem - the problem of scarcity. This means that the resources society needs to produce goods and
services to meet people's needs and wants are limited. Remember
the definition of economics on page 2? Therefore the supply of goods and services produced is limited
relative to demand for them. This scarcity creates the need for need for choice. Consumers have to
make choices as to what goods and services to buy and producers have to decide what resources to
purchase and what goods and services to produce with those resources.
This characteristic of scarcity allows us to classify goods into different categories. Goods which
are scarce relative to wants we can call economic goods. Anything which has a price is an economic
good. Its price reflects its scarcity. The scarcer a good is, the higher its price; the more available a good
is, the lower its price. Think about the price of bananas last year and now. Prices went up drastically last
year but are coming done now! Why?
Some goods are free but these are very few. Obviously if they are free they are not scarce. Two
examples of free goods are air and sunshine. Goods which households buy are called consumer goods.
They are final products which are used directly to satisfy individual wants and needs. Things like food,
clothing, a can of lemonade or a CD are examples of final consumer goods. Some consumer goods last a
long time like a car, a television and furniture. Such goods are called consumer durables or durable
consumer goods. Other final products are consumed quickly or in a relatively short space of time such as
food, petrol, cosmetics and clothing. These products are called non-durable consumer goods. When you
pay to ride on a bus or do a course at Canning College, you are buying a service.
Intermediate goods are goods which are components or parts of final goods for example
microprocessors in computers or the lights in a car. They are manufactured separately then purchased by
the producer of the final product.
Goods which are used to make other goods and services are called capital or producer goods.
These are goods bought by producers which they use to produce something else. Examples include
machinery, tools, or office equipment to name only some. Capital goods are used in the production
process along with other resources. Money spent on the purchase of capital goods is called investment.
The Economic Problem
Our discussion of wants, needs and resources allows us to focus on the economic problem in a
concise, logical way:
• Wants are unlimited – this is the source of demand for goods and services.
• Resources which are used to satisfy wants, have alternative uses and are limited.
• Since resources are limited, choices have to made. Society must choose which wants it will satisfy
with its resources.
The scarcity of resources in relation to wants is referred to as the economic problem. The goal
of any society is to maximise human material well being by satisfying as many wants of as many people as
possible. The task of an economic system is to devise ways to make national resources stretch as far as
possible to achieve this aim. This is what economists study.
The economic problem, with its central idea of choosing between wants, raises some important
questions which we all face.
i) What is the cost of choosing?
ii) Is there an order of choice?
iii) What is the best choice?
WORD GRID
Term
Economic goods
Free goods
Capital goods
Durable consumer goods
Non-durable
consumer goods
Intermediate goods
Meaning
Examples
What is Economics – a summary •
•
•
•
•
•
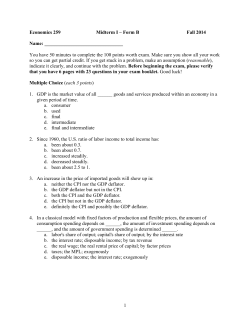
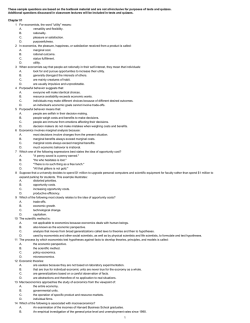
EconomicsВ isВ theВ studyВ ofВ howВ weВ canВ makeВ firstВ bestВ choicesВ В ResourcesВ areВ limitedВ (timeВ andВ human,В naturalВ andВ capitalВ resources)В thereforeВ weВ haveВ toВ makeВ choicesВ inВ life.В В WhenВ aВ choiceВ isВ made,В aВ realВ costВ isВ incurred.В ThisВ isВ calledВ OpportunityВ Cost.В В OpportunityВ CostВ =В nextВ bestВ alternativeВ В IfВ weВ makeВ firstВ orВ bestВ choicesВ thenВ weВ keepВ ourВ opportunityВ costsВ asВ lowВ asВ possible.В В WhenВ weВ makeВ firstВ bestВ choices,В weВ areВ achievingВ economicВ efficiency.В В WeВ canВ showВ theВ conceptВ ofВ opportunityВ costВ withВ aВ ProductionВ PossibilitiesВ FrontierВ modelВ (PPF).В В В TheВ PPFВ isВ curvedВ whichВ isВ dueВ toВ theВ lawВ ofВ increasingВ costs.В ThisВ happensВ becauseВ resourcesВ areВ notВ equallyВ efficientВ atВ producingВ bothВ goods.В AВ GoodВ YВ B
В C
В В D
 Good X  The PPF shows us 3 things: 1. There is a limit to how much we can produce.  2. If we are already using all available resources and technology, then to produce more of one good means we have to shift resources away from the production of the other good so less of that is produced. This fall in the output of the other good = opportunity cost.  3. Over time, as population grows and more and better resources become available, more of all goods can be produced. This is known as Economic Growth REVISION ACTIVITY ON THE PPF AND OPPORTUNITY COST     Unlimited wants THE ECONOMIC PROBLEM     SCARCITY      CHOICE – individuals, firms and
governments need to consider the
OPPORTUNITY or REAL cost of each
alternative choice made by households, firms
and governments.
В В В В В В В В В В В В В В В ThereforeВ theyВ mustВ decideВ onВ fourВ questions:В o
o
o
o
What to produce How much to produce How to produce For whom to produce Limited resources 1. Graph the PPC from the data in the table below  A B C D E F Consumer goods 0 10 20 30 40 50 Capital goods 100 80 60 40 20 0  a. The PPC (or PPF) is a (curved/straight) line __________________________ b. The opportunity cost of increasing consumer goods output from 10 to 20 is _________________ c. The opportunity cost of increasing consumer goods output from 20 to 30 is _________________ d. Label a new point G (30 units of consumer goods and 30 units of capital goods). Explain why this point represents a �waste of resources’.  _______________________________________________________________________________ 2. The table below shows combinations of food and manufactured goods that could be produced by a fully employed economy.    R           S           T          U         V Food  0          10        20        30        40
Manufactured goods 100      90        70        40          0  a. Construct a PPF from the data. b. Calculate the opportunity cost of increasing food production by 10 units.  Food  opportunity cost  0‐10  ____________  10‐20  ____________  20‐30  ____________  30‐40  ____________ c.  Why does the OC increase?_______________________________________________________ _________________________________________________________________________________
___________________________________________________________________________ d. This is known as the law of ________________________________________________ e. Assume there is an increase in labour productivity that doubles the output of both food and manufactured goods. Show this on your graph. f. Assume food production increases by 20% ‐ show the effect on the PPF.  g. What factors would cause the PPF to move inwards? _________________________________ _________________________________________________________________________________
___________________________________________________________________________В h. AssumeВ theВ economyВ isВ atВ pointВ T.В В ExplainВ theВ adjustmentВ processВ ifВ societyВ demandsВ moreВ foodВ production.В _________________________________________________________________________________
___________________________________________________________________________В GRAPHВ CONSTRUCTIONSВ В В В В В В В В В В В В В В В В В В В В В В В В В В В В В В В В В В В В В В В В В В В В В В В В В В В В В В В В В В В В В В В В В В В В В В В В В В В В В В В В В В В В В В В В В В В В В В В В В В В В В В В В В В В В В В В В В В В В В В В В В В В В В В В В В В В В В В В В В В В В В В В В В В В В В В В В В В В В В В В В В В В В В В В В В В В В В В В В В В В В В В В В В В В В В В В В В В В В В В В В В В В В В В В В В В В В В В В В В В В В В В В В В В В В В В В В В В В В В В В В В В В В В В В В В В В В В В В В В В В В В В В В В STUDENT ACTIVITY 1.2
Examine the table of data below from the Australian National Accounts provided by
the Australian Bureau of Statistics (January and November, 2009) and then complete
the questions. The table shows the contribution to GDP as measured by expenditure
from households (C), firms (I), government (G) and net exports (X-M).
Australia's National Accounts Nov 2009 ($millions)
Period
Cons
I
Govt
Bus
G1
G2
Invent
∆
Exports
Imports
GDP
1994–95
370,421.0
110,370.0
14,199.0
127,069.0
14,463.0
3,479.0
129,105.0
91,514.0
681,004.0
1995–96
383,800.0
114,653.0
13,385.0
132,404.0
14,223.0
106.0
142,020.0
95,130.0
708,925.0
1996–97
393,269.0
126,463.0
11,285.0
134,938.0
15,467.0
958.0
157,668.0
104,500.0
736,573.0
1997–98
411,390.0
143,603.0
9,546.0
140,092.0
15,099.0
629.0
164,232.0
114,894.0
769,719.0
1998–99
431,961.0
146,079.0
13,846.0
146,363.0
15,835.0
5,894.0
167,853.0
120,592.0
809,744.0
1999–00
450,892.0
160,953.0
10,757.0
151,152.0
18,597.0
2,760.0
182,190.0
135,524.0
842,134.0
2000–01
467,187.0
143,083.0
10,248.0
154,309.0
18,848.0
2,469.0
195,980.0
134,161.0
858,134.0
2001–02
481,205.0
157,135.0
11,679.0
158,587.0
20,025.0
162.0
194,109.0
136,121.0
890,743.0
2002–03
497,721.0
182,769.0
12,441.0
163,610.0
20,648.0
905.0
193,255.0
153,919.0
919,247.0
2003–04
524,706.0
198,166.0
13,877.0
170,057.0
21,736.0
6,209.0
197,382.0
173,993.0
956,017.0
2004–05
548,015.0
209,562.0
15,659.0
176,447.0
23,057.0
6,102.0
203,407.0
195,124.0
982,786.0
2005–06
562,227.0
227,868.0
18,579.0
180,839.0
23,785.0
2,298.0
207,886.0
209,246.0
1,012,269.0
2006–07
584,924.0
238,948.0
18,756.0
186,203.0
27,003.0
2,652.0
215,695.0
228,452.0
1,045,674.0
2007–08
608,428.0
264,271.0
19,935.0
192,611.0
28,731.0
5,114.0
224,500.0
259,977.0
1,084,451.0
2008-09
617,114.0
272,593.0
22,394.0
198,964.0
31,229.0
-8,898.0
228,526.0
253,479.0
1,095,370.0
Annual % percentage change
Period
Cons
I
Pub
Corp
G1
G2
Exports
Imports
1994–95
5.1
11.0
19.4
3.5
7.1
4.8
16.6
4.3
1995–96
3.6
3.9
-5.7
4.2
-1.7
10.0
4.0
4.1
1996–97
2.5
10.3
-15.7
1.9
8.8
11.0
9.8
3.9
1997–98
4.6
13.6
-15.4
3.8
-2.4
4.2
9.9
4.5
1998–99
5.0
1.7
45.1
4.5
4.9
2.2
5.0
5.2
1999–00
4.4
10.2
-22.3
3.3
17.4
8.5
12.4
4.0
2000–01
3.6
-11.1
-4.7
2.1
1.4
7.6
-1.0
1.9
2001–02
3.0
9.8
14.0
2.8
6.2
-1.0
1.5
3.8
2002–03
3.4
16.3
6.5
3.2
3.1
-0.4
13.1
3.2
2003–04
5.4
8.4
11.5
3.9
5.3
2.1
13.0
4.0
2004–05
4.4
5.8
12.8
3.8
6.1
3.1
12.1
2.8
2005–06
2.6
8.7
18.6
2.5
3.2
2.2
7.2
3.0
2006–07
4.0
4.9
1.0
3.0
13.5
3.8
9.2
3.3
2007–08
4.0
10.6
6.3
3.4
6.4
4.1
13.8
3.7
2008-09
1.4
3.1
12.3
3.3
8.7
1.8
-2.5
1.0
GDP
(ABS Australian Economic Indicators, Jan & Nov 2009, 1350.0)
3BECO – ECONOMIC POLICIES
AND MANAGEMENT
ESSENTIAL BACKGROUND/REVISION
2010
3BECO – Economic policies and management
1. Essential Background/Revision
Objectives:
• distinguish between macroeconomics and microeconomics
• explain the concept of the circular flow of income and expenditure
• explain the concepts of total spending, total output and total income and the relationship between
them
• explain the concepts of equilibrium, leakages and injections in the circular flow of income and
expenditure
• explain how changes in leakages and injections can change the level of equilibrium in the
circular flow of income model
• explain the concept of the business cycle
• outline the phases of the business cycle
The Difference between Microeconomics and Macroeconomics
Microeconomics is the study of the economics of the individual parts which make
up an economy. It deals with the behaviour of single economic agents like
households and consumers and individual firms. It also studies the operation of
particular sectors of the economy and industries as well as the operation of factor
and product markets. Microeconomics deals with questions like what determines
the prices of goods, peoples’ consumption patterns and decisions about production
like what, how, and how much to produce.
Macroeconomics is about the economy as a whole. It looks at the relationship
between all the parts of the economy and aggregates such as inflation,
employment, output and the balance of payments. Macroeconomics focuses on the
three important measures of economic activity of total output, total spending and
total income.
Knowledge of macroeconomics is important because it allows us to answer
questions such as what determines the general level of prices and interest rates
and allows governments and businesses to develop policy and plan ahead to meet
the needs of the community and achieve social and commercial objectives.
The Circular Flow of Income Model
Economic models are used to focus on the most important elements in a
very complex real world. Their purpose is to reduce the complicated details of the
economy to a simple form to allow us to understand the interrelationships
between these elements. Models allow analysis to focus on important economic
events that constantly go on around us and make it easier to predict and explain
the behaviour of important economic variables. You have learned about the model
of supply and demand. This is a model of a simple market. It can be called a
microeconomic model because it shows us the operation of just a small part of an
economy. Some models show us the operation of an economy as a whole. These
are called macroeconomic models. The circular flow of income model is a
macroeconomic model which you are going to learn about next.
All countries have governments which are involved in economic decision-making
to varying degrees. In a very few countries such as Cuba or North Korea
governments make most of the decisions. In other countries like the USA and
Essential Background – Dave King
1
3BECO – Economic policies and management
Australia, governments make fewer economic decisions than the private sector
(households and firms). Economies like Australia’s and America’s are called
market or mixed economies. They are also called free enterprise, private
enterprise or capitalist economies. The free enterprise economy consists of three
main parts or sectors: i) households or consumers, ii) firms or producers, iii)
Governments.
In a market economy firms and households are the most important sectors. The
relationship between them is illustrated in the following diagram or simple model
of the economy.
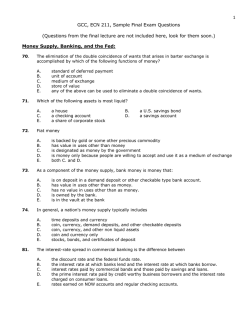
THE SIMPLE
CIRCULAR FLOW
OF INCOME
MODEL
Factors of Production (land, labour, capital & enterprise)
Income (wages, profits, interest, & rent)
Households
Firms
Consumption (payment for goods & services)
Goods and Services
Resources include :
land
labour
capital
enterprise
The return (income) to each of these resources is:
rent
wages & salaries
interest
profit
The diagram shows two sectors only – households and firms (or consumers
and producers). It shows us that firms purchase the resources they need from
households who receive payments we call income (Y). The level of income paid for
a resource will depend on the demand for the resource from firms and the supply
of it. Obviously those resources which are in high demand will attract a high
income compared to other resources. Therefore different individuals who possess
different resources and quantities of resources, receive different levels of income.
People who have no resources to offer in the market place would receive no income
at all if governments didn’t step in with welfare payments.
Firms produce goods and services (O for output) with the resources they
purchase from households. With the income received from selling their resources,
households then buy these goods and services [consumption (C) or Expenditure
(E)] in the market place for prices acceptable to both buyers and sellers. Obviously
the goods and services firms produce will have to be those which consumers want
to buy. When consumers change their preferences, firms must respond quickly
and shift production into what consumers want (this is called consumer
sovereignty). Firms make a profit by adding on a margin to the costs of the
natural, labour and capital resources they use. This is their return (profit) for
organising and coordinating the process of production (payment for enterprise). In
the simple model the total value of consumption = the total value of output =
the total value of income which gives us our equilibrium condition.
Total
Expenditure
∑E
Essential Background – Dave King
=
∑O
=
∑Y
Total Income
Total Output
2
3BECO – Economic policies and management
Student Activity
Complete the following sentences.
a) The consumer or household sector supplies ________________________________
______________________________________________________________________________
b) In return for supplying these households receive _____________ in the form of
______________________________________________________________________________
c) Income levels vary. Why? __________________________________________________
______________________________________________________________________________
d) The producer sector supplies ______________________________________________
e) In return this sector receives ______________________________________________
which after costs are deducted leaves ______________________
f) Returns to producers vary because consumers _____________________________
______________________________________________________________________________
Let’s have another look at the model to see where our product and factor
markets fit in.
Income
Factor P
Markets
Factors or
Resources
Markets allow firms
and households to
interact.
S (house holds)
D (firms)
Q
Income
Factors or
Resources
Households
Firms
Goods & Services
Consumption
Product
Markets
P
S (firms)
D (households)
Q
(Output)
(spending)
In all types of markets, when there is a change in either supply or demand,
price should adjust so that S = D.
Essential Background – Dave King
3
3BECO – Economic policies and management
In this simple two sector model of the economy, equilibrium is the natural state
of the economy. In this state of balance, there is no change, ie no growth or
contraction. This is obviously a simplification of the real world because
economies are usually growing and sometimes they contract (have a recession)
and they have more than two sectors. We need to build our model and make it
more like the real world.
Adding the Finance Sector/Market (eg banks, stockmarket and
superannuation funds)
The addition of the capital or finance sector to the model takes us a little closer to
reality and introduces the leakage of saving and the injection of investment.
Savings (S): Savings is defined as income not spent which is placed within the
financial sector. Savings from households and firms (firms save too) form the
“pool” of surplus funds from which investment is financed. Saving is a leakage
from the circular flow of income. Households can either spend (consume) or save
their income therefore Y = C + S.
Investment (I): Investment refers to the creation of new productive capacity
through the purchase of capital goods. The funds used to do this are channelled
from savers to investors by the financial sector or capital market. Obviously how
efficient the financial sector is will be very important to the efficiency of the whole
economy. Investment is an injection into the circular flow. Firms produce either
consumer goods and services or goods and services for other firms (capital goods)
therefore O = C + I. The value of output is always equal to income (Y) because
firms pay households for resources. Therefore O = Y = C + I.
For the economy to remain in a state of equilibrium, S = I.
all savings в†’
The Finance Sector:
в†’ all investment
finance market
This is our new equilibrium condition. For the economy to be in balance,
savings and investment must be equal.
Factors of Production (land, labour, capital & enterprise)
THE CIRCULAR
FLOW OF INCOME
MODEL with S and I
Income (wages, profits, interest, & rent)
Households
Firms
Consumption (payment for goods & services)
Goods and Services
Savings
Essential Background – Dave King
Financial sector or
market
Investment
4
3BECO – Economic policies and management
Saving is a leakage from the flow of income in the simple two sector model
because it is money not spent on output. Keep in mind that the model is a
simplification of the real world. There are more flows than saving and
investment between the finance sector and the household and firm sectors.
Think about this.
Student Activities
1. Saving can be defined as ____________________________________________________
2. Investment can be defined as ________________________________________________
________________________________________________________________
3. a) When the finance sector provides loans to the business sector for
investment purposes, the return to the finance sector is
_________________________________________
b) When firms save profits with the finance sector they receive in return
_________________________________________
c) Households access loans from the finance sector and in return
have to pay
_________________________________________
4. a) Why do households and firms save? ______________________________________
______________________________________________________________________________
b) Which sector does most investing? Why? ________________________________
______________________________________________________________________________
5. If the word equilibrium means a state of balance with no tendency to change,
then explain the meaning of the term disequilibrium with reference to the finance
sector, ie. in terms of S and I.
________________________________________________________________________________
________________________________________________________________________________
________________________________________________________________________________
________________________________________________________________________________
________________________________________________________________________________
Essential Background – Dave King
5
3BECO – Economic policies and management
Adding the Public or Government Sector
The public sector introduces the leakage of taxation and the injection of
government spending and takes us even closer to the real world Australian
economy.
GOVERNMENT SPENDING (G): This includes expenditure by any of the three
levels of government in Australia on capital works (public works such as roads,
hospitals and defence equipment) and consumption (or recurrent) spending such
as welfare or transfer payments, salaries of public servants, police, nurses, judges,
etc and the running costs of government. Government spending plans are
announced in budgets.
TAXATION (T): Taxation is the main source of revenue for governments and
includes all kinds of direct and indirect taxes at each government level. It is
important for taxation to be seen as fair otherwise people will attempt to avoid
paying taxes and undermine the tax system. Taxes should not distort private
decisions to invest, produce, save, spend or work. In other words the taxation
system should help improve the operation of the economy, not impede it.
The equilibrium condition for the government sector is G = T.
For the economy to remain in a state of equilibrium, S + T = I + G
The Public Sector:
all taxes в†’
public sector
в†’ all government spending
Again keep in mind that the model is a simplification of the real world. There
are more flows than taxation and public spending between the public sector
and the rest of the economy.
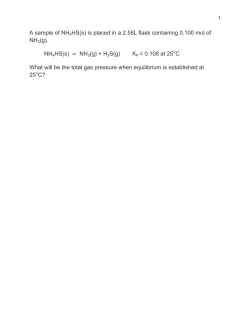
THE CIRCULAR
FLOW OF INCOME
MODEL with T and G
Factors of Production (land, labour, capital & enterprise)
Income (wages, profits, interest, & rent)
Households
Firms
Consumption (payment for goods & services)
Goods and Services
Essential Background – Dave King
Savings
Financial sector or
finance market
Investment
Taxation
Government (Public)
Sector
Government spending
6
3BECO – Economic policies and management
Student Activities
1. How does taxation affect the economy? ______________________________________
________________________________________________________________________________
________________________________________________________________________________
2. Give examples of goods and services firms and households purchase from the
public sector or receive in return for the taxes they pay.
________________________________________________________________________________
________________________________________________________________________________
________________________________________________________________________________
_______________________________________________________________________________
3. How does government contribute to the level of spending in the economy?
________________________________________________________________________________
_______________________________________________________________________________
Sometimes a government spends more money than it gets in taxes it. When it
does this it is called a budget deficit. When government raises more tax revenue
than it spends it is called a budget surplus.
Governments
provide postal
services
Governments provide
defence
Adding the Overseas Sector or International Market
The international market includes all the buying and selling of products
between Australia and the rest of the world. It introduces the leakage of imports
and the injection of exports and completes the expanded model of income flow.
IMPORTS (M): Imports are goods and services produced overseas and
purchased by Australians so the money paid for imports goes out of the
domestic economy. It is money not spent on domestically produced output.
EXPORTS (X): Exports are goods and services produced in Australia and sold
to overseas buyers so the money spent comes into the domestic economy and
becomes income to the producers of the exports.
Essential Background – Dave King
7
3BECO – Economic policies and management
The equilibrium condition for the international market is X = M.
The Overseas Sector: imports в†’
в†’ exports
international market
When added to the finance and public sectors:
S + T + M = I + G + X which is the equilibrium condition for the whole
economy.
Equilibrium occurs when total leakages = total injections,
ie.
S+T+M=I+G+X
{therefore Disequilibrium condition is: S + T + M в‰ I + G + X}
The completed circular flow model looks like this:
THE EXPANDED
CIRCULAR FLOW
OF INCOME
MODEL
Factors of Production (land, labour, capital & enterprise)
Income (wages, profits, interest, & rent)
Firms
Households
Consumption (payment for goods & services)
Goods and Services
Savings
Financial sector or
finance market
Investment
Taxation
Government (Public)
Sector
Government spending
Imports
Overseas Sector or
International Market
Exports
Keep going. You
can’t relax yet.
Essential Background – Dave King
8
3BECO – Economic policies and management
Student Activities
1.
Using the above diagram of the circular flow model, complete the following
activity. Identify the flow which best fits each situation:
a)
A shop assistant in Myer is paid her weekly wage _____________________
b)
A shoe factory borrows funds to install a new stitching machine
______________________
c)
Primary producers sell wool to China ________________________
d)
Cottesloe residents pay their local council rates _________________________
e)
A small firm uses profits to employ labour _____________________________
f)
Government pays unemployment benefits to the unemployed
________________________
g)
A local shirt manufacturer receives a shipment of buttons from Indonesia
_______________
2. Again referring to the diagram on the previous page, Use the word expansion
or contraction next to each of the following changes to either leakages or
injections to indicate the effect of the change on the equilibrium level of the
economy, assuming no other changes occur.
CHANGE IN LEAKAGE OR INJECTION
EFFECT ON ECONOMY
a)
Increased government spending
___________________________________
b)
Increased taxes
___________________________________
c)
Higher spending on roads and ports
____________________________________
d)
Increased saving
____________________________________
e)
Decreased imports
____________________________________
f)
Higher exports
____________________________________
g)
Increased exports & lower taxes
____________________________________
h)
Increased investment
____________________________________
i)
Lower exports
____________________________________
3. Discussion topic: What is likely to be the natural state of an economy? Is it
one of equilibrium or disequilibrium? Explain. Discuss this in groups of four with
each group reporting to the whole class.
Essential Background – Dave King
9
3BECO – Economic policies and management
When there is disequilibrium, firms are either producing more output than
consumers want to buy or not enough. They are either overproducing or
underproducing. These situations cause problems for the economy. If firms
produce more than consumers want to purchase, they will not be able to sell it all.
Prices will drop and firms will cut production to avoid losses. Firms will then need
fewer resources so demand in factor markets will decrease and the unemployment
of resources (including labour) will rise. The economy overall will slow down and
even fall into recession.
When consumers want to buy more than firms are producing, prices will
begin to rise and firms will increase production in order to meet rising demand
and make more profit. They will need more resources so demand in factor markets
rises and unemployment will fall. The growth of the economy overall will speed up
and if firms have difficulty keeping up with the pace of demand, inflation will
occur. The speeding up and slowing down of an economy is normal. Over time
economic growth changes as it moves through alternating periods of strong growth
and slow or even negative growth (recessions). This path of varying economic
activity is called the Business Cycle.
In this macroeconomic model of an economy, equilibrium occurs where
total spending (aggregate expenditure or demand, AE or AD) = total output of all
firms (aggregate supply or AS). Since the total value of all output is also equal to
the total cost of producing that output, ie the total returns to all the factors of
production involved in producing the output, total output = total income (Y). Thus
AD = AS = Y at equilibrium. This is just another way of expressing E = O = Y
Student Activity
Extended writing activity: In terms of the circular flow of income, explain what
is meant by equilibrium and disequilibrium. Do a draft first which you must proof
read and edit. Write a neat final draft which you will hand to your teacher.
Economic Activity
Economic activity varies over time. The reasons for the variability in economic
growth are to do with changes in the components of aggregate spending. There are
many factors which cause these components to change, in particular the factors
influencing the two most important components of consumption and investment
expenditure. A knowledge and understanding of these determinants is very
important to policy formulation at the business and government level and in
making sound decisions at the household level.
In standard Keynesian macroeconomic theory, the level of economic activity
depends on aggregate (total) spending. Consumption (C) is the major component of
aggregate expenditure and income (Y) is the main factor affecting the level of
consumption. A large proportion of C is non-discretionary spending – this is
spending on essential goods and services (needs). We can also call this
autonomous consumption and it is independent of the level of income. This means
that even when income is zero, there must be some spending going on as
households need to buy food, clothing, accommodation, etc. Spending on wants
and luxuries is called discretionary consumption.
Essential Background – Dave King
10
3BECO – Economic policies and management
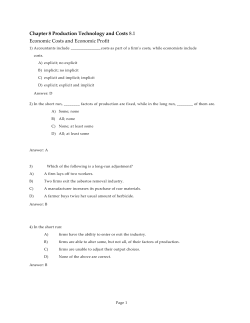
The Business Cycle (introduction)
An economy naturally goes through periods of strong growth when the rate of
increase in output and employment is stronger than average (boom) and at
periods of weak growth and sometimes even negative growth (contraction or
recession). Neither booms nor recessions are desirable because of the problems
associated with them. Therefore government has a role in smoothing this
naturally volatile path of the economy over time. This is known as the
government’s macroeconomic or demand management task which involves trying
to influence the level of aggregate demand (AD) or total spending in the economy.
The government has 3 tools with which to do this –
i)
ii)
iii)
its own spending (G),
taxation (T) and
interest rates (r)
Government spending and taxation are known as FISCAL POLICY (FP) and
adjusting interest rates is known as MONETARY POLICY (MP).
Government spending and taxation changes are announced in May each year in
the federal budget. Interest rate changes are the responsibility of the Reserve
Bank of Australia (RBA) which is an independent government authority.
If the economy is growing too slowly or is in recession (negative growth or
contraction), the level of total spending in the economy needs to be boosted. A
higher level of AD will mean firms will produce more goods and services and
employ more factors of production. (Think of the circular flow model).
Unemployment will fall, incomes will rise and the economy will move into an
upswing in its growth cycle.
% О” in Real GDP
Peak or Boom
downswing
Smoother cyclical path
due to fiscal and
monetary policies
Peak or Boom
upswing
Trough (sometimes recession)
Trough
Time
Peak or boom: inflation and balance of payments problems occur, unemployment
is low. Too much spending is the problem. Production of goods and services
cannot keep up with demand (AD>AS) so the macroeconomic solution is to slow
demand. The government can do this by cutting its own level of spending or
increasing taxation (new taxes or raising tax rates). The RBA will increase interest
rates which will slow down borrowing (credit growth) and hence spending by
making the cost of loans higher. These actions are known as restrictive or
contractionary FP and MP.
Trough/recession: unemployment is high and economic growth is very low or
negative. The problem here is total spending in the economy is too low. Output is
Essential Background – Dave King
11
3BECO – Economic policies and management
greater than demand so firms cut back on production and their demand for
inputs (factors of production) and therefore employment and incomes fall. In this
situation more demand is needed which government can directly provide by
increasing its own spending or it can cut taxes and hope that the increase in
disposable income will lead to more spending. The RBA will cut interest rates in
this situation which lowers the cost of borrowing. These actions are known as
expansionary FP and MP.
It is important for the economic authorities (government and RBA) to know where
the economy is in its growth cycle. Obviously action should be taken before the
economy enters into the extreme phases of the business cycle. Sound analysis of
regular economic data is very important in achieving this task. Below is a graph
of the real business cycle for Australia since the last recession based on data
from the Australian Bureau of Statistics.
Student Activities
1. Identify the significant troughs and peaks.
2. Look at the following list of economic indicators and discuss what you would
expect them to be showing in the different phases of the business cycle. Suggest
fiscal and monetary action which could be taken to smooth the economic cycle.
Inflation
Peak ______________________________________________________________________
Trough ____________________________________________________________________
Action _____________________________________________________________________
Employment/Unemployment
Peak ______________________________________________________________________
Trough ____________________________________________________________________
Action _____________________________________________________________________
Essential Background – Dave King
12
3BECO – Economic policies and management
Retail sales (HH spending in retail outlets or shops)
Peak ______________________________________________________________________
Trough ____________________________________________________________________
Action _____________________________________________________________________
Interest rates
Peak ______________________________________________________________________
Trough ____________________________________________________________________
Action _____________________________________________________________________
Business investment
Peak ______________________________________________________________________
Trough ____________________________________________________________________
Action _____________________________________________________________________
Wage growth
Peak ______________________________________________________________________
Trough ____________________________________________________________________
Action _____________________________________________________________________
Credit growth
Peak ______________________________________________________________________
Trough ____________________________________________________________________
Action _____________________________________________________________________
2. Explain how changing interest rates can affect the level of economic activity.
________________________________________________________________________________
________________________________________________________________________________
________________________________________________________________________________
________________________________________________________________________________
Essential Background – Dave King
13
MACROECONOMIC THEORY I
- Macroeconomics – what is it about
- Skills - data interpretation
- Circular Flow and Disequilibrium
2010
1.
Macroeconomic theory I
Objectives:
• define and explain the difference between macroeconomics and microeconomics.
• select and organise sources of economic information
• apply appropriate methods of recording and organising macroeconomic information e.g. tables showing
changes in economic data over time.
• apply mathematical techniques relevant to macroeconomic analysis specifically calculating and interpreting
rates of change in GDP, calculating percentage change in economic variables.
• draw conclusions from collected economic information and data.
• use the circular flow model to describe the interaction of sectors in the economy
• describe the relationship between total spending, output and income
• describe the concept of equilibrium
• explain how changes in leakages and injections can alter the level of equilibrium (disequilibrium)
What is Macroeconomics?
“I have called my theory a general theory. I mean by this that I am chiefly concerned
with the behaviour of the economic system as a whole, with aggregate incomes,
aggregate profits, aggregate output, aggregate employment, aggregate investment,
aggregate saving rather than with the incomes, profits, output, employment, investment
and saving of particular industries, firms or individuals.” (Keynes, J.M. The General
Theory of Employment, Interest and Money, Macmillan, Cambridge University Press,
1936 p xxxii)
As the above quotation by John Maynard Keynes in his The General Theory of
Employment, Interest and Money (1936) tells us, macroeconomics deals with the
broad economic picture, ie. the economy as a whole. Understanding
macroeconomics allows us to get an overview of the whole economy and
understand the relationships between its parts, so that policy-makers can develop
policies which achieve stable, sustainable economic growth and maximise human
welfare. Broadly speaking macroeconomics deals with three interrelated measures
of economic activity or aggregates:
• total output (production) of goods and services.
• total spending (expenditure) on goods and services.
• total income paid to the owners of all factors of production.
The Australian Bureau of Statistics (ABS) collects data on many types of
economic activity under the above three categories and presents a systematic
summary of national economic activity known as the Australian National Accounts
(ANA). This information provides a statistical picture of the structure and
performance of Australia’s economic system. The ANA have developed over the
years to provide statistical information to allow analysis and policy-making from
what is essentially a Keynesian perspective.
Macroeconomics as a field of study owes its origins to J. M. Keynes who
published his ideas in his famous book quoted from above. In it he set out to
challenge mainstream (neoclassical) economic thought which he claimed failed to
explain or offer solutions to the high unemployment of the 1920s and 1930s in
Britain. Keynes saw the Depression essentially as a failure of government to take
action to compensate for declining private consumption and investment spending.
3BECO – Economic policies and management
He was critical of the view that supply creates its own demand (Say’s Law), that is,
the income paid to factors of production “... must necessarily be spent in the
aggregate, directly or indirectly, on purchasing the product”. The belief was that
firms as a whole group, will always sell what they produce and never face a
situation of declining aggregate demand for their product and the resulting
surplus in productive capacity. If aggregate household demand for goods and
services falls, due to increased aggregate saving, then the rise in saving will be
matched by an equivalent rise in aggregate investment spending, ie. S always
equals I. To quote from Keynes again:
“Those who think in this way are deceived, nevertheless, by an optical illusion, which
makes two essentially different activities appear to be the same. They are fallaciously
supposing that there is a nexus which unites decisions to abstain from present
consumption with decisions to provide for future consumption; whereas the motives
which determine the latter are not linked in any simple way with the motives which
determine the former.” (Keynes, p21)
In other words motives to save are very different from motives to invest.
The main premise of neoclassical economics is that all markets work by
themselves via a flexible price mechanism which automatically adjusts in response
to market forces and always guarantees the full employment of resources across
the economy. This assumes perfectly flexible prices. There is therefore no need for
government intervention.
Keynes asserted there was no such automatic mechanism and that markets are
imperfect. Some prices are “sticky” downwards, ie. do not fall readily in response
to falling demand. This is particularly the case with wages. As money wages refuse
to fall while the prices of goods, services, assets and factors of production other
than labour drift downwards, unemployment rises. Therefore the economy could
settle at a level (equilibrium) below the full employment of resources.
In fact a below full employment equilibrium level of economic activity is more
often the case. Therefore government should intervene by raising aggregate
demand or aggregate expenditure which would shift the economy back towards
full employment. This approach to macroeconomic management is known as
demand management. Its premise is that economic activity is dependent on the
total level of spending which can and should be managed. Keynes’s theory of
income determination expands on this and seeks to answer three basic questions:
*
a)
b)
c)
What determines the general level of economic activity?
Why does the level of economic activity tend to fluctuate over time ?
How can governments influence the general level of economic activity?
Macroeconomics is concerned with:
1)
Inflation - what determines the general level of prices, why is it
important and what can be done about it?
2)
Unemployment (UE) – what causes unemployment? Why does the
unemployment rate fluctuate and why does high unemployment persist?
What is the appropriate policy response to an unemployment problem?
3)
Gross Domestic Product (GDP) - what determines a country’s level of
aggregate output? Fluctuations in GDP cause fluctuations in living
standards. What can governments do to sustain economic growth?
4)
Interest Rates - what determines interest rates and what effect do
interest rate changes have on an economy?
Macroeconomic Theory I
15
3BECO – Economic policies and management
5)
Balance of Payments (BOP) and Exchange Rates - why do fluctuations
occur? Why does Australia have a persistent current account deficit and
how do changes in the value of the Australian dollar impact on the
economy? How can government action influence them? What is the link
between the BOP, exchange rates and foreign debt?
Macroeconomics provides elected governments with:
•
tools for analysing the performance of the economy overall.
•
the knowledge and understanding to formulate policies aimed at
stabilising the economy and maximising human welfare.
Measuring macroeconomic Activity
The broadest aggregate indicator or measure of economic activity is Gross
Domestic Product (GDP). There are three approaches to measuring it:
a)
The income approach - measures GDP by summing up all incomes paid
to factors of production (wages, salaries, profits, rent, interest).
b)
The expenditure approach - measures GDP by summing up all
spending on final goods and services produced in Australia. Export earnings are
added and spending on imports is deducted.
c)
The production approach - measures GDP by summing up the market
value of final goods and services, ie. the gross output of firms minus the cost of
intermediate goods and services (goods and services used in the production of final
goods and services). This leaves the value added by all firms, the sum of which is
GDP.
Theoretically, at equilibrium the three approaches result in identical estimates
of GDP, however because of the complexities of the real world and the need to use
different data sources for each method, the value of GDP obtained from each
approach differs. Because of the difficulty in obtaining the great amount of
accurate and detailed information on the outputs and inputs of producers, and the
problem of double counting, only the expenditure and income approaches are
published in the ANA.
What is microeconomics?
Microeconomics concerns the behaviour of single economic agents or units
such as consumers or households, firms, industries, sectors and product and
factor markets. While macroeconomics deals with the big picture, microeconomics
looks at the economics of the small unit. Microeconomics deals with such
questions as:
•
what determines the relative prices of goods and services?
•
what determines an individual’s consumption patterns?
•
how are decisions made by firms as to what, how, how much and for
whom to produce?
•
how can individual units of the economy be made to work more
efficiently?
Remember the total product (output) of an economy is made up of the
production of many individual units (in both product and factor markets). This
includes both the private and public sectors. A knowledge of both macro and
Macroeconomic Theory I
16
3BECO – Economic policies and management
microeconomics is necessary for understanding our economy.
The macroeconomy is made up of many different sectors and markets. The
operation of these individual components determines the overall performance of the
macroeconomy, therefore the more efficient the individual parts are, the more
efficient the economy is as a whole.
VOCAB: Macroeconomic equilibrium - a point at which there is no tendency for the level of
income, expenditure or output to change - a static state, ie. the economy is neither expanding
nor contracting. Of course in the real world, the economy is always changing so equilibrium
is not the normal state of the economy.
STUDENT ACTIVITY 1.1
Model Answer
Topic: Write a paragraph on the following question:
What is the essential difference between Neo-classical and
Keynesian economic theory?
Step 1:
To begin you must extract the essential ideas or concepts from
a reference or text.
A retrieval chart is a very useful tool for summarising text particularly
with compare and contrast type questions like this one. Below is a
completed chart with keywords/phrases selected from the text in this
section which will form a basis for the answer to the question.
Retrieval Chart:
NEOCLASSICAL
Вѓ Markets work by themselves
Вѓ Flexible price mechanism
Вѓ Automatic adjustment to clear
markets
Вѓ Full employment guaranteed
Вѓ No government intervention
Step 2:
Вѓ
Вѓ
Вѓ
Вѓ
Вѓ
KEYNESIAN
Markets are imperfect
Prices are sticky downwards
No automatic market clearing
Unemployment is usual
Government intervention
needed
Construct a paragraph based on the information in the retrieval
chart. Here is one possible example:
Neoclassical economists say that markets work by themselves
automatically through the price mechanism. Keynesian economists on
the other hand dispute this. They say that prices in some markets are
sticky downwards. This means such markets are imperfect and will
not clear. Neoclassical economists claim that automatic price
adjustment will always mean full employment and therefore there is
no need for government intervention in the economy. Keynesians
however disagree and assert that unemployment will be a problem
when prices fail to automatically adjust and governments should
intervene to prevent this.
Macroeconomic Theory I
17
3BECO – Economic policies and management
1. Use the same procedure to answer the following question:
Distinguish between microeconomics and macroeconomics.
Step 1: Retrieval Chart:
MICROECONOMICS
Step 2:
MACROECONOMICS
Paragraph:
__________________________________________________________________________________________
__________________________________________________________________________________________
__________________________________________________________________________________________
__________________________________________________________________________________________
__________________________________________________________________________________________
__________________________________________________________________________________________
__________________________________________________________________________________________
__________________________________________________________________________________________
__________________________________________________________________________________________
__________________________________________________________________________________________
__________________________________________________________________________________________
__________________________________________________________________________________________
__________________________________________________________________________________________
2. Exchange answers with a partner. Read each other’s work and then discuss
points of agreement and disagreement. Award a mark out of 5 for your partner’s
work and write a constructive comment beneath the paragraph.
Macroeconomic Theory I
18
3BECO – Economic policies and management
Interpreting Data
It is very important to develop a familiarity with statistical information in
economics. Just as doctors diagnose the state of a person’s health from various data
like body temperature, blood pressure, cholesterol level, etc, so economists diagnose
the state of the economy’s health from statistical data on things like investment,
prices, consumption, employment, company profits, credit, housing loans, wage
growth, trade data and so on.
Examine the table of selected key data below and think about what it might tell
you about the difference in the performance of the economy in 2000-01 and 2003-04.
Key Indicator
GDP
Investment (private)
Retail Turnover
Household Consumption
Imports
Income Growth
Unemployment
2000-01 % change from
previous year
2003-04 % change from
previous year
1.9
-11.1
0.9
3.7
-0.9
4.8
6.4
4.0
8.4
7.6
5.5
12.7
5.2
5.8
(source: Australian Economic Indicators, August 2006, 1350.0, ABS)
Analysis of Data
• GDP or gross domestic product is the total value of all output (minus the value
of intermediate goods ie. components or parts). We want to see this growing from
year to year because by increasing production, jobs are created and more goods and
services are produced to meet people's needs and wants. The data shows the
economy was weak in 2000-01 but grew quite strongly in 2003-04. Economic
growth is measured in terms of the change in GDP. Growth on average in Australia
from 1996 to 2007 was about 3.5% per annum.
• Investment is a volatile indicator as you can see in the table. It fell in 2000-01
by 11.1% but bounced back the following year and remained strong until 2007-08.
This is good because rising business investment shows firms are confident and
optimistic which is a good sign for future economic activity. Investment is essential
to increasing the economy’s productive capacity which Australia needs to do to
meet strong domestic and global demand.
• Retail turnover was very soft in 2000-01 due to the economic slowdown
weakening consumer confidence, however, it rose in the following years and was
strong in 2003-04. Retail turnover is the major component of household
consumption.
• Household consumption is the biggest component of aggregate demand
accounting for between 55 - 60% of all expenditure in the economy. It grew over
the period in the table and was the main reason for the GDP result in 2003-04.
• Imports fell in 2000-01 year because the domestic economy slowed down and
spending was weaker but in 2003-04 consumers and firms spent more as the
economy strengthened. Much of this spending goes on imported consumer and
capital goods. Imports increase with economic growth.
Macroeconomic Theory I
19
3BECO – Economic policies and management
• Income growth effects household spending power and firm production costs. The
rate of growth in wages and salaries reflects the strength of demand for labour
relative to supply of labour in the labour market. The data in the table shows the
growth in employee earnings which would strengthen demand in goods and services
markets.
• Unemployment fell between the two years which is to be expected since the
economy grew over the period. As the demand for labour strengthened after the
slowdown in the economy, labour costs rose.
This list of data and the brief analysis above is an important part of what
economics is about. By the end of this course you will have a pretty good idea of how
to do this yourself. Remember knowledge is power and economic knowledge is
especially empowering.
Don’t forget:
GDP = AD = C + I + G + (X - M)
Anything which affects the components of AD obviously affects GDP and the rate of
economic growth. Data enables us to see what is going on with each of the above
components. The constant flow of economic data from sources such as the ABS will
be a major focus for us through the year.
Macroeconomic Theory I
20
3BECO – Economic policies and management
STUDENT ACTIVITY 1.2
Examine the table of data below from the Australian National Accounts provided by
the Australian Bureau of Statistics (January and November, 2009) and then
complete the questions. The table shows the contribution to GDP as measured by
expenditure from households (C), firms (I), government (G) and net exports (X-M).
Australia's National Accounts Nov 2009 ($millions)
Period
Cons
I
Govt
Bus
G1
G2
Invent
∆
Exports
Imports
1994–95
370,421.0
110,370.0
14,199.0
127,069.0
14,463.0
3,479.0
129,105.0
91,514.0
681,004.0
1995–96
383,800.0
114,653.0
13,385.0
132,404.0
14,223.0
106.0
142,020.0
95,130.0
708,925.0
1996–97
393,269.0
126,463.0
11,285.0
134,938.0
15,467.0
958.0
157,668.0
104,500.0
736,573.0
1997–98
411,390.0
143,603.0
9,546.0
140,092.0
15,099.0
629.0
164,232.0
114,894.0
769,719.0
1998–99
431,961.0
146,079.0
13,846.0
146,363.0
15,835.0
5,894.0
167,853.0
120,592.0
809,744.0
1999–00
450,892.0
160,953.0
10,757.0
151,152.0
18,597.0
2,760.0
182,190.0
135,524.0
842,134.0
GDP
2000–01
467,187.0
143,083.0
10,248.0
154,309.0
18,848.0
2,469.0
195,980.0
134,161.0
858,134.0
2001–02
481,205.0
157,135.0
11,679.0
158,587.0
20,025.0
162.0
194,109.0
136,121.0
890,743.0
2002–03
497,721.0
182,769.0
12,441.0
163,610.0
20,648.0
905.0
193,255.0
153,919.0
919,247.0
2003–04
524,706.0
198,166.0
13,877.0
170,057.0
21,736.0
6,209.0
197,382.0
173,993.0
956,017.0
2004–05
548,015.0
209,562.0
15,659.0
176,447.0
23,057.0
6,102.0
203,407.0
195,124.0
982,786.0
2005–06
562,227.0
227,868.0
18,579.0
180,839.0
23,785.0
2,298.0
207,886.0
209,246.0
1,012,269.0
2006–07
584,924.0
238,948.0
18,756.0
186,203.0
27,003.0
2,652.0
215,695.0
228,452.0
1,045,674.0
2007–08
608,428.0
264,271.0
19,935.0
192,611.0
28,731.0
5,114.0
224,500.0
259,977.0
1,084,451.0
2008-09
617,114.0
272,593.0
22,394.0
198,964.0
31,229.0
-8,898.0
228,526.0
253,479.0
1,095,370.0
Annual % percentage change
Notes on tables:
Cons = personal household
consumption spending
I = private fixed capital formation
(investment)
Govt Bus = government businesses
like Australia Post
Pub Corp = public or government
corporation spending on investment eg
investment spending by Telstra
G1 = government final consumption
spending eg wages of government
workers and general daily running costs
of government
G2 = government fixed capital
formation eg spending by government
on infrastructure such as roads
Invent = changes in value of unsold
stock (inventories)
Cons
I
Pub
Corp
G1
1994–95
5.1
11.0
19.4
3.5
1995–96
3.6
3.9
-5.7
4.2
Period
Export
s
Import
s
7.1
4.8
16.6
4.3
-1.7
10.0
4.0
4.1
G2
GDP
1996–97
2.5
10.3
-15.7
1.9
8.8
11.0
9.8
3.9
1997–98
4.6
13.6
-15.4
3.8
-2.4
4.2
9.9
4.5
1998–99
5.0
1.7
45.1
4.5
4.9
2.2
5.0
5.2
1999–00
4.4
10.2
-22.3
3.3
17.4
8.5
12.4
4.0
2000–01
3.6
-11.1
-4.7
2.1
1.4
7.6
-1.0
1.9
2001–02
3.0
9.8
14.0
2.8
6.2
-1.0
1.5
3.8
2002–03
3.4
6.5
3.2
3.1
-0.4
13.1
3.2
2003–04
5.4
8.4
11.5
3.9
5.3
2.1
13.0
4.0
2004–05
4.4
5.8
12.8
3.8
6.1
3.1
12.1
2.8
2005–06
2.6
8.7
18.6
2.5
3.2
2.2
7.2
2006–07
4.0
4.9
1.0
3.0
13.5
3.8
9.2
2007–08
4.0
10.6
6.3
3.4
6.4
4.1
13.8
2008-09
1.4
12.3
3.3
8.7
1.8
-2.5
(ABS Australian Economic Indicators, Jan & Nov 2009, 1350.0)
1.
Look at household final consumption expenditure for 1996-97. As a
percentage of GDP it accounts for: (Calculate all answers to two
decimal places)
393,269 x 100 = 53.39%
736,573
Macroeconomic Theory I
21
3BECO – Economic policies and management
a) What is the contribution to GDP of household final consumption
expenditure for 2004-05?
________%
b) Do the same calculation for any other year. ________%
c) What observation can you make about these three figures?
_________________________________________________________________________________
2.
Calculate the contribution to total GDP of private gross fixed capital
formation (private investment expenditure) for:
a) 2002-03 ________%
b) 2008-09 ________%
c) Calculate the percentage change for each year.
2002-03 _______________
3.
2008-09 _________________
Comment on the level of investment over the period in the table.
__________________________________________________________________________________
__________________________________________________________________________________
4.
Calculate the combined contribution to total GDP of government
consumption and general government fixed capital formation
(government investment) for:
a)
5.
1996-97 ________%
b)
2006-07 ________%
Calculate the annual growth rates in GDP in the last four years of
the table and write your calculations in the spaces provided in the
table above. (Calculate to one decimal place using the process
below in the example)
eg.
By how much did the economy grow in 1997-98?
GDP for 1996-97:
GDP for 1997-98:
calculation is:
$736,573
$769,719
$769,719 - $736,573 x 100 = 4.5%
$736,573
What do you notice about the progress of economic growth (GDP)
over the period in the table? Discuss with a partner.
______________________________________________________________________________________
6.
Examine the graph showing domestic demand (C+I+G) and GDP
(C+I+G+X-M).
(source: data from ABS on Reserve Bank website, http://www.rba.gov.au
accessed on the 24th November 2009)
Macroeconomic Theory I
22
3BECO – Economic policies and management
a) The data in the graph shows that domestic or final demand is
__________________ (greater or less) than GDP for most of the period in the
graph.
b) The difference between the two is explained by ___________________________
c) In 2001, the economy would have slipped into recession but for a surplus
on the trade account (net exports). True or False
____________________
The ABS releases economic data each week which reveals the state of the
economy in the recent past. If students regularly follow this statistical information,
they can develop a good feel for what is happening in the actual economy and relate
it to the theory learnt in the classroom. This is an essential skill and those students
who become competent in using economic data will add value to their written work
and do well.
Some data are more significant and relevant than other data, eg. employment
and wages growth figures. These two sets of numbers are very important indicators
of what is going on in the economy at the macro level and they have an important
bearing on Monetary Policy decisions by the Reserve Bank of Australia (RBA).
Regular examination of this weekly flow of information will enable students to
identify where the economy is likely to be in terms of the business cycle and suggest
appropriate policy direction.
This information is covered in newspapers such as the Australian Financial
Review each week. Get into the habit of looking for, reading and collecting
informative articles on the economy each week.
VOCAB: Leading indicators - indicate change in economic activity before if happens. Examples
include housing loans (indicate future building of houses), job vacancies (indicate demand for labour
and hence future employment growth), surveys of consumer and business confidence (indicate future
likely changes in household consumption and investment spending), interest rates such as the 10 year
bond rate, stock market indices.
Coincident indicators - indicate what is happening in the economy currently, eg. manufacturing,
mining and rural output, retail turnover, motor vehicle registration, construction. The problem with
this data is that by the time it becomes public, it is not current.
Lagging indicators - indicate changes which are the result of past economic activity, ie. data which
reflects changes which have already happened in the economy, eg. employment, unemployment, wages
growth, company profits.
Macroeconomic Theory I
23
3BECO – Economic policies and management
BACK TO THE CIRCULAR FLOW OF INCOME MODEL
Economic models are used to distil the most important elements from a very complex
real world. Their purpose is to reduce the complicated details of the economy to a
simple form to allow us to understand the interrelationships between these elements.
Models allow analysis to focus on important economic events that constantly go on
around us and make it easier to predict and explain the behaviour of important
economic variables. One of the most useful and simple of economic models is the
circular flow model. It shows the five major sectors of an economy:
1. household sector made up of consumers who provide consumption spending
2. firm sector made up of producers who provide investment spending
3. finance market also known as the money or capital market which enables
consumers to save and firms to invest
4. government or public sector which provides government spending
5. international market or foreign trade sector which provides net exports.
The relationship between each of the above sectors is illustrated in the diagram of
the circular flow model.
Resources
Households
Income
Consumption
Firms
Output
Saving
Finance market
Investment
Government
sector
Taxation
Public sector
Imports
Foreign market
Exports
In this Keynesian macroeconomic model of an economy, equilibrium occurs where
total spending (aggregate expenditure or demand, AE or AD) = total output of all firms
(aggregate supply or AS). Since the total value of all output is also equal to the total
cost of producing that output, ie. the total returns to all the factors of production
involved in producing the output, total output = total income (Y). Thus AE or AD = AS
= Y at equilibrium.
STUDENT ACTIVITY 1.3
Let’s look at each sector of the model (in a state of equilibrium).
1. The Finance market: savings в†’ finance sector в†’ investment
When added to the simple circular flow model of households and firms
equilibrium is when Y = C + S and Y = C + I
therefore
C+S = C+I
or
S = I
Explain the consequences of a rise in S on the circular flow of income (ie. on econ activity).
Macroeconomic Theory I
24
3BECO – Economic policies and management
_____________________________________________________________________________
_____________________________________________________________________________
2. The Public Sector:
taxation в†’ public sector в†’ government spending
when added to the finance sector equilibrium occurs when:
Y = C + S + T and Y = C + I + G
therefore
C+S+T=C+I+G
or
S+T=I+G
Describe the consequences of a fall in G on economic activity.
_____________________________________________________________________________
_____________________________________________________________________________
3. The Overseas market:
imports в†’ overseas sector в†’ exports
when added to the finance and public sectors equilibrium occurs when:
Y = C + S + T + M and Y = C + I + G + X
therefore
C+S+T+M=C+I+G+X
or
S + T + M = I + G + X which is the complete equilibrium
condition.
Describe the consequences of a rise in exports on the circular flow of income.
_____________________________________________________________________________
_____________________________________________________________________________
Total spending (AE or AD) is : C + I + G + X – M and since total spending = total
income, then: Y = C + I + G + X – M
Since total income = total output then: Y = AD = GDP = C + I + G + X – M
Equilibrium also occurs when total leakages = total injections,
ie S + T + M = I + G + X
In a simple closed economy with no government sector, equilibrium must be
when S = I.
In the expanded 5 sector model any change to leakages or injections will disturb
equilibrium and cause the economy to contract or expand unless offset by an equal
or opposite change in injections or leakages.
The 5 sector model is a simplification of the real world. In reality all sectors are
connected by a multitude of flows. Examine the diagram in the sample below. Look
at the flows between the Firms, Financial and Public sectors.
Macroeconomic Theory I
25
3BECO – Economic policies and management
4. Now you mark in the flows between the Households, Firms and the Financial
sectors.
Macroeconomic Theory I
26
3BECO – Economic policies and management
LEAKAGES, INJECTIONS, EQUILIBRIUM AND DISEQUILIBRIUM
VOCAB: Disequilibrium - a state of change due to disturbance in either
leakages (L) or injections (Inj). The change sets off a chain reaction of
adjustment throughout the economy. The economy itself adjusts towards a
new equilibrium position above or below the previous one. In the real world
such change is constantly going on because of unplanned and unpredictable
changes to leakages and injections. Thus the economy is said to be dynamic
What happens when L в‰ Inj (or S в‰ I in the 3 sector model)? When disequilibrium occurs,
the economy automatically begins an adjustment process which takes it to a new
equilibrium position. How does this work?
From the circular flow model we can see that L must equal Inj if equilibrium is to be
preserved. However if domestic consumption happens to be less than anticipated by
firms, which may be caused by a rise in S, T or M, then balance is disturbed (L > Inj).
Keynes focused in particular on savings and investment (assume no government or
overseas sectors). When households consume fewer goods and services than firms
produce because they save more for some reason, inventories or stocks of unsold goods
rise signalling to producers to cut production (O). Since the producer’s demand for
factors of production (DF) or inputs, is derived from consumers’ demand for finished
goods and services, producers will reduce their demand for inputs. As the employment
of inputs (resources) falls, income falls. As income falls, all leakages fall (along with
consumption). This process continues until at some point aggregate L again equal
aggregate Inj (and S = I) where there is no further tendency to change (equilibrium is
restored).
In summary form:
if L > Inj → C↓ → inventories↑ → O↓ → DF↓ → UE↑ → Y↓ → L↓ → L = Inj (economy contracts)
and:
if L < Inj → C↑ → inventories↓ → O↑ → DF↑ → UE↓ → Y↑ → L↑ → L = Inj (economy expands)
Note: disequilibrium (imbalance) is the normal condition of the economy. Equilibrium
describes a static condition which does not exist. It is a theoretical goal to which the
economy is constantly self-adjusting but never attains. In the real world the economy is
constantly in motion, ie. it is dynamic. Keynes’ great contribution to economic theory
was the notion that this elusive target of equilibrium did not naturally occur at a point
where there was the full employment of all resources.
Unanticipated Imbalance between Leakages and Injections and the Role of Inventories in
the Three Sector Model
If C < O then L > Inj (ie. AD < AS; excess output and inventories rise)
If C > O then L < Inj (ie. AD > AS; shortage of output and inventories fall)
If C = O then L = Inj (ie. AD = AS; no change to inventories)
The amount which households intend to spend on finished goods and services and firms
intend to spend on production in aggregate at the beginning of any period may be very
different from what they actually end up spending because circumstances change.
Macroeconomic Theory I
27
3BECO – Economic policies and management
Consumers and firms are very different groups of people who have different motives for
spending and investing. The economy is complex and ever changing. Many factors
influence decisions to spend, save and invest, so it is highly unlikely that the plans of
these different groups and their millions of decisions, will coincide in aggregate. Firms
plan ahead what they will produce depending on what they expect consumers to
purchase, and therefore what they will invest in order to produce that anticipated output
if extra productive capacity is needed.
Some observations:
a) Imbalances are always occurring in any economy because of changes to
injections and leakages.
b) Imbalances are eventually self-correcting. How quickly this occurs depends
on policy and how flexible the economy is.
c) Serious imbalances may eventually self-correct with serious consequences.
Can you think of examples?
Macroeconomic policy should aim to prevent serious imbalances developing in an
economy.
Let's assume a three sector model of the economy (ie. no government or overseas
sectors). Assume that after making plans, firms decide they need to invest $20 million.
Equilibrium will only be preserved if aggregate saving happens to also be $20 million
which is unlikely. If it turns out that firms don’t sell all of that anticipated output, then
their inventories rise (inventory investment) if they are goods producers, or they simply
experience declining sales and unused capacity if they are service providers. Services
cannot be stored like goods however for the purposes of this simple model we will
assume they can.
Using the simple circular flow model to illustrate:
For equilibrium to exist S = I:
Y = O = 100m
FirmsВ Household
sВ C = 80m
S = 20m
Finance
Sector
I = 20m
Let’s assume households save an extra $5 million. This means $5 million of goods and
services remain unsold and are added to inventories (inventory investment). In other
words, at existing income S > I (disequilibrium):
Macroeconomic Theory I
28
3BECO – Economic policies and management
Y = O = 100m
FirmsВ Household
sВ C = 75m
(C↓ = 5m)
S = 25m
(S↑ = 5m)
Finance
Sector
I = 20m
(inventory investment = 5m)
S > I by $5 million, ie. S = $25 million which is greater than I ($20 million).
Changes in inventories or stocks (including the value of unsold services) = the shortfall in
consumption. Firms decrease production anticipating reduced levels of consumption in
the next time period.
When S < I, stocks will decrease (inventory disinvestment). Firms will increase
production to maintain stock levels (using surplus capacity) so they will be prepared for
future increases in demand. So using the same example: when C rises by $5 million
(ceteris paribus), savings fall by $5 million.
STUDENT ACTIVITY 1.4
Using the model below, fill in the details when S < I, ie. when C increases unexpectedly
by $5 million. In your file, describe what will happen in the economy as a result of this
imbalance or disequilibrium condition.
Y = O = 100m
FirmsВ HouseholdsВ C = _____
S = _____
Finance
Sector
I = 20m
Note: In this simple model illustrating the concept of disequilibrium, the real world
complication of the services sector and technological change are ignored. We must
acknowledge that much expenditure is on services which cannot be stored like physical
goods as inventories, and when combined with the information technology revolution,
have reduced somewhat the significance of inventories as a buffer between producers and
consumers. The amazing improvements in software, computer power and the internet
make possible the rapid transmission of information and data so that changes in market
demand are communicated swiftly to producers, and allow for impressive improvements
in productivity so that firms can respond quickly to these shifts in demand without
maintaining large inventories. 'Just-in-time' supply management can make firms
vulnerable to supply shocks. Eg car parts producer goes broke or workers go on strike в†’
disrupts car assembly plant at Holden or Ford
Macroeconomic Theory I
29
3BECO – Economic policies and management
The important point to absorb is that disequilibrium (S в‰ I) triggers an adjustment
process which takes the economy towards a new equilibrium level which has
consequences for aggregate employment, income and output.
This diagram below illustrates the adjustment process which occurs when S and I are not
in equilibrium.
THE PROCESS OF ECONOMIC ADJUSTMENT IN A MARKET ECONOMY
Households
(consumers)
consumption
markets for
goods &
services
At a given level of Y, if C↓ → S↑ so that
S>I
Inventories↑ (inventory investment) &
surplus capacity↑
Production↓ → firms demand fewer
factors of production
employment↓ → income↓ & S↓ til S=I
and equilibrium is restored at a lower
level of economic activity.
economic contraction
production
Firms
(producers)
At a given level of Y, if C↑ → S↓ so that
S<I
inventories
change
+ve or -ve
production
changes
+ve or -ve
employment &
income change
+ve or -ve
Inventories↓ (inventory disinvestment) &
surplus capacity↓
production↑ → firms demand more
factors of production
employment↑ → income↑ & S↑ til S=I and
equilibrium is restored at a higher level of
economic activity.
economic expansion
STUDENT ACTIVITY 1.5
1.
a) What happens when saving and investment are not equal?
_____________________________________________________________________________
_____________________________________________________________________________
_____________________________________________________________________________
Macroeconomic Theory I
30
3BECO – Economic policies and management
_____________________________________________________________________________
_____________________________________________________________________________
_____________________________________________________________________________
_____________________________________________________________________________
b) Explain in your own words why it is unlikely that aggregate savings and
aggregate investment would ever be equal.
_____________________________________________________________________________
_____________________________________________________________________________
_____________________________________________________________________________
_____________________________________________________________________________
_____________________________________________________________________________
2.
Multiple Choice:
MC questions are an important assessment instrument in economics
because they really test your thinking skills, therefore they will appear
frequently throughout this book. There are a number of strategies you
can use to tackle MC questions. The most obvious are:
• first look for the correct answer or the “most correct”. Sometimes
more than one answer appears correct.
• failing that, eliminate the incorrect ones.
• focus on key words and read carefully.
• if you are not sure, guess.
Complete the following questions:
i.
GDP is a measure of
a)
the value of a country’s total output of all goods and services.
b)
the total supply of money flowing around the economy at any point in time.
c)
total annual output minus the value of government goods and
services.
d)
total annual output minus the value of intermediate goods and
services.
ii.
If planned leakages are greater than planned injections
a)
the level of output will remain the same.
b)
the level of output will go up.
c)
the level of output will fall.
d)
none of the above.
iii.
Three leakages are
a)
taxation, import spending and government spending.
b)
savings, import spending and investment spending.
c)
import spending, taxation and savings.
d)
savings, taxation and export earnings,
Macroeconomic Theory I
31
3BECO – Economic policies and management
iv.
Which one of the following will not be included in the calculation of GDP to
avoid the problem of double counting?
a)
a loaf of bread sold by a delicatessan.
b)
white goods sold in department stores.
c)
microchips sold to computer manufacturers.
d)
a tennis professional’s winnings.
v.
Output is always equal to
a)
GDP and inventory increases.
b)
investment plus saving.
c)
total saving plus total production.
d)
total spending and inventory adjustments.
vi.
If total injections are less than total leakages then
a)
aggregate demand must become greater.
b)
total expenditure must become smaller.
c)
exports will always restore equilibrium when they equal imports.
d)
it’s not possible to know what will happen.
vii.
In 1936 J. M. Keynes published a radically different analysis of economy activity.
His basic idea was that
a)
governments should help private enterprises when they get into
trouble.
b)
economic activity depends on the level of total spending.
c)
employment depends on the level of investment spending by the
private sector.
d)
governments should leave economic management to private business
to conduct.
viii.
Government spending has a similar effect on the circular flow of income as
a)
investment.
b)
saving.
c)
imports.
d)
wages and profits.
ix.
Macroeconomics is all about economic aggregates. Which of the following does
not accurately comply with this statement?
a)
It is about unemployment and the level of foreign investment in the Australia.
b)
It is about business activity and the general price level of goods and services.
c)
It is about fluctuations in the cycle of economic activity and the level of
national expenditure.
d)
It is about government spending more on housing and the introduction of a
GST.
x.
In a closed economy traditional macroeconomic theory would have us accept that
the Federal government
a)
should balance its budget during a downturn.
b)
should ensure that G > T when investment is outstripped by saving.
c)
should always spend more than it taxes.
d)
should ensure that G < T when saving is less than consumption.
Okay, now go back through this
section and make a quick list of
the most important things you
have learned on each page.
Macroeconomic Theory I
32
MACROECONOMIC THEORY II
-
The Business Cycle (continued)
Components of Aggregate Expenditure
Macroeconomic Equilibrium
The Multiplier
2010
2.
Macroeconomic theory II
Objectives:
•
•
•
•
•
•
•
•
explain the characteristics and causes of the business cycle
outline the components of aggregate expenditure i.e. consumption, investment,
government spending, net exports
explain the factors which affect the components of aggregate expenditure
demonstrate and explain the relationship between the consumption function, the
marginal propensity to consume and the marginal propensity to save
explain the concept of macroeconomic equilibrium
demonstrate and explain the impact of changes in aggregate expenditure on the
equilibrium level of income/output (Gross Domestic Product — GDP)
demonstrate and explain the multiplier process
examine the economic impact of changes in each of the components of
aggregate expenditure
Features of the Business Cycle
Peak or boom – the main features are low unemployment or overfull employment
(eg lots of overtime). High demand and inflationary pressures mount as
competition for resources bids up prices. Nominal interest rates (r) rise to
compensate for inflation (ie. to preserve real interest rates). Upswing has peaked.
This is the top of the cycle. The trade deficit has probably peaked too (M>X).
The main characteristics are:
Peak
Вѓ
Вѓ
Вѓ
Вѓ
Вѓ
Вѓ
Вѓ
Вѓ
interest rates peak
inflation peaks reflecting high scarcity
trade deficit peaks as imports peak (M>X)
unemployment bottoms (full employment)
shortages in factor & product markets peak
maximum productive capacity of the
economy is achieved
overfull employment of resources в†’ factor
prices rise
productive investment is overtaken by
speculative investment
Downswing – high inflation and high r cause C to fall → inventories rise above
desired levels в†’ production falls and firms cut prices to reduce stocks в†’
investment declines and output, Y and employment fall. After the initial slowdown
(early downswing) the economy may experience negative growth (recession). As AD
continues to fall, the economy contracts and inflation and r fall. Business and
consumer outlook becomes more pessimistic. The trade deficit declines as M fall
and attention shifts to UE.
3BECO – Economic policies and management
The main characteristics are:
Early downswing
Вѓ
Вѓ
Вѓ
Вѓ
Вѓ
Вѓ
Вѓ
Вѓ
Вѓ
Late downswing
Вѓ
Early downswing inflation rate slows (disinflation)
interest rates still high but start to decline
Trade deficit starts to fall as % GDP
AD growth slows as C slows and I falls → O↓
Employment growth slows & UE starts to rise.
Late downswing Inflation falls further and may turn negative
(deflation)
interest rates fall further
Trade deficit turns to surplus as imports fall
discretionary C & I decline в†’ surpluses in
factor & product markets drive prices down in
those markets - in labour markets quantity
adjusts rather than price (wages slower to fall)
→ UE ↑
all forms of investment fall & trade surplus rises
further
Trough - unemployment peaks with low or even negative inflation (deflation) if
trough is deep (recession), low output, negative net investment, pessimism high,
low r. Growth decline has bottomed. This is the bottom of the cycle.
The main characteristics are:
Вѓ
Вѓ
Вѓ
Вѓ
Trough
Вѓ
Вѓ
UE peaks as oversupply reaches maximum in
the labour market
interest rates & inflation bottom
imports decline bottoms and trade surplus
approaches peak
GDP at lowest (negative if recession) begins to
rise at this point as stocks are depleted and
firms have to rebuild inventories
maximum surplus capacity has been reached
lowest level of demand in factor and product
markets is reached and wage decline bottoms
Upswing - inflation and r are low due to the trough. Discretionary C starts to
rise. Since inventories are low and need to be increased to cater for early rises
in C, production rises. The trough or recession ends and the economy moves
into a new period of growth. As demand for goods and services rises, demand
for factors of production increases в†’ output, employment and Y increase в†’ the
recovery strengthens. Business and household optimism returns. The trade
surplus starts to fall as more imports feed into economy.
Macroeconomic Theory II
34
3BECO – Economic policies and management
The main characteristics are:
Вѓ
Вѓ
Вѓ
Вѓ
Вѓ
Late recovery
Вѓ
Early recovery
Вѓ
Early recovery low inflation due to weak HH and firm spending
employment starts to rise but UE is still high
interest rates are low since inflation is still low
household spending starts to pick up → O↑
trade account is still in surplus (X>M) but starts to
decline
large idle capacity still in economy в†’
investment weak as firms increase O with
existing equipment
trade account moves closer to deficit as M rise
Late recovery inflation starts to pick up in factor &
product markets as demand increases
Вѓ interest rates rise
Вѓ UE continues to fall в†’ aggregate Y rises
Вѓ consumption is strong as wages and
sentiment rise
Вѓ the trade deficit rises as imports rise (M>X)
Вѓ surplus capacity diminishes в†’ investment
in new plant & equipment picks up
Вѓ
Understanding the phases of the
business or economic cycle is
essential to understanding the
behaviour of the economy.
Countercyclical policies (fiscal and monetary policies) attempt to reduce the size
of business fluctuations by reducing AD in booms and increasing AD in recessions.
However the problem with countercyclical policies is they are subject to time lags
and may aggravate the stages in the business cycle, eg the 1990 - 1991 recession
resulted from excessive rises in r when the economy was already starting to slow.
The rises in r came too late in the cycle. The central bank now seeks to pre-empt
rising inflation by raising r before inflation starts to take off. Government
macroeconomic policies aim at managing the level of AD. They attempt to reduce
the cyclical fluctuations shown in the diagram as the unbroken line so that the
economy follows a flatter path (the broken line).
% О” Real GDP
Path of economy without
countercyclical policies
Peak or boom
Peak or boom
+
downswing
Recovery or
upswing
Trough
0
–
Path of economy with sound
countercyclical policies by
government
Trough/Recession –
2 quarters in a row of
negative growth
Time/years
The steeper the upswing the more rapid
inflation will be as AD outstrips growth
in AS. This also causes CAD to
accelerate. Authorities intervene to slow
the rate in AD.
Macroeconomic Theory II
The steeper the downswing the more rapidly UE
increases and investment falls. The conventional
view (Keynesian) is that the recession will
worsen and may become a depression without
government intervention.
35
3BECO – Economic policies and management
STUDENT ACTIVITY 2.1
1. Without referring back to the previous notes indicate next to each economic feature
for each phase of the business cycle what you would expect to happen.
Upswing (early recovery)
Inflation: ________________________________________________________________________
Consumption: ____________________________________________________________________
Employment: ____________________________________________________________________
Imports: _________________________________________________________________________
Exports: _________________________________________________________________________
Investment: ______________________________________________________________________
Interest rates: ____________________________________________________________________
Confidence: ______________________________________________________________________
Upswing (late recovery)
Inflation: ________________________________________________________________________
Consumption: ____________________________________________________________________
Employment: ____________________________________________________________________
Imports: _________________________________________________________________________
Exports: _________________________________________________________________________
Investment: ______________________________________________________________________
Interest rates: ____________________________________________________________________
Confidence: ______________________________________________________________________
Peak (boom)
Inflation: ________________________________________________________________________
Consumption: ____________________________________________________________________
Employment: ____________________________________________________________________
Imports: _________________________________________________________________________
Macroeconomic Theory II
36
3BECO – Economic policies and management
Exports: _________________________________________________________________________
Investment: ______________________________________________________________________
Interest rates: ____________________________________________________________________
Confidence: ______________________________________________________________________
Downswing (slowdown в†’ recession)
Inflation: ________________________________________________________________________
Consumption: ____________________________________________________________________
Employment: ____________________________________________________________________
Imports: _________________________________________________________________________
Exports: _________________________________________________________________________
Investment: ______________________________________________________________________
Interest rates: ____________________________________________________________________
Confidence: ______________________________________________________________________
Trough (bottom of recession)
Inflation: ________________________________________________________________________
Consumption: ____________________________________________________________________
Employment: ____________________________________________________________________
Imports: _________________________________________________________________________
Exports: _________________________________________________________________________
Investment: ______________________________________________________________________
Interest rates: ____________________________________________________________________
Confidence: ______________________________________________________________________
A trough can deepen into a
recession or even a depression if
authorities pursue the wrong
policies.
Macroeconomic Theory II
37
3BECO – Economic policies and management
2. Examine the data (from Macro I). What evidence of a business cycle is apparent
in the data?
Key Indicator
GDP
Investment (private)
Retail Turnover
Household Consumption
Imports
Income Growth
Unemployment
2000-01 % change from
previous year
1.9
-11.1
0.9
3.7
-0.9
4.8
6.4
2002-03 % change from
previous year
3.2
16.2
5.0
3.6
13.1
4.9
5.8
(source: Australian Economic Indicators, August 2006, 1350.0, ABS)
______________________________________________________________________________
______________________________________________________________________________
______________________________________________________________________________
______________________________________________________________________________
______________________________________________________________________________
______________________________________________________________________________
______________________________________________________________________________
______________________________________________________________________________
______________________________________________________________________________
3. Construct an answer plan for the following TEE style question using the note-making
framework below.
a) Explain what is meant by the business cycle?
(6 marks)
b) Discuss the relationship between the business cycle and the rate of unemployment
and inflation.
(10 marks)
Macroeconomic Theory II
38
3BECO – Economic policies and management
a) Definition and diagram:
b) UE, inflation and the BC.
i) Peak or Boom:
ii) Downswing or slowdown:
iii) Trough or recession:
iv) Upswing or recovery:
Macroeconomic Theory II
39
3BECO – Economic policies and management
4. Read the following article and identify (highlight) the key ideas.
The blessings of the recession
In November 1990, then treasurer Paul Keating
responded to the confirmation that the economy was in
recession by commenting: “This is the recession that
Australia had to have.”
While this blunt assessment of the economy came back
to haunt Keating and reinforced a perception that he was
uncaring, it was a remarkably accurate comment. The
legacy of the early 1990s recession is an economy that
has performed better than at any time since the 1960s.
The only negative factors prevailing are unemployment
- which is always too high – and the current account
deficit, which could be a problem if financial markets
consider it so. It is enlightening to contrast Australia’s
economic performance pre- and post-recession and to
judge what the recession changed.
In the late 1980s, inflation was bubbling at about 7
percent, having spent all of the 1980s many percentage
points above the OECD average. It was a major factor
undermining Australia’s international competitiveness.
The recession enabled these previously entrenched price
pressures to be squeezed out of the economy.
Wages were, of necessity linked to productivity and
central wage increases were finally dead, which
enhanced the economy’s growth potential over the
1990s. Further, in 1993, Reserve Bank governor Bernie
Fraser saw an opportunity in the aftermath of the
recession to lock in low inflation by announcing a target
for inflation of 2 to 3 percent over the course of the
cycle. This enabled interest rates to fall, matching the
inflation performance, to the extent that Australia is now
a low interest rate economy.
Low inflation has been fundamental to the tremendous
growth record, which has seen annual GDP
growth...average 4.3 per cent since 1991-92. The
dominant contributor to this performance has been
unprecedented growth in business investment. Some
increase in investment was always likely after the
recession as the capital stock recovered and rapid
technological change demanded increased expenditure.
The strength of business investment after the recession
owes more to other factors – the low inflation climate;
the opening of Australia to competitive pressures; and
the corporate restructuring that chopped the dead wood
from middle management and lowered operating costs.
In addition, the investment strategy of many corporations
returned to highly productive, medium-term investment
plans.
For the household sector, the distortion of investment
by Stephen Koukoulas
decisions in the 1980s caused by entrenched high
inflation also undermined the equity market, encouraging
savings to go into “unproductive” assets and forcing
corporations to rely on debt to fund expansion. In an era
of high inflation and high interest rates, this allocation
was not sustainable.
As an example of the change in consumer preferences
for investment, the Westpac/Melbourne institute
Consumer Sentiment survey reveals that shares are seen
as “the wisest place for savings” by 30 percent of
consumers, up from about 3 percent in the late 1980s...
In the late 1980s, even with the booming economy, the
unemployment rate was unsustainable below 7 percent.
When it fell below that rate in 1989, wages spiralled.
Little wonder most estimates of Australia’s natural rate
of unemployment were horribly high, about 7 to 7.5
percent.
The only significant disadvantage of the recession was
the misery of cyclically high unemployment, failing
businesses and general economic malaise. If the changes
in the economy could have been brought about without a
recession, then the pain could have been minimised or
avoided. Unfortunately, the recession was needed to
force changes. That might sound harsh but without a
recession it was unlikely that the process of labourmarket reform would have occurred...
The urgency of the recession brought about changes
that are now setting the scene for the structural rate of
unemployment to fall, possible as low as 5 to 6 percent.
For the business sector, the simple formula of
maintaining profits by increasing prices had to change.
While profits were reasonable under this scenario, it
meant that innovation, capital productivity and efforts to
develop new markets through export were second-order
issues for many firms. These are first-order issues now
and have made corporate Australia highly efficient...
A recession is a harsh way to bring about change, but
when an economy is so unbalanced and rigid, it can be
the means to cleanse the system. ...
If one wanted to be optimistic, the Australian
experience could be seen as a model for the recent
recessions in Asia. As the Asian tiger economies recover,
they are likely to emerge in a structurally better position.
The innovative skills, productivity, dynamism of
industry, export focus and ability to expand in many
Asian countries will support growth as the financial
systems recover. ...
(The Australian Financial Review, 21st June, 1999)
Why does the author of the article use the word “Blessings” in the title?
5. Practice examination question:
a) Discuss the characteristics of the boom phase of the business cycle. (9 marks)
b) Discuss why the business cycle peaks and eventually turns down.
Macroeconomic Theory II
(6 marks)
40
3BECO – Economic policies and management
Components of Aggregate Expenditure
Read the notes in the table below
Introduction
Consumption
Investment
Government
Spending
Net Exports
Conclusion
At equilibrium AE = total spending = GDP = Y, therefore when AE rises в†’ GDP rises в†’ Y rises.
• AE = C+ I + G + X - M. When any of the components Δ, AE will Δ.
• = 60% of GDP approx. – very stable due to non-discretionary nature of much spending.
• refers to household final consumption expenditure – main determinant is disposable Y
• includes spending on finished durable & non-durable consumer goods such as cars, household goods
(appliances, furniture, white goods), clothing, food, holidays, and services such as health, education &
entertainment.
• 15-20% of GDP approximately.
• refers to spending on capital or producer goods (K) (also known as private fixed capital formation)
• can be broken into machinery & equipment, housing and non-dwelling construction.
• is most volatile of components due to durability of K goods, irregularity of innovation & different capital
needs across different industries.
• main determinants are expected profitability of firms and interest rates which is the cost of capital. As
unit production costs ↑ (ceteris paribus) profitability ↓→ investment ↓ (see later section on accelerator).
• investment is engine of economic growth and jobs.
• 20 - 25% of GDP approx. (ie. federal govt – much larger share if include other levels of government).
• provides essential public services & goods like education, health, roads, welfare, defence.
• revenue raised mainly by taxation – asset sales important too, eg. Telstra.
• important tool of macroeconomic management – fiscal policy used to stabilise the economy – distributive
(Y distribution) and allocative (resource use) roles important too.
• spending needs determined by social needs, size of public sector and point the economy is at in the
business cycle в†’ determines taxation and borrowing needs of govt.
• influence of pressure groups important, eg. environmentalists, unions, business & Aboriginal groups.
• varies monthly – strong growth in services and elaborately transformed manufactures (ETMs) over the last
2-3 decades. Minerals particularly important over the last 5 years or so.
• types of exports & imports important → level of demand and prices affect X income + M payments.
• influence of exchange rate and terms of trade on X receipts and M payments.
• world economic activity very important especially since Australia is still mainly a commodity exporter
(cyclical demand for our exports в†’ affects net exports).
• strong import demand tied to domestic economic cycle ie, during strong growth import demand rises
в†’ trade deficit rises (positive or direct relationship between level of income and import demand).
• Australia’s international competitiveness is important → linked to domestic policies.
• knowledge of components important to understand nature of economic activity and for formulating
stabilisation policy.
• changes in AE components give clues to sources of economic instability.
• aim of govt is to stabilise the economy (reduce the severity of fluctuations).
• recession → expansionary policies to stimulate components – AE rises → UE falls.
• boom → contractionary policies dampen components - AE falls → inflation falls.
STUDENT ACTIVITY 2.2
Speed Writing Activity: Writing a full answer to an essay question is a time
consuming way of preparing for exams, however, speed writing in short bursts for
5-15 minutes is an efficient way of improving writing skills and hence exam
skills.
Study the essay note-making framework on the components of aggregate
demand for about 5-10 minutes. Then write as rapidly as you can for about 8
minutes on a piece of A4 file paper on the question below. Time yourself and
stick to the time limit. Read through what you have written. Compare with
notes in the framework and give yourself a mark out of 5. If possible get
someone else to read your answer and mark it too.
Question:
Macroeconomic Theory II
Describe the components of aggregate demand.
41
3BECO – Economic policies and management
Changes in macroeconomic activity are most often caused by changes in the
components of aggregate spending. The most important components are
consumption and investment. Think of the simple two sector circular flow model:
Resources
Income
Households
(consumers)
Firms
(producers)
Consumption
Firms and households are the two
major parts of an economy.
Approximately 80% of economic
activity is accounted for by the
interaction of these two sectors in
product and factor markets. So
anything which causes changes in
the behaviour of firms and
households will have an effect on
the level of economic activity.
Output
Factors Affecting Consumption and Investment
You could read about the factors affecting consumption and investment in any
text book which you would then need to summarise in note form. Your notes can
then be used for study purposes when needed. It is useful to �do something’ with
the notes apart from simply reading them. Organising information into some sort
of user friendly format is a good idea. You have to read it, re-read it and think
about how to format it and in doing so you learn it. Information can be presented
in diagram form which makes it easier to learn. Think about it. How hard is it to
learn directly from a text book?
Below is a diagrammatic presentation of factors affecting consumer spending.
Disposable income (Yd ie. Y
after tax) – if tax rate↓ or
income↑ → Yd↑ → C↑ and
vice versa.
Stock of wealth (assets such as
property & shares) – as wealth↑ →
C↑. If asset prices↓ as in stock
market fall, wealth↓ and C↓.
Consumer confidence – when
optimism ↑ → C↑ & when
pessimism↑ → C↓.
Employment & economic growth
generally are factors affecting
confidence which in turn feeds back
to economic and employment
growth.
CONSUMPTION
Inflationary expectations
в†’ destabilises consumption
patterns.
Macroeconomic Theory II
Distribution of Y – redistn to
lower Y groups through tax and
welfare system → C↑ (amount
spent of each extra $ of income is
higher for low Y groups).
Consumer indebtedness &
Interest rates – as consumer
debt↑, vulnerability to higher
interest rates↑ therefore C↓
and S↑ when interest rates↑.
42
3BECO – Economic policies and management
Below is a diagrammatic presentation of factors affecting investment spending
(capital expenditure or capex).
Profit expectations or
expected rate of return – if
expected profits↑→ I↑.
Market prospects for future
sales (domestic and foreign
markets) – as prospects↑→ I↑.
Stocks (inventories) on
hand – falling stocks
during strong AD → O↑
→ I↑.
INVESTMENT
Govt policy & taxation may
encourage or discourage I.
Technology Δ – in times of Δ
investment will ↑ (eg. I.T. &
Biotech revolutions).
Extent of idle or surplus
productive capacity – a low
level of excess capacity as in
period of strong economic
growth → I↑.
Inflationary expectations – concern
about price О”s of inputs like labour
and materials – if inflation
expectations↑, I↓ and vice versa.
О”s in consumer spending
в†’ О”s in investment
(induced I). As C↑→ I↑ and
vice versa.
Interest rates (r) – inverse
relationship between I and r (ceteris
paribus)
r = opportunity cost of investing in
productive capacity. Also r is cost of
borrowing.
If r > expected rate of return → I↓.
If r < expected rate of return → I↑.
All the above factors influence the level of consumer and business confidence.
When these factors are favourable C and I will rise and the economy will expand
creating jobs and raising national income. However, if these factors are negative
the economy will contract with employment and income falling. Knowledge of these
factors helps policy makers manage AD through macroeconomic policies.
STUDENT ACTIVITY 2.3
1. For each of the determinants listed below, write a paragraph explaining how it
influences consumption and investment spending. Use the notes in the framework as
your guide for ideas and develop them into sentences and paragraphs. When
finished, read your paragraphs to a partner and assist each other to improve them.
The first one (disposable income) has been done for you as a sample.
Macroeconomic Theory II
43
3BECO – Economic policies and management
CONSUMPTION
Disposable income: Most income is spent so when after tax income rises, either
through a rise in income or a fall in the tax rate, consumption spending should
rise ceteris paribus. When disposable income falls consumption will fall too. The
fall in spending across all types of goods and services is not uniform. Discretionary
spending on luxury items will fall more than spending on non-discretionary items
such as food, shelter, power, telephone and water bills, etc.
a) Stock of wealth:
_________________________________________________________________________________
_________________________________________________________________________________
_________________________________________________________________________________
_________________________________________________________________________________
b) Consumer indebtedness:
_________________________________________________________________________________
_________________________________________________________________________________
_________________________________________________________________________________
_________________________________________________________________________________
INVESTMENT
a) Expected profitability:
_________________________________________________________________________________
_________________________________________________________________________________
_________________________________________________________________________________
_________________________________________________________________________________
b) Interest rates:
_________________________________________________________________________________
_________________________________________________________________________________
_________________________________________________________________________________
_________________________________________________________________________________
Macroeconomic Theory II
44
3BECO – Economic policies and management
c) Government policy:
_________________________________________________________________________________
_________________________________________________________________________________
_________________________________________________________________________________
_________________________________________________________________________________
d) Inflationary expectations:
_________________________________________________________________________________
_________________________________________________________________________________
_________________________________________________________________________________
_________________________________________________________________________________
2. Read the following extract (from the Australian Financial Review, 23-8-06)
on factors affecting consumption and answer the questions following it.
Asset rises offset growing debt: RBA by Mark Davis
“Australian family finances are in good shape, contrary to a popular misconception
that mounting debt is undermining the household sector’s financial position,
according to a senior Reserve Bank of Australia executive.
The RBA’s assistant governor …, said yesterday that rising household debt in recent
years had been more than outweighed by the rising value of financial assets held by
households….
[He] … said increases in the household debt interest burden – the share of
disposable income needed to repay housing loans and other borrowings – had been
more than offset by rising incomes families were earning on investments such as
super funds. …
Household financial assets had increased more than debts over the last decade. And while
household net interest payments had increased as a share of income, so too had their
investment earnings.”
a) What two factors affecting consumption are being discussed in the article?
i) _____________________________________________
ii) _____________________________________________
Macroeconomic Theory II
45
3BECO – Economic policies and management
b) Explain how each factor would impact individually on consumer sentiment
(confidence) and consumption spending.
_________________________________________________________________________________
_________________________________________________________________________________
_________________________________________________________________________________
_________________________________________________________________________________
c) Explain the interplay of these two factors and their effect on consumer
sentiment and expenditure in the view of the RBA official.
_________________________________________________________________________________
_________________________________________________________________________________
_________________________________________________________________________________
_________________________________________________________________________________
d) What could happen to prove the RBA official wrong?
_________________________________________________________________________________
_________________________________________________________________________________
_________________________________________________________________________________
_________________________________________________________________________________
3. Homework: Study your explosion diagram on the determinants of investment
for about 5 minutes. Repeat the speed writing procedure for the following
question on a piece of paper in your file.
Outline the major determinants of the level of private investment expenditure.
Macroeconomic Theory II
46
3BECO – Economic policies and management
4. Complete the multiple choice questions below:
4.1.
Over time consumption and investment may both rise if
a) the level of marginal tax rates have risen.
b) the level of disposable incomes are expected to increase.
c) there has been a sustained rise in interest rates over several
months.
d) people expect inflation to rise over the following 6 months.
4.2.
If the intersection of the consumption function and the 45 degree line
shifts up in the Keynesian model, then this indicates consumers have
most likely decided to
a) increase their saving for some reason apart from an increase in
income.
b) increase their saving due to an increase in income.
c) reduce their saving due to a decrease in income.
d) reduce their saving for some reason other than a change in
income.
4.3.
The main determinant of consumer spending is
a) income distribution.
b) extent of consumer optimism.
c) availability of credit.
d) level of disposable income.
4.4.
Keynesian theory would suggest that in a closed economy government
should
a) spend less than it taxes when S > I.
b) spend more than it taxes when S > I.
c) always balance budgets.
d) always spend more than it taxes.
4.5.
In Australia the largest component of AD is
a) consumption.
b) government spending.
c) private investment spending.
d) net exports.
4.6.
If firms underestimate household consumption spending (S<I), then
a) inventories will fall.
b) inventories will rise.
c) inventories will not change.
d) confidence is likely to be negative.
4.7.
In the Keynesian model, investment
a) is always equal to saving.
b) is a leakage.
c) depends entirely on interest rates.
d) is strongly influenced by expectations about future sales.
4.8
When AD > AS
a) S > I
b) S = I
c) S < I
d) E = O = Y
Macroeconomic Theory II
47
3BECO – Economic policies and management
В The Keynesian Model of Expenditure and Income Analysis
AS = total or aggregate production of all firms in the economy. Firms will only produce
what they can sell, so at equilibrium total output = total spending. Total spending of
course equals the total income paid to factors of production used in the productive
process which equals the total cost of production. This relationship is shown in the 45
degree line in the simple diagram below. At any point on this line total output = total
income.
C Line of equilibrium – any point on the line is a potential output level. If total spending = this value of total output, then this is the equilibrium level of output (macroeconomic equilibrium). C3 C2 C1 °
YВ 45
Y1В Y2В Y3В В Total output = GDP which also equals total income so the horizontal axis (x axis) is both
GDP and Y. The vertical axis (y axis) indicates the total spending or expenditure required
to consume that value of output. The line of equilibrium does not move in this model. It is
always a 45Вє line because at any point on the line, total output = total income.
AE (AD) = total spending (total demand) in the economy but in the three sector model of
the economy, total spending consists of spending by households only (on goods and
services) ie. AE = C+I. Consumption is the largest component of aggregate expenditure in
the Australian economy and can be shown in a simple diagram:
CВ AD=CВ YВ В В В 0В Note the slope of the AE or consumption function, reflects the fact that as income rises
household consumption spending increases. In this Keynesian model of the economy,
investment is assumed to be autonomous, ie. unrelated to changes in income. In other
words, investment is constant at any level of income.
48
Macroeconomic Theory II
    3BECO – Economic policies and management
В When investment is added to consumption (C + I) the consumption function shifts up
with no change in its slope.
CВ В В C+IВ О”IВ CВ YВ 0В Finding Equilibrium
When the AE function is combined with the line of equilibrium we get:
В В В ExpenditureВ AE=C+IВ AE=OВ EeВ Y=C+IВ В°
45  Y/GDP 0 Ye Equilibrium occurs at one point only – where AE and 45º line intersect. Only here will
total spending = total output = total income. The point is known as the equilibrium level
of income, output and employment (Ye). It is only at this point that the plans of producers
match the spending decisions of consumers. Keynes’s major point was that equilibrium
did not automatically occur at a full employment level (Yfe). Decisions to spend and
produce are made by different groups of individuals for different reasons. It is largely a
matter of chance if these decisions coincide at a level where all of a nation’s resources,
particularly labour, are fully utilised.
    Topic 3 – Macroeconomic theory II    49 3BECO – Economic policies and management
В В В В В В Expenditure
EquilibriumВ InventoryВ Investment
(stocksВ rise)В AE<O
&В SВ >В I
AE=C+IВ e
EeВ (currentВ salesВ =В currentВ output)В AE=OВ В В В В AE>OВ &В SВ <В IВ В В InventoryВ DisinvestmentВ В (stocksВ fall)В В В В°
В 45 В В В В В 0В В Y1В В В В Disequilibrium occurs either side of Ye.
Y/GDPВ Ye
Y2В Below Ye - at Y1 AE > O or I > S. Firms cannot meet the current demand for goods and
services because households are spending more than firms anticipated. Stocks or
inventories fall (disinvestment) and production increases (upward movement along line of
equilibrium). As O↑ employment rises, incomes ↑ → consumption ↑ and S↑ (movement up
the AE curve). The economy moves towards equilibrium (Ye), the gap between AE and AS
diminishes as they converge, and disappears at Ye. At this point savings have risen to
equal the level of autonomous investment.
STUDENT ACTIVITY 2.4
Above Ye - Explain in your own words.
__________________________________________________________________________
__________________________________________________________________________
__________________________________________________________________________
__________________________________________________________________________
__________________________________________________________________________
__________________________________________________________________________
__________________________________________________________________________
Topic 3 – Macroeconomic theory II    50 3BECO – Economic policies and management
В Changes in Equilibrium: AE Increases or Decreases
The previous diagram shows us why there is only one equilibrium point. However the
equilibrium point will change when AE changes (ie any of the components of AE change).
i) If AD decreases:
ii) If AD increases:
В В EquilibriumВ В AE1В В e1В В AE2В В e2В В В В В Y/GDPВ 0В В Y1В Y2В В IfВ AEВ fallsВ (ieВ totalВ spendingВ falls)В в†’В stocksВ riseВ В в†’В OВ fallsВ в†’В YВ fallsВ (Y
1В в†’В Y2)В ieВ economicВ В activityВ decreasesВ В ExpenditureВ ExpenditureВ EquilibriumВ e2В AE2В AE1В e1В 0В Y/GDPВ Y1В Y2В IfВ AEВ risesВ (ieВ totalВ spendingВ rises)В в†’В stocksВ fallВ в†’В OВ risesВ в†’В YВ risesВ (Y1В в†’В Y2)В ieВ economicВ activityВ increasesВ Note when the government sector is added, AE = C + I + G and when the overseas sector
is added, AE = C + I + G + (X - M).
В STUDENT ACTIVITY 2.5
Describe with the aid of diagrams what the likely effect on economic activity would be, ie.
on the equilibrium level of national income, when each of the following situations occurs
(ceteris paribus):
i)
A rapid decline in global economic growth causes commodity prices to collapse
reducing Australia’s export revenue.
           _______________________________________________________________________________ _______________________________________________________________________________ _______________________________________________________________________________ _______________________________________________________________________________ Topic 3 – Macroeconomic theory II    51 3BECO – Economic policies and management
В В ii) The federal government increases government spending during a serious economic
downturn (recession) and rising unemployment.
В В В В В В В В В В В В _______________________________________________________________________________В _______________________________________________________________________________В _______________________________________________________________________________В _______________________________________________________________________________В _______________________________________________________________________________В Consumption and Saving Functions
Consumption is the major component of AE - its main determinant is income. Income and
spending are directly related (ie. when Y↑, AE↑) which is expressed in the consumption
function. Consumers do not necessarily spend all their income. Some is saved. The level
of saving is also directly related to income. This can be illustrated with a saving function.
The relationship between Y, C and S is shown in the following schedule:
В В The data in the
table is illustrated
in the model on
the next page.
Y C S 0 50 ‐50 50 75 ‐25 100 100 0 150 125 25 200 150 50 250 175 75 300 200 100   Topic 3 – Macroeconomic theory II    52 3BECO – Economic policies and management
В You can see that Y = C + S and
a) If Y > C, then saving is positive. eg. Y = 200, C = 150, S = 50
b) If Y < C, then saving is negative. eg. Y = 50, C = 75, S = -25 (dissaving)
c) If Y = C, then saving is zero.
d) If Y = 0, then consumption is exactly balanced by dissaving.
Households have to spend a minimum amount to survive (eg. food, clothing, shelter,
power, water and transport) in a modern economy. This is achieved by drawing on their
savings (dissaving) or someone else’s (borrowing). This survival spending is called
autonomous (or non-discretionary) consumption and explains why the consumption
function begins on the vertical axis above the origin
in the following diagram.
          If you don’t get this then you must ask your teacher! The Consumption and Saving Function Model before the addition of Investment (ie in the
simple 2 sector model where C=O=Y.
 Topic 3 – Macroeconomic theory II    53 3BECO – Economic policies and management
          C    C                                    Saving       100      75      50          0 e1 dissaving   Y=C Y         100 S S Saving (Y>C)   0       ‐50 Y Ye Dissaving (Y<C) Cool model!  Topic 3 – Macroeconomic theory II    54 3BECO – Economic policies and management
  C,I             150         75          50      0     S,I           0         ‐50
  Saving   C+I Y=C+I ∆I e2    C dissaving Add investment to the model. Assume I = 25. This means that investment is 25 at all levels of income. e1 Y        100      125      150    175 Saving dissaving S S=I=25   I=25 Investment is
autonomous –
same at all levels
of income
YВ Y1В В В В Y2В STUDENT ACTIVITY 2.6
1. Worked Example
What happens at a disequilibrium level of income in relation to the top (C function) and
bottom panels (S function) of the model above when Y = 175?
At Y = 175, AS > AE and S > I.
When AS > AE, firms will cut production as stocks rise (output falls). This will result in
rising unemployment and falling income. Spending will fall → AE ↓. AE and production
(O) will converge at Y = 150 where equilibrium will be restored. When S > I firms cut
production they will demand less labour – as unemployment ↑ and Y ↓, savings ↓ until S =
I and equilibrium is restored at Y = 150.
Explain in your own words what happens when Y = 125?
В __________________________________________________________________________________________________
__________________________________________________________________________________________________
__________________________________________________________________________________________________
Topic 3 – Macroeconomic theory II    55 3BECO – Economic policies and management
В 2. Multiple choice questions.
Diagram for Q
ExpenditureВ Equilibrium
C+I
CВ C
BВ В В AВ в—¦
45 В 0В Y/GDP
Ye
2.1
At equilibrium national income in the
diagram, autonomous investment is
a) OA
b) AB
c) OB
d) OC
2.2.
The level of autonomous consumption at
income level Ye is
a) OA
b) AB
c) OB
d) OC
Topic 3 – Macroeconomic theory II    56 3BECO – Economic policies and management
В CONSUMPTION AND SAVING FUNCTIONS - THE TECHNICAL APPROACH
VOCAB: Propensity - tendency or inclination. The propensity to consume means
the tendency to spend while the propensity to save means the tendency to save
some income. These propensities are of two kinds - average and marginal.
What lies behind the consumption and saving functions?
APC and APS
In the spaces below define each:
APC - _____________________________________________________________ = C/Y
APS - _____________________________________________________________ = S/Y
(APS is also known as the household savings ratio = 3.9% of GDP for September
2009)
APC + APS = 1
MPC and MPS
In the spaces below define each
MPC - ___________________________________________________________ = О”C/О”Y
MPS - ___________________________________________________________ = О”S/О”Y
MPC + MPS = 1
STUDENT ACTIVITY 2.7
1. If Y = 200, C = 170 , the APC = ____ , and the APS = _____
2. If О”Y = $20 and $16 of that extra income is spent then the MPC = _____ and MPS
= _____
Graphically:
В В S
CВ В В CВ S
В В В О”CВ О”SВ Y2В Y1
В В О”YВ В О”YВ В В YВ Y1В Y2В Slope of C = MPC = О”C/О”Y
Topic 3 – Macroeconomic theory II   Slope of S = MPS = ΔS/ΔY
 57 3BECO – Economic policies and management
В Straight line = constant slope which means the MPC and MPS are constant.
A straight AD function reflects constant MPC – in the real world the MPC falls as
Y rises. Think about this. The proportion of each dollar saved increases as Y
rises. So the AD function would be curved as shown in the diagram on the right.
In this course we assume a constant MPC.
Expenditure Expenditure Equilibrium Equilibrium AE MPC increases as Y↑     AE MPC constant Y/GDP Y/GDP Think about the implications for AD of tax cuts and government expenditure and who
gets the tax cuts and receives the expenditure.
Algebraic Representation of C and S
Consumption function:
where
C
=
a
=
b
=
Y
=
C = a + bY
consumption
autonomous consumption when Y = 0.
MPC
income
Saving function:
S
-a
s
Y
S = -a + sY
saving
dissaving or survival consumption when Y = 0
MPS
income
=
=
=
=
If you know the level of autonomous consumption, and either the MPC or MPS, you can
arrive at an equation for both C and S.
STUDENT ACTIVITY 2.8
1. Given autonomous consumption = $100 and MPS = 0.4 what is the
a)
consumption function _________________________
b)
saving function
Topic 3 – Macroeconomic theory II   ______________________________
 58 3BECO – Economic policies and management
В 2. Given autonomous consumption = $250 and MPC = 0.75 what is the
a)
consumption function _________________________
b)
saving function ______________________________
3. If the consumption function is C = 180 + 0.85Y, what is the
a)
MPS _________________________
b)
level of autonomous consumption __________________________
4. If the saving function is S = -140 + 0.3Y, what is the
a)
MPC _________________________
b)
level of survival spending ______________________________
Worked Example
Calculate mathematically the equilibrium value of income if a = $100 and the MPS = 0.4.
It is possible to do this using the following process:
Since at equilibrium, Y = C then: Y = a + bY
subtract bY from both sides:
(because C = a + bY)
Y - bY = a
simplify:
Y(1 - b) = a
divide both sides by (1 - b):
Y = a
(1 - b)
note that (1 - b) = s, therefore:
Y = a
s
ie.
Y = 100 = 250
0.4
so the equilibrium level of national income in the example above is Y = 250.
5. a) From the schedule below calculate the C and S functions.
Y
C
S
0
100
-100
600
550
50
1200
1000
200
1800
1450
350
2400
1900
500
i) C = ______________________
Topic 3 – Macroeconomic theory II   ii) S = ______________________
 59 3BECO – Economic policies and management
В Check your answers by selecting any income level and substituting it into your C
function equation. If the answer you get conforms to the consumption at that level of
income in the table, your equation is correct. Do the same with the saving function.
b) Using the process explained on the previous page and above, calculate
mathematically the value of the equilibrium level of national income
__________________________________________________________________________
__________________________________________________________________________
__________________________________________________________________________
__________________________________________________________________________
__________________________________________________________________________
__________________________________________________________________________
THE MULTIPLIER
By now you have well and truly got the idea of how the equilibrium level of GDP
fluctuates in response to changes in total spending (AE) and that this only ever hits a
full employment level by chance. The interesting thing is that a change in AE caused
by a change in investment (I), exports (X) or government spending (G) produces a
proportionally larger change in output, employment and income. Look at the
diagram below:
AD = C + I + G + (X - M) = (a + bY) + G + I + (X-M)
ExpenditureВ ThisВ isВ aВ powerfulВ phenomenonВ whichВ explainsВ whyВ economicВ activityВ canВ fluctuateВ soВ much.В AE2В О”IВ =В $100В millionВ AE1В В В В 200В 100В О”YВ =В $200В million
Y/GDPВ 400В 600В An increase in investment of $100 billion results in an increase in Y of $200 billion, a
multiple of two. Similarly a decrease in investment causes a proportionally larger fall
in income. The Keynesian concept behind this phenomenon is called the
MULTIPLIER. It helps explain why the economy fluctuates so strongly and also why
its management is difficult.
Topic 3 – Macroeconomic theory II    60 3BECO – Economic policies and management
В VOCAB: The Multiplier (k) - is a mechanism by which a change in an injection causes a
proportionally greater change in national income. The multiplier in the above example is
2 (k = 2).
So О”I x k = О”Y
ie, $100 bill x 2 = $200 bill.
What determines the size of k?
The value of k is derived from the MPC. (Note the complex multiplier is determined
by the size of all leakages, ie. S, T & M)
TheВ multiplierВ effectВ isВ determinedВ byВ twoВ factors:В i)В theВ sizeВ ofВ aВ changeВ toВ anyВ injectionВ intoВ theВ economy,В ie.В I,В GВ &В X,В andВ ii)В theВ sizeВ ofВ leakages,В S,В TВ &В MВ (onlyВ SВ inВ theВ caseВ ofВ theВ simpleВ k)В ThisВ isВ aВ powerfulВ phenomenonВ whichВ explainsВ whyВ economicВ activityВ canВ fluctuateВ soВ much.В The Process of the Investment Multiplier
An injection triggers a succession of rounds of earning and spending which results
in a new level of Y which is proportionally greater than the initial injection.
Assume MPC = 0.6 and I increases by $100.
a) О”I = $100 so Y rises by $100 to households (for the purchase of factors of
production).
b) With an MPC of 0.6, households spend 0.6 x $100 = $60, so C rises by $60 and
S by $40. This new spending stimulates the production of more goods and
services across the economy.
c) Extra output required to satisfy increased consumption of $60 means $60 more
income will be paid to the owners of factors used in that production. So the
initial injection of $100 в†’ $100 more income в†’ $60 more spending в†’ another
rise in income of $60.
d) The recipients of the second round of extra income of $60 will spend 0.6 x $60 =
$36 so Y has risen by $100 + $60 + $36 ... and will go on rising but by
decreasing amounts due to the leakage of saving until the process exhausts
itself, ie. when О”Y = 0.
e) Therefore О”Y = О”I + О”I (MPC) + О”I (MPC)2 + О”I (MPC)3 + . . . О”I (MPC)n
or О”Y = 100 + 100 (0.6) + 100 (0.6)2 + 100 (0.6)3 + . . . 100 (0.6)n
How much will Y change by?
This can be calculated quickly using the investment multiplier. The formula is:
or
1
k=
1
1-MPC
MPS
Therefore in the above example:
k =
therefore
О”Y
Topic 3 – Macroeconomic theory II   Δ I = $100
=
1
MPS
1
0.4
MPC = 0.6
= 2.5
= О”Ixk
= $100 x 2.5
= 250
 61 3BECO – Economic policies and management
В Also the level of savings has increased too. If О” Y = 250, the level of savings will be О”
Y x 0.4 = 100, therefore C = 150.
STUDENT ACTIVITY 2.9
a) Calculate k if MPC = 0.9 and О”Y if О” I = $100 million.
__________________________________________________________________________
__________________________________________________________________________
b) Calculate k if MPC = 0.7 and О”Y if О” I = $150 million.
__________________________________________________________________________
__________________________________________________________________________
c) Notice the effect on k and О”Y the larger the MPC is! Explain this effect in your
own words.
__________________________________________________________________________
__________________________________________________________________________
__________________________________________________________________________
3.8
Note the k works in reverse. The effect of the multiplier on economic activity and
the business cycle is very significant. Keynes saw investment as the most
important aggregate in income and expenditure analysis partly due to the effect of
the multiplier.
d) Complete the following table showing the MPC, MPS and k.
MPC
MPS
k
0.1
_______
_______
0.3
_______
_______
0.75
_______
_______
5/8
_______
_______
_______
7/10
_______
_______
0.2
_______
0.85
_______
_______
_______
_______
10
19/20
_______
_______
_______
_______
5
Topic 3 – Macroeconomic theory II    62 3BECO – Economic policies and management
В e) Read the article and answer the questions below it. (from The West Australian,
19/2/00)
USВ gasВ plantВ dealВ toВ boostВ Pilbara
by Shaun Anthony & Julie Butler A cutting edge gas processing plant in the Pilbara is expected to create more than 1000 construction jobs and boost interest from overseas investors. American firm Syntroleum announced yesterday that it had chosen the Burrup Peninsula as the site for Project Sweetwater, a $600 million plant to turn natural gas into high‐value paraffin, synthetic lubricants and drilling fluids. 1. Aggregate expenditure will receive an injection of ____________ from this project.
2. How will this increase in investment affect total national income (GDP):
i) if there is a multiplier of 4? ___________________________
ii) if there is a MPC of 0.6? ___________________________
3. If there was substantial unemployment which economists calculated would need
$2.6 billion of additional total spending to reduce to an acceptable level, would this
injection be enough given a MPC of 0.75? Explain.
__________________________________________________________________________
__________________________________________________________________________
__________________________________________________________________________
__________________________________________________________________________
f) You have a consumption function of C = 100 + 0.8Y. If Yfe = $600 billion but Ye =
$550 billion, what fiscal action should government take?
__________________________________________________________________________
__________________________________________________________________________
__________________________________________________________________________
__________________________________________________________________________
Topic 3 – Macroeconomic theory II    63 3BECO – Economic policies and management
В The Value of the MPC and the Level of National Income (Y):
Note the different slopes of the three AD functions due to the different MPC for
each.
ExpenditureВ AE1 (gradientВ =В MPC1)В MPC1В В В В >В В MPC2В В В >В В MPC3
AE2 (gradientВ =В MPC2)В AE3 (gradientВ =В MPC3)В В В AВ Y/GDPВ В В Y3В В Y2В В В Y1В The different MPC of each function results in a different equilibrium point on the
45o line and a different level of national income (Y). The implication of this is that if
households decide to increase autonomous saving, ie. aggregate savings rise at
any level of income (the MPS rises), aggregate income output and employment will
fall. In other words the economy will contract. This is the Paradox of Thrift in
action. This means that while it may be virtuous for an individual to save more (be
thrifty), if all consumers increase their savings the result is a fall in consumption
which, unless off-set by a rise in investment, will result in economic contraction.
Economic Fluctuations
The study of macroeconomics is all about the study of economic fluctuations, ie.
departures from economic stability at full employment and price stability. An
economy moves through successions of upswing and downswing with the respective
rises and falls in employment, investment, output and income (the business cycle).
The magnitude of these swings derives from the combined effects of the multiplier
and the volatility of investment spending. This volatility is a consequence of both
the timing of investment and the amount of investment, which takes place at a
given time. A change in investment due to a change in aggregate spending brought
on by a change in aggregate income is called induced investment.
a) when the rate of income growth is increasing, induced investment will rise.
b) when the rate of income growth slows, induced investment will fall.
When income rises and consumption increases, more output has to be produced to
meet this growth in AD. If productive capacity is at or near maximum usage, then firms
will have to create more capacity, ie. purchase more capital goods (I). The rise in
investment spending will vary according to the nature of the industry. A firm in a capital
intensive industry such as mining will spend more on investment than a firm in a
labour intensive industry such as hospitality. In other words there will be a different
ratio of investment expenditure (capital) to the value of the output produced in each
Topic 3 – Macroeconomic theory II    64 3BECO – Economic policies and management
В industry.
This relationship is expressed as the capital-output ratio or accelerator. For example a
capital-output ratio of 4 means that for every $1 of product, $4 of capital equipment is
needed to produce it. At maximum capacity utilisation, if demand increased by $1 then
an extra $4 of capital equipment is required (induced investment). This injection leads
to increased employment and income which further stimulates demand and induces
further investment. If consumer spending increased by $20 million then investment
would rise by 4 x 20 = $80 million. Note this accelerator affect is likely to be more
significant in the latter stages of a recovery when capacity utilisation is high.
Interaction Between the Investment Multiplier and Accelerator and The
Business Cycle
The interaction of the accelerator (a) and the multiplier (k) explains the volatility of
the business cycle (see section on business cycle).
1. When autonomous I rises в†’ Y rises via k.
2. When Y rises в†’ C rises в†’ induced I rises via a.
3. When induced I rises в†’ Y rises again via k, C will again rise causing further
induced I and so on as the economy moves into a boom.
As income and demand continue to rise and capacity utilisation rises (excess capacity
falls), investment will accelerate at a faster rate. As the economy gathers pace and
experiences a boom, inflation will set in. A peak in the business cycle will be reached.
At this point consumer and business confidence will decline and will be followed by a
fall in both consumption and investment. This will cause national income to fall via
the multiplier and the accelerator working together and the economy will move into
recession, and possibly depression (ie without effective countercyclical government
policies). As income and consumption go on falling, a point is reached where
disinvestment occurs (worn out equipment is not replaced). Falling consumption
eventually reaches a survival or non-discretionary level of consumption, let’s say for
example $100 million. As disinvestment continues there will come a time when capital
stock falls below that required to meet the survival level of demand of $100 million. If
we use the same capital-output ratio of 4 then $400 million of capital will be needed
for this survival level of demand. When capital stock is less than $400 million,
replacement investment will have to take place to build it up to that level. Income will
rise via the multiplier so will consumption which will induce further investment, and
so with the multiplier and the accelerator working together, the economy comes out of
recession into an upswing once more. These ongoing fluctuations or swings between
expansion and recession constitute the business cycle.
вњЋ
Topic 3 – Macroeconomic theory II    65 3BECO – Economic policies and management
В STUDENT ACTIVITY 3.9
В В STUDENT ACTIVITY 2.10
a) Which two sectors do you think would have the greatest capital/output ratios
(accelerator effect)?
i) ________________________
ii) ________________________
b) Explain your answer to a)
_______________________________________________________________________________
_______________________________________________________________________________
_______________________________________________________________________________
_______________________________________________________________________________
c) Using your understanding of the multiplier effect, explain the link between the
resources boom and the housing boom in WA.
_______________________________________________________________________________
_______________________________________________________________________________
_______________________________________________________________________________
_______________________________________________________________________________
Topic 3 – Macroeconomic theory II    66 3BECO – Economic policies and management
В d) Complete the following multiple choice questions.
1. Assuming no leakages other than saving and households spend four fifths of
their income, if investment rises by $30 million, national income will rise by:
a) $30 million.
b) $150 million.
c) $120 million.
d) $6 million.
2. If an autonomous fall in AD of $40 million leads to further falls in spending of
$36 million in the following period, $32.4 million in the one after that and so on,
the value of the multiplier must be:
a) 0.9
b) 5
c) 10
d) 1.11
3. If the MPC = 0.75, the level of national income is $6000 million and the full
employment level of national income is $7000 million. By how much should the
government increase its spending to raise economic activity to full employment?
a) $1000 million.
b) $750 million.
c) $250 million.
d) None of the above.
4. If the marginal propensity to consume is 0.95, the multiplier will be:
a) 0.05
b) 95/100
c) 1/0.95
d) 20
5. The multiplier refers to the effect of a change in aggregate expenditure on the:
a) equilibrium level of national output or income.
b) the volume of money in the economy.
c) MPS.
d) level of full employment.
6. The concept governing the relationship between a rise in household spending and
a rise in investment induced by that increase in spending, is called the:
a) multiplier.
b) MPC.
c) accelerator.
d) derived demand.
7. If the consumption function is C = 1200 + 0.9Y, then the MPS and the multiplier
are
a) 0.1 and 0.10.
b) 0.9 and 10.
c) 0.1 and 10.
d) 0.9 and 1/10.
Topic 3 – Macroeconomic theory II    67 3BECO – Economic policies and management
В 8. The reason that an increase in government spending or private fixed capital
expenditure has a multiplied effect on income is best summed up as:
a) both types of spending raise the capacity of the economy to produce.
b) when one firm invests other firms feel compelled to invest too which
enlarges total investment spending.
c) investment and government spending create confidence causing people
to spend more.
d) such spending results in income rising which pushes up consumption
which in turn stimulates further rounds of rising income and spending.
9. The multiplier-accelerator model suggests that the business cycle is;
a) both self-starting and self-terminating.
b) due to a range of natural uncontrollable forces.
c) due to poorly timed government policies.
d) easily managed with sound macroeconomic policies.
10. The consumption function is C = a + bY. If C = $3000, a = $1500 and the MPC
is 0.75, what is Y?
a) $1500.
b) $2000.
c) $2500.
d) $3000.
11. In an economy with no taxes and no imports, consumers spend 60 cents in
each additional dollar earned. If investment increases by $20 million, the
equilibrium level of national income will rise by:
a) $60 million.
b) $50 million.
c) $33.33 million.
d) $100 million.
e) Fill in the explosion chart on the model provided as a note-making strategy which
would equip you to adequately answer the following question:
Explain with the aid of an example, what is meant by the multiplier process.
Such a question would require about 2 pages (A4) of writing, depending on the size
of your writing. This type of diagram is a useful tool to use after extracting essential
knowledge from a text. It assists in sifting through your rough notes, editing and
organising them into a learnable form. By working through this process you learn
the content and you end up with a visual map or plan of the essential knowledge.
Visual cues are very important in learning and stimulating the memory.
Multiplier
f) Speed Writing Activity
Do this activity as a follow up to question 3. Study your explosion diagram on the
multiplier process for 10 minutes. Explain with the aid of an example, what is meant
by the multiplier process.
Read the following instructions carefully.
Write for 8-10 minutes and stop. Time yourself or get someone else to time you. When
you have stopped writing read your answer. Think about how far you got through your
Topic 3 – Macroeconomic theory II    68 3BECO – Economic policies and management
В answer? What is the quality of your writing like? Did you use correct economic
terminology and did you include a diagram? Speed and fluency are very important. Be
concise and to the point, don’t waffle. Get someone else to read your answer. Ask
him/her what he/she thinks of it. Get them to mark it out of 10.
  Topic 3 – Macroeconomic theory II    69 3BECO – Economic policies and management
3.
Macroeconomic theory III
Objectives:
• explain the aggregate demand curve (AD) and its determinants
• explain the aggregate supply curve (AS) and its determinants
• use the AD/AS model to illustrate macroeconomic equilibrium
• demonstrate and explain the impact of changes in aggregate demand and
aggregate supply on the equilibrium level of income/output
• use the AD/AS model to help explain the business cycle
• discuss the causes and effects of inflation and unemployment and their
relationship to the business cycle
Inflation – Causes and Effects
Peak
Upswing concludes with a peak where the negative
distributional and allocative effects of inflation
reduce consumer and business confidence. Rising
uncertainty damages decisions to spend, invest,
produce, save, employ, work, etc. A downturn
commences.
Upswing
Inflation rises as scarcity increases in
factor and product markets. Rising AD and
capacity utilisation takes the economy
closer to full employment and maximum
potential output
trough
Definition: inflation is the sustained rise in the general level of prices.
There are two basic types of inflation:
i) Demand pull or simply demand inflation: this occurs where AD increases at a
rate faster than the capacity of the economy to produce goods and services (ie. AD
> AS). This increased competition for goods and services drives up their prices
(demand side causes).
ii) Cost push or simply cost inflation: prices are pushed up by rising costs to
producers who compete with each other for increasingly scarce resources - they
pass on cost increases to consumers (supply side causes).
Types of Inflation
i) Demand inflation
•
•
•
•
•
•
•
any increase in C, I, G or X-M as the economy approaches full employment.
full employment causes labour shortages в†’ employers bid up wages to attract
labour → Y ↑ → AD rises.
high levels of foreign investment в†’ AD rises.
high export earnings в†’ incomes rise в†’ AD rises.
inflationary expectations - if expectation is that prices ↑ → Δs economic
behaviour → prices in product & factor markets ↑.
increasing consumption due to changes in consumption patterns (less saving
at any level of Y). This may happen if household wealth ↑ as in a stockmarket
or housing boom. Saving ↓ as C ↑ → asset price inflation is transmitted to the
rest of the economy.
monetary problems - too much money/credit in economy → r↓ → AD↑ →
prices ↑.
70
Macroeconomic Theory III
3BECO – Economic policies and management
ii) Cost inflation
•
•
•
any input may become a major cost to business - eg. wage increases в†’ higher
production costs. Labour shortages in some sectors в†’ wages rise in those
sectors в†’ may spread to other sectors. This assumes W rise > productivity of
labour and producers pass on cost increase per unit of output to consumers.
This depends on the level of competition in the industry or sector. The more
competition there is, the more producers have to absorb cost increases
themselves rather than pass them on to consumers. (Labour market reforms
have contributed to reducing flow-on effects of W increases в†’ lower aggregate
W growth and less inflationary pressure).
inflation imported from abroad, eg. the rise in the cost of intermediate goods
and resources imported from other countries flows through in the form of
higher prices domestically, eg. rising oil prices.
falling $A pushes up the cost of imports - price of imported investment goods
↑→ production costs ↑, also prices of imported consumer goods ↑→ inflation.
This effect can be reduced by making the economy more competitive в†’ forces
firms to absorb costs and become more efficient.
STUDENT ACTIVITY 3.1
Read the extract from the following article in The Australian Financial Review,
15/3/00 and complete the questions.
Macfarlane spurred by inflation concern
Why does the Governor of the Reserve Bank care about the financial markets getting carried away by a few weak
economic statistics?
A big part of the answer is the $A. At its recent lows, it has the potential to become a significant inflationary
problem later in the year.
Moreover, if the markets keep talking themselves into a hate-Australia mood (we have already been downgraded
from economic miracle to a country living beyond our means, in the eyes of some commentators), the problem of the
soft $A might not immediately evaporate with the return of strong economic statistics.
The thought of any inflationary problem later in the year, when the Government is in the process of introducing
the GST, is enough to give a central banker nightmares for a month. The price effect of the GST will be big enough to
make some people think the days of low inflation are over. Containing inflationary expectations will be even more
difficult if the $A and oil prices are adding to the CPI.
a) How could the $A become a “significant inflationary problem”?
__________________________________________________________________________
__________________________________________________________________________
__________________________________________________________________________
__________________________________________________________________________
__________________________________________________________________________
__________________________________________________________________________
__________________________________________________________________________
71
Macroeconomic Theory III
3BECO – Economic policies and management
b) In what sense could the GST and the price of oil be a problem?
__________________________________________________________________________
__________________________________________________________________________
__________________________________________________________________________
__________________________________________________________________________
__________________________________________________________________________
__________________________________________________________________________
__________________________________________________________________________
__________________________________________________________________________
c)
“...people might think the days of low inflation are over. Containing
inflationary expectations will be...difficult...”
What is meant by inflationary expectations and how can expectations be a
problem?
__________________________________________________________________________
__________________________________________________________________________
__________________________________________________________________________
__________________________________________________________________________
__________________________________________________________________________
__________________________________________________________________________
__________________________________________________________________________
Inflation hurts most
households
72
Macroeconomic Theory III
3BECO – Economic policies and management
Effects of Inflation
Impact on Output
In general inflation has major costs for the economy, the producer and the consumer.
a) Inflation в†’ productive investment falls because profitability falls в†’ speculative
investment rises which has a negative effect on employment, output and income. Inflation
causes resources to be misallocated away from productive, job creating uses to purely
speculative activities such as property, commodity and share market speculative trading.
b) Inflation → uncertainty increases → business and consumer confidence ↓→ investment
and consumption ↓→ negative effect on employment and production.
c) Inflation → interest rates ↑. Like other prices, the price of money rises to compensate
suppliers of money (lenders/savers) for the falling value of the dollars they are repaid в†’
reduces investment and consumption в†’ negative effect on employment and output.
d) If Australia’s inflation rate > overseas inflation rates → exports ↓ because exports become
relatively more expensive on world markets and imports ↑ because imports become cheaper
relative to domestically produced products → (X - M)↓. This reduces output and employment
→ Australia becomes less internationally competitive → CAD ↑. This was a problem
through the 1980s.
e) Governments may tighten fiscal and monetary policies to reduce inflation в†’
unemployment ↑ and production ↓, eg. 1990-91 recession was product of this action.
Inflation causes a redistribution and reallocation of resources away from the
following groups:
1. Fixed income earners: real incomes ↓ as changes to money incomes lag well behind
inflation, eg. the unemployed, public servants, etc. в†’ living standards fall.
2. Weak unions or non-unionised sections of workforce: money incomes fall behind inflation
because they lack industrial “muscle”.
3. Borrowers/lenders (depending on interest rates): borrowers lose if interest rates move
ahead of inflation when lenders anticipate inflation and raise rates to protect real returns.
4. Firms in highly competitive or depressed industries: rising costs reduce profits when
firms can’t easily raise prices.
5. Savers: savings in conventional low interest bank deposits lose real value.
Inflation causes a redistribution and reallocation of resources to the following
groups:
1. Speculators: buy and sell property, collectables (eg. art) precious metals (eg. gold), etc.
during inflationary periods because these items rise faster in price than the general price level
→ speculator’s real income ↑.
2. Borrowers/lenders (depending on interest rates): borrowers benefit if inflation > r. They pay
back dollars of less value and lenders lose.
3. Strong employee groups (unions eg CFMEU) in key industries: can use industrial “muscle”
to gain wage/fee increases greater than other groups of employees and greater than inflation
rate (distributive effect).
4. Monopolies/oligopolies in key industries: can raise their prices ahead of inflation and/or
pass on cost increases to consumers to maintain or raise profits (distributive effect).
5. Government: revenue rises from bracket creep, ie. inflation lifts people into higher income
and marginal tax brackets в†’ pay a higher proportion of income tax to government (inflation
tax) (distributive effect).
Conclusion
Inflation transfers income between competing income groups. It causes a redistribution
of income away from weaker, low income earners to more protected high income earners in
both private and public sectors. This worsens income distribution inequality.
73
Macroeconomic Theory III
3BECO – Economic policies and management
Effects of Inflation in Simpler Form
High rates of inflation have important negative effects on income distribution,
saving, production and trade. It is very important for governments to keep inflation
low for the following reasons.
1. Inflation makes some people poorer and others richer. This makes the
distribution of income less fair. People who are well educated and highly
skilled suffer less than unskilled and poor people. People who are well off can
invest savings in assets which appreciate (rise in value) as inflation rises. They
can keep up with inflation and they tend to have more power when it comes to
wage and salary increases. If they are self employed eg doctors, dentists,
lawyers and some business people, they can put their fees and prices up quite
easily.
Some workers eg nurses, policemen, teachers, public servants, truck drivers,
shop assistants, waiters, etc. have less market power (ie less influence when it
comes to negotiating wage and salary increases) and find their income growth
falls behind inflation. Their purchasing power (real income) declines.
2. Savings lose value as inflation rises. A dollar saved today is worth less in the
future so saving is discouraged as people expect prices to rise rapidly so spend
now rather than save and spend later. Since investment is funded out of
national savings, less saving means less money available to finance investment.
Businesses needing to borrow have to borrow from overseas which increases the
country’s foreign debt.
3. Inflation creates uncertainty and makes business planning difficult. They
may worry about future capital costs and postpone investment plans. This leads
to less output and less productive capacity being created. It also means fewer
future jobs being created. Money which could be used for investing in more
productive capacity, may go into unproductive, speculative assets eg property.
4. Exports increase in price due to inflation. If overseas inflation rates are lower
than Australia’s, exports will be less competitive in world markets and imports
will become cheaper. This will cause trade balance problems. Export and import
competing industries will become less competitive and jobs will be lost in those
industries.
STUDENT ACTIVITY 3.2
1. Paragraph writing activity
Topic: What are the effects of inflation? Discuss with a partner first and then
write your paragraph (about ВЅ page).
2. Group Activity: Discuss with one or two other students the following question.
Write your ideas in note form in your files.
Inflation averaged around 8% during the 1980s and around 2.5%
in the 1990s! If high inflation has negative effects, what benefits
has low inflation produced for Australia since the 1990s?
74
Macroeconomic Theory III
3BECO – Economic policies and management
The AD/AS Model
This model has a shiftable, upward sloping AS function and a shiftable, downward
sloping AD function. The Keynesian 45Вє angle cross model you have learnt about
shows the relationship between total spending, total income and total output. The
AD/AS model shows the relationship between the general or aggregate price level in
the economy and total income and output.
Look at the AD diagram below. On the y-axis aggregate price changes are
measured. Total purchasing power changes when the price level changes. At a
lower price level (P2) real purchasing power increases → AD↑.
If prices rise, aggregate spending power declines (other things remaining equal), ie.
aggregate demand contracts along the AD function. The AD function shows how the
level of demand changes when prices change and money income is constant.
Price Level
P
P
AD curve shows different levels of
aggregate expenditure and GDP at
different price levels. AD and P are
inversely related.
1
2
AD
Y/GDP
1
Y
Y
2
Contraction or expansion of demand (shifts along AD) are due to price changes. If
changes occur to any of the components of AD (C, I, G, net X), the AD curve will
shift its position to the left or right as shown in the diagram below.
Price Level
When any component of AD rises
the AD function shifts to the right.
This corresponds to the AD
function moving upward in the
45Вє angle model.
P
AD2
AD1
Y/GDP
Y1
Y2
STUDENT ACTIVITY 3.3
Write a sentence explaining why the AD curve slopes down.
__________________________________________________________________________
__________________________________________________________________________
75
Macroeconomic Theory III
3BECO – Economic policies and management
When AS is added to the model it is complete. This model provides a more realistic
explanation of what actually goes on in the macroeconomy than the Keynesian
model of income analysis (45В° angle model). The model demonstrates the effect on
aggregate prices and aggregate production and income when either AD or AS. If
demand rises due to a change in any of the components of AD, prices will rise due
to increased scarcity in product and factor markets and firms will respond by
expanding production. The AS function can shift position in response to changing
circumstances in factor markets which will in turn impact on output and prices.
Price Level
AS
AS is upward sloping because firms
increase output in response to rising
AD as prices rise due to growing
factor scarcity. Note the slope of AS
reflects the availability of resources,
technology and/or the efficiency of
firms.
P2
P1
AD2
AD1
Y/GDP
Y1
Price Level
Y2
Price Level
DIAGRAM 1
AS with lower gradient – output growth
> price growth (early recovery)
DIAGRAM 2
AS with higher gradient – output growth
< price growth (late recovery)
AS
P2
AS
2
P
P1
AD1
P1
AD2
AD1
Y/GDP
Y1
Y2
AD2
Y/GDP
Y1
Y2
What happens to inflation when AD rises? The slope of AS curve has implications for
government policy. In a trough or recession the slope of the short run AS function is
close to flat (diagram 1). Surplus capacity and unemployment means government
policy can be expansionary. Increased government spending and lower interest rates
can stimulate AD prompting firms to increase production without causing price
pressures to build in factor and product markets. As economic recovery progresses
and gets faster, surplus capacity and unemployment fall and price pressures
increase causing inflation to rise. This is reflected in the steeper AS function
(diagram 2).
76
Macroeconomic Theory III
3BECO – Economic policies and management
Diagram A
P
Diagram B
P
Trough – no inflation
and rising output
Diagram C
Recovery – rising
inflation and output
P
P1
AD2
AS
Y2
AD2
P1
AD1
Y1
Peak – high
inflation and no
increase in output
P2
P2
AD1
AS
AS
AD2
Y
AD1
Y
Y1
Y
Y2
Yfe
Diagram A: Trough (horizontal or Keynesian AS function) - at low levels of economic
activity well below full employment of resources (Yfe), supply exceeds demand in
factor markets. Firms have excess capacity and UE (unemployment) in labour
markets is relatively high. Therefore firms can increase production without bidding
up factor prices which means no price pressures being passed on to consumers.
Hence no price changes as the economy expands from Y1 to Y2.
Diagram B: Recovery (sloping or intermediate range) - as unemployed resources are
used up, factor markets tighten as competition between firms for factors of
production begins to have an effect on factor prices. Production costs begin to rise,
income rises, spending rises and therefore consumer prices begin to rise along with
output (P1Y2 and to P2 Y2).
Diagram C: Peak (vertical or classical range (vertical) – at Yfe in theory all resources
are fully employed (economy is on its PPF) so no further output growth is possible in
the short run. Further rises in AD will pull up prices but not raise output.
The diagram below shows the full employment limit to economic growth in the form
of a vertical long run AS line. This line simply marks the maximum output possible
given available resources in the economy. Ideally an economy should try to maximise
production from its limited resources to satisfy as many of society’s unlimited needs
and wants as possible. The LAS function marks that limit. Production below that
level of output means the economy is under performing (operating inside its PPF). AD
can increase as far as Yfe (the LAS) after which inflation accelerates.
Price level as
measured by price
index (CPI)
LAS
Long run AS (LAS) represents maximum
potential output due to limited resources. AD
can grow up to this point with output and
employment growing along with inflation.
SAS (short run AS)
P2
Inflation potential as output gap closes
P1
AD
Output gap
GDP/Y
Y1
Yfe
77
Macroeconomic Theory III
3BECO – Economic policies and management
Demand pull inflation results from increases in AD. This is particularly the case in
the later stages of an upswing as the economy approaches Yfe.
Price level as
measured by price
index (CPI)
LAS
Pure inflation will result from
AD pushing growth beyond the
economy’s potential
P3
SAS
P2
When short run AS (SAS) grows
beyond long run AS, output will
briefly exceed Yfe but price rises
will accelerate causing production
costs to blow out and real
purchasing power to decline. As
real income falls, output falls back
to Yfe or potential real GDP but at
a higher inflation level.
Inflation potential as output gap closes
P1
AD3
AD2
AD1
Output gap
GDP/Y
Ye
Yfe
Also known as a
deflationary gap
Yinf
Inflationary gap
Cost push inflation focuses on supply side sources or cost increases which shift the
AS curve to the left.
Price level as
measured by price
index (CPI)
Inflation potential as output gap closes
LAS
SAS2
SAS1
P2
Short run AS shifts to the left
representing a decrease in AS
due to some supply side shock
which increases production costs
eg a rise in the price of oil.
rise in inflation
P1
Output gap
AD
fall in output &
employment
Y2
GDP/Y
Y1
Yfe
The position of AD is unchanged but purchasing power falls as prices rise so
output and employment fall. Both inflation and UE rise (stagflation) when the
source of inflation is supply side or cost driven. The solution to stagflation is to
address the sources of cost pressures where possible so that the AS function shifts
back to the right. Using expansionary policy to increase demand would temporarily
increase output and employment but make inflation worse and eventually result in
output and employment falling back to Y2.
VOCAB: Real income - the purchasing power of money.
Money income - the actual number of dollars received and available for
spending.
78
Macroeconomic Theory III
3BECO – Economic policies and management
Inflation rises as scarcity increases in factor and product markets.
Rising AD and capacity utilisation takes the economy closer to a peak
(full employment and maximum potential output) and beyond causing
inflation to accelerate.
P
P2
LAS
SAS
P1
AD2
Peak
AD1
Y
Y1 Yfe
Upswing
trough
P
LAS
SAS
P2
P1
In a trough weak demand in factor and product markets means
price pressures are low. Rising AD can occur without causing
inflation. As AD rises, output and employment increase but
inflation remains low due to surplus productive capacity and
abundant resources.
AD1 AD2
Y
Y1
Y2
Yfe
STUDENT ACTIVITY 3.4
1. Study the graphs and then complete the questions.
Price level
Graph 1
AS
Price level
Graph 2
AS
AD2
AD
1
AD
Output (Y)
Price level
Graph 3
AS
AD
Output (Y)
Price level
Graph 4
AS
AD
Output (Y)
Output (Y)
Graph 1: shows the effects of an increase in AD - price level rises (ie inflation ↑) and
output and employment increase.
79
Macroeconomic Theory III
3BECO – Economic policies and management
a) Show on Graph 2 an increase in AS and explain the consequences.
_________________________________________________________________________________________
_________________________________________________________________________________________
b) Show on Graph 3 a decrease in AD and explain its consequences.
_________________________________________________________________________________________
_________________________________________________________________________________________
c) Show on Graph 4 a decrease in AS and explain its consequences.
_________________________________________________________________________________________
_________________________________________________________________________________________
d) Which graph shows the most unfavourable change in the economy and explain
why.
_________________________________________________________________________________________
_________________________________________________________________________________________
_________________________________________________________________________________________
_________________________________________________________________________________________
2. Read the following extract from the Australian Financial Review (17/3/00) and
answer the questions.
National accounts data yesterday showed that gross domestic product rose by 1% in the December quarter, and 4.3% over
the year. Last year was the fourth consecutive year that GDP growth has exceeded 4% and the seventh year that growth
has bettered the long-term average of 3.5%.
However, many economists voiced concerns about the growth figures and the decline in productivity, which has slipped
from 3% in the June quarter to 1% in December. “The decline in productivity over the last two quarters is of most concern
for the Reserve Bank of Australia,” said Mr Matthew Drennan, chief economist at Deutsche Asset Management
Australia.
“Lower productivity in an environment of increased wage demands and low unemployment signals another risk to inflation.”
a) What is productivity? _____________________________________________________
b) Explain why the decline in productivity is a concern to the RBA.
__________________________________________________________________________________________
__________________________________________________________________________________________
__________________________________________________________________________________________
80
Macroeconomic Theory III
3BECO – Economic policies and management
c) What is the link between productivity and inflation?
__________________________________________________________________________________________
__________________________________________________________________________________________
__________________________________________________________________________________________
__________________________________________________________________________________________
d) If Diagram 1 shows the results of high productivity (a stable price level and rising
Y), show on diagram 2 the effects of lower productivity.
Price level
Diagram 1
Price level
AS
1
AS2
AS
P
AD2
AD
Y/GDP
Y1
AD
1
Y/GDP
Y2
3. Read the following article from the Australian Financial Review, 28th October,
1999 and write your answers in your own words in your file.
Inflation up and rates will follow by Stephen Koukoulas
A simple question: Why is the cash interest rate in Australia at a 30-year low? A simple answer: Because inflation is (or
until recently, was) also at a 30-year low. Yesterday’s 0.9 per cent increase in the September-quarter consumer price index
marks the early stages of an acceleration in inflation. ...
The simple conclusion from the acceleration in inflation is that interest rates must go up. On the inflation outlook, which
will be important in determining how much interest rates will need to rise, the two usual, if old-fashioned, drivers of inflation “cost push” and “demand pull” pressures - are now working in harmony to underpin as inflation acceleration. This is unlike in
previous years where lower material costs and subdued growth in real labour costs were biasing inflation lower.
The “cost push” component has at its source an upturn in commodity prices and a pick-up in labour costs as employment
growth eats into the pool of unemployed. Higher commodity prices add to price rises for goods, while increases in labour
costs add to prices of both goods and services.
The “demand pull” component comes from the economy maintaining an above-trend growth rate and through an
anticipation of the effects of large income tax cuts from next July that will allow firms to increase margins. Without strong
demand, it is difficult for inflation to pickup as corporations shy away from margin widening because of competitive pressures.
In other words, without strong demand, their ability to increase margins and hence push inflation higher is restricted. ...
a) “...the two usual, if old-fashioned drivers of inflation - �cost push’ and �demand
pull’ pressures - are now working in harmony to underpin an inflation
acceleration.” Define cost push and demand pull inflation.
__________________________________________________________________________________________
__________________________________________________________________________________________
81
Macroeconomic Theory III
3BECO – Economic policies and management
__________________________________________________________________________________________
__________________________________________________________________________________________
__________________________________________________________________________________________
b) Identify the cost push factors the author says were contributing to inflationary
pressures and explain how they were pushing prices up.
__________________________________________________________________________________________
__________________________________________________________________________________________
__________________________________________________________________________________________
__________________________________________________________________________________________
__________________________________________________________________________________________
__________________________________________________________________________________________
__________________________________________________________________________________________
__________________________________________________________________________________________
c) Explain where the demand pull component was coming from in the economy in
the latter part of 1999. Explain the connection between demand and company
decisions to raise prices.
__________________________________________________________________________________________
__________________________________________________________________________________________
__________________________________________________________________________________________
__________________________________________________________________________________________
__________________________________________________________________________________________
__________________________________________________________________________________________
d) Make a comparison between the circumstances described in the article and the
present state of the economy. Work with a partner on this and jot your ideas below.
__________________________________________________________________________________________
__________________________________________________________________________________________
__________________________________________________________________________________________
__________________________________________________________________________________________
__________________________________________________________________________________________
__________________________________________________________________________________________
82
Macroeconomic Theory III
3BECO – Economic policies and management
POLICY SOLUTIONS
The Keynesian view of the role of government concerns altering the level of AD in
order to achieve a full employment (FE) level of national income. This is done
primarily through fiscal policy, specifically via government spending. Changing
monetary policy (altering r) and taxation are also available to economic authorities
but are less direct or certain in their effects on AD.
a) Deflationary gap situation due to inadequate AD – solution is to raise AD by
increasing government spending (О”G).
LAS
Price Level
SAS
AD needs to be increased to the
level needed for full employment
(ADfe). Increasing government
spending is the most direct way
of achieving this.
P2
P1
G↑
ADfe
ADdef
deflationary gap
Ydef
Y/GDP
Yfe
ΔG↑→AD↑→O↑→Df↑→UE↓→Y and GDP↑. Output or GDP gap (Ydef→Yfe) begins to
close.
b) Inflationary gap situation due to excessive AD – solution is to reduce AD by
decreasing government spending.
LAS
Price Level
SAS
AD needs to be reduced to the
level needed for full employment
(ADfe). Cutting government
spending is the most direct way
of achieving this.
P3
Without contractionary
FP & MP, inflation will
rise to a higher level
(P3) as the economy self
adjusts back to Yfe
(LAS). With appropriate
policy ( G↓), inflation
will fall back from P2 to
P1.
P2
P1
G↓
ADinf
ADfe
Inflationary gap
Yfe
Yinf
Y/GDP
ΔG↓→AD↓→O↓→Df↓→UE↑→Y and GDP↓. Without countercyclical action, AD would
push the economy into an unsustainable overfull employment position (Yinf) forcing
the price level up to P3. The economy would eventually work its way back to Yfe but
at the higher price level which we could call the pure inflation zone (P2 – P3). This
begins to close as G is cut and AD decreases. Continued decrease in AD leads to
lower inflation (P2 в†’P1) and a lower but more sustainable level of output (Yfe). UE
may rise if the adjustment downward in AD below Yfe (where level of AD =
maximum output of economy) is too great.
83
Macroeconomic Theory III
3BECO – Economic policies and management
Note consumers and businesses may not respond in the expected way or may take
some time to respond to changes in r and taxes. Changing the level of G is a more
direct way of affecting the level of demand but there may be undesirable
consequences and political and social factors which limit the use of fiscal policy.
Deflationary Gap
Inflationary Gap
Expenditure
Expenditure
ADfe
ADinf
Deflationary gap
Inflationary gap
ADue
ADfe
Y needs to decrease
from Yinf to Yfe
Y needs to increase
from Yue to Yfe
Y/GDP
Yue
Y/GDP
Yfe
A deflationary gap = amount of
aggregate spending below what is
needed to achieve a full employment
level of output.
Policy Solution: increase total
spending through expansionary
fiscal and monetary policy.
Yfe
Yinf
An inflationary gap = amount of
aggregate spending above what is
needed to achieve full employment
level of output.
Policy Solution: decrease total
spending through contractionary
fiscal and monetary policy.
Examine the graph showing inflation since 1973. What do you notice about the
progress of inflation over the past three decades?
20.0
18.0
16.0
14.0
12.0
10.0
8.0
6.0
4.0
2.0
0.0
-2.0
Jun-73
Jun-74
Jun-75
Jun-76
Jun-77
Jun-78
Jun-79
Jun-80
Jun-81
Jun-82
Jun-83
Jun-84
Jun-85
Jun-86
Jun-87
Jun-88
Jun-89
Jun-90
Jun-91
Jun-92
Jun-93
Jun-94
Jun-95
Jun-96
Jun-97
Jun-98
Jun-99
Jun-00
Jun-01
Jun-02
Jun-03
Jun-04
Jun-05
Jun-06
Jun-07
Jun-08
Jun-09
Inflation - June 1973 - March 2009
84
Macroeconomic Theory III
3BECO – Economic policies and management
UNEMPLOYMENT
The UE rate
= number of UE (those over 15 seeking work)
number in labour force (those over 15)
TYPES OF UNEMPLOYMENT
Frictional - always some UE due to
workers voluntarily changing
employment as they seek higher
paid jobs – may reflect acquisition
of more skills & training. Duration
of UE depends on knowledge of
labour market & efficiency of
job searching.
Cyclical - falling AD during a
recession → UE ↑. ie C ↓ → O ↓→ D
for L ↓→ UE ↑. This is the main
cause of unemployment in a
contraction. Full employment is
when cyclical UE is zero.
Underemployment – people who
are in work but want more hours
of work, ie working part-time but
want full time work.
Hidden UE - people discouraged
due to lack of success in finding
work withdraw from job searching do not show up in official statistics
- the hidden UE could add several
more percentage points to the
official rate.
x
100
Structural - О”s in the structure of economy
over time due to technological О” + О”s in
pattern & nature of consumer spending some industries decline or shed labour as
they seek to become more competitive - may
be due to cuts in protection & other
microeconomic reforms. They may cease to be
competitive in a rapidly changing global
economy → workers’ skills no longer required
→ UE↑. It’s particularly difficult for older
workers to find employment in newer
industries. New technology eliminates many
menial jobs. Although tech. О” does do away
with certain kinds of jobs, it generates new
jobs in expanding and newer sectors of the
economy. In the long run technological &
structural О” create many more jobs than they
eliminate.
Long term - UE due to age, lack of skills
and inadequate education and training
eg. older workers who have lost their
jobs due to structural change and lack
the relevant skills needed to gain
employment in another industry. Also a
lack of education and experience
(necessary for skill acquisition is
particularly problematic for early school
leavers.
Seasonal - some industries are
seasonal eg. fishing, horticulture,
viticulture → in off-season UE ↑.
Underutilisation rate = the unemployed + the underemployed
number in the labour force
x
100
Participation rate % = number of people in work or looking for work (labour force)
number of people of working age (popn over 15 years old)
x 100
85
Macroeconomic Theory III
3BECO – Economic policies and management
STUDENT ACTIVITY 3.5
1. Can the rates of unemployment and employment both increase at the same
time? Explain.
_____________________________________________________________________________________
_____________________________________________________________________________________
_____________________________________________________________________________________
_____________________________________________________________________________________
2. Study the chart above and answer the question: Why should society seek to
reduce the rate of unemployment? Use the space below to plan your answer then
write your response fully in your file.
EFFECTS OF UNEMPLOYMENT
Economic
1. Loss of output - unemployed
resources - economy
underachieving inside PPF
в†’ loss of welfare and income
в†’ lower living standards
PPF
FE
• UE
2. Reduced govt revenue в†’ budget
deficit ↑ at a time when govt
spending needs to ↑.
3. Redistribution of income - UE ↑ →
income ↓ for low skilled and
workers in declining industries +
sectors. Those in secure
employment may also benefit from
deflation (or slower inflation) в†’ real
incomes ↑.
Social
1. Destruction of family life due to
declining self-esteem and financial
hardship.
2. Domestic violence - due to
frustration & loss of self worth.
3. Drug abuse and alcoholism.
4. Crime and delinquency.
5. Rising costs of law enforcement,
health and welfare services.
6. Long term urban decay in some
areas - become ghettos of chronic
long-term unemployment and
poverty.
7. Overall social costs accelerate as
unemployment increases.
4. Erosion of skills - UE workers
lose skills + are unable to gain new
ones in a changing economic
environment в†’ less employable в†’
in danger of becoming long term UE
в†’ quality of workforce declines.
_____________________________________________________________________________________
86
Macroeconomic Theory III
3BECO – Economic policies and management
_____________________________________________________________________________________
_____________________________________________________________________________________
_____________________________________________________________________________________
_____________________________________________________________________________________
_____________________________________________________________________________________
_____________________________________________________________________________________
_____________________________________________________________________________________
_____________________________________________________________________________________
_____________________________________________________________________________________
Causes of Unemployment
• Lack of Demand - a fall in C, I, G or net X will reduce total expenditure →
production ↓ → UE ↑ (cyclical). This is the type of unemployment which occurs in
recessions.
• Technological and structural Δ - workers replaced by machines - in short run UE
may rise as a result of new technology. In the long run new industries + new job
opportunities are created by technological О”. Tech О” increases productivity - more
output from inputs в†’ releases factors of production for other areas of the economy
в†’ growth in other industries.
• Rising labour costs – rate of wages growth > productivity growth → labour
substituted with more capital в†’ reduction in employment (structural)
• Government policies - tightening FP and MP → UE ↑ (cyclical) - reducing tariffs
and other forms of protection в†’ UE rises in the short run (structural).
• Level of world economic activity - if world growth slows → demand for Australian
exports ↓→ less output from export industries → demand for labour (DL)↓. Also
export income ↓→ national Y → AD↓→ UE ↑ (cyclical).
Policies to deal with Unemployment
Demand side Policies: simply raising AD will increase the DL and other resources в†’
UE ↓. This can be achieved with expansionary fiscal + monetary policies → C + I ↑→
DL ↑→ UE ↓ - in other words stimulating economic growth. This is appropriate in
dealing with cyclical UE.
Supply side Policies:
• Microeconomic reforms → long run structural changes in the economy which
make the economy more efficient and increase productivity в†’ new + expanded
industries → UE↓ - deregulation, tax reform, tariff reduction, labour market reform
в†’ improved competitiveness, efficiency + responsiveness to changing economic
circumstances в†’ sustainable employment growth in the long run.
• Encourage entrepreneurialism and investment → employment ↑.
• Training and education programs aim to improve employability of the unemployed.
Federal governments must allocate funds to vocational training and support the
87
Macroeconomic Theory III
3BECO – Economic policies and management
apprenticeship system в†’ better match between the skills of those looking for work
and job vacancies. Improving training and flexibility of the workforce в†’ unemployed
should spend less time out of the workforce and become more productive. This will
reduce inflationary pressures by removing skill blockages and labour shortages
which usually occur as economic growth accelerates. Government policies can be
used to encourage X and M-replacement industries.
STUDENT ACTIVITY 3.6
1. Read the following extract from the Australian Financial Review, 16-2-06
STUDENT ACTIVITY 4.6
Asleep on the jobs growth by John Quiggin
Unemployment hasn’t been front page news for some years. The main labour market story in the
past couple of years has been the emergence, for the first time since the 1980s, of significant
labour shortages for some classes of skilled worker.
Despite these shortages, the number of people who are unemployed or underemployed remains
high. The official rate is above 5 per cent, [at time of writing 4.9%] but when various forms of
hidden unemployment are taken into account, the true rate exceeds 10 per cent. It seems to have
been accepted that a headline rate of unemployment of 5 per cent is the best we can possibly do,
though such a rate would have been considered disastrous in the 1950s and 1960s. ... If we do
experience a recession, and a resurgence of unemployment, the long expansion of the past 15
years will look, in retrospect, like a wasted opportunity to achieve permanent reductions in
unemployment.
What can governments do “...to achieve permanent reductions in unemployment”?
_____________________________________________________________________________________
_____________________________________________________________________________________
_____________________________________________________________________________________
_____________________________________________________________________________________
_____________________________________________________________________________________
2. Study the following table showing labour market data.
Period
1996-97
1997-98
1998-99
1999-00
2000-01
2001-02
2002-03
2003-04
2004-05
2005-06
2006-07
2007-08
2008-09
Labour Force
(000s)
9,168.9
9,256.4
9,378.5
9,495.0
9,674.3
9,818.9
10,003.8
10,129.0
10,366.8
10,591.5
10,823.5
11,252.6
11,418.8
Total Employed
(000s)
8,404.0
8,518.6
8,688.9
8,868.7
9,056.2
9,161.5
9,389.4
9,556.3
9,826.4
10,064.3
10,334.6
10,772.1
10,759.0
Unemployed
000s
764.9
737.8
689.6
626.3
618.1
657.4
614.4
572.7
540.5
527.1
489.0
480.5
659.8
Unemployment
rate %
8.3
8.0
7.4
6.6
6.4
6.7
6.1
5.7
5.2
5.0
4.5
4.3
5.8
Participation
rate %
63.4
63.1
63.1
63.1
63.4
63.3
63.6
63.4
63.9
64.4
64.8
65.4
65.2
(Source: Australian Economic Indicators, ABS, April 2009 and March 2010, 1350.0)
88
Macroeconomic Theory III
3BECO – Economic policies and management
a) Between 1996-97 and 2007-08, the number of unemployed people fell by
____________. By how many did unemployment rise in 2008-09? _______________
b) Over the same period calculate:
i) the increase in the number of employed people ____________
ii) the increase in the size of the labour force ____________
c) What do you notice about the participation rate over the period in the table?
_____________________________________________________________________________________
d) Give reasons for the change in the participation rate between 2003-04 and
2007-08.
_____________________________________________________________________________________
_____________________________________________________________________________________
_____________________________________________________________________________________
e) The unemployment rate is a function of the number and quality of people wanting to
work, and the number and kinds of jobs available. What should government do to
facilitate a greater match between the two?
_____________________________________________________________________________________
_____________________________________________________________________________________
_____________________________________________________________________________________
_____________________________________________________________________________________
_____________________________________________________________________________________
_____________________________________________________________________________________
_____________________________________________________________________________________
_____________________________________________________________________________________
Get cracking. I
wanna see you work
dude.
89
Macroeconomic Theory III
3BECO – Economic policies and management
4.
Economic Policy Objectives
Objectives
• outline the economic objectives of the government e.g. sustainable economic
growth, low inflation (price stability), low unemployment (full employment), and
more equitable income distribution
• outline the economic policy objectives of the Reserve Bank of Australia (RBA)
• discuss the extent to which government economic objectives may conflict and
complement each other
• account for the time lags which occur in the use of economic policies i.e.
recognition, implementation and impact lags
The Reasons for Government Intervention
A pure market economy does not naturally look after the interests of everyone in
that economy. It rewards those who possess useful resources and those who do not
possess useful resources get no income. Free markets are generally efficient but the
concept of equity (fairness) does not happen automatically, certainly not in a
socially acceptable way. Government intervention reflects a belief that an economy
cannot solve the economic problem without some undesirable side effects, nor can
it satisfy its peoples’ collective needs and wants. Neither does the economy
conveniently follow a smooth growth path over time but left to itself can fluctuate
significantly with damaging consequences. Such instances of market failure
necessitate government action to:
i) neutralize or eliminate the undesirable side effects (negative externalities).
ii) compensate individuals whose needs are not met by the interplay of market
forces (welfare)
iii) supplement the provision of goods and services which are underprovided by
the market (merit goods/services) and provide those not provided at all by the
market (pure public goods/services).
iv) implement policies which smooth out the economy’s growth path.
Government action to achieve these broad functions constitutes the major
roles of government.
Major Roles of Government
1. Provision of welfare services - provide income (transfer payments) to those who
can’t earn adequate income for themselves. Severe inequalities in the distribution
of income and wealth are socially unacceptable. The Federal government
redistributes income through taxation, transfer payments and the provision of
merit goods such as education and health. This is the distributive function of
government in action.
2. Provision of public and merit goods - public goods or services are those which
would not be provided by the private sector at all (eg. street lighting and defence)
and merit goods are those which would be under provided by the private sector (eg.
education) so govt needs to intervene to make sure a socially adequate supply is
provided in the interests of fairness and social justice. This is the allocative
function of government because it allocates resources into the production of goods
and services not provided, or inadequately provided, by the private sector.
High quality public health is
critical to the overall wellbeing of the economy. Can you
imagine the country without
it?
Economic Policy Objectives
90
3BECO – Economic policies and management
3. Influence business activity - can encourage socially and environmentally
desirable economic activities or discourage undesirable activities through taxation,
subsidies or legislation. This is also the allocative function at work because
government actions affect the way resources are allocated in the economy. This role
would apply to economic activities which produce what are called positive
externalities (eg. green industries like waste treatment and disposal) and negative
externalities (eg. Industries that pollute). Externalities cause the misallocation of
resources because their true costs and benefits are not built into prices. This can
be corrected by government action. Can you think of other examples of government
action which regulate business activity in the interests of society?
4. Macroeconomic management - stabilising the business cycle. This is the
stabilising function of government. Keynes’ main contribution to economics was
the role he saw for government in reducing fluctuations in the business cycle. This
could be done by influencing the level of AD. Countercyclical policies increase AD
during recession and decrease AD during recovery. This will prevent economic
activity rising or falling too rapidly and will smooth out the path of the business
cycle, reducing the severity of swings towards inflation and unemployment.
VOCAB: Pure Public goods - are those where consumption by one person does not
reduce the availability of a good to others, i.e. the Exclusion Principle does not
apply e.g. street lighting cannot be allocated to consumers on the basis of price.
One person’s use of street lighting does not mean there is less street lighting for
others to consume ie. others are not excluded from consumption of street lighting.
Such goods are provided by govt. because the private sector cannot provide the
service directly to the consumer for a price.
NT ACTIVITY 12.1
STUDENT ACTIVITY 4.1
1. Explain the allocative, distributive and stabilising functions of government to a
partner.
2. List next to each of the following which function of govt is being fulfilled, ie. the
allocative, distributive or stabilisation function (maybe more than one).
i) Single parent allowance _________________________________________________
ii) Purchasing a new submarine _______________________________________________
iii) Imposing a carbon tax on motorists ___________________________________________
iv) Providing funds to the Greening Australia program_______________________________
Economic Policy Objectives
91
3BECO – Economic policies and management
v) Raising marginal rates of income tax during an inflationary boom____________________
vi) Subsidising research and development by medical scientists working on cancer
research _________________________________________________
vii) Govt spending on more public housing ________________________________________
Size of the Public Sector
The public sector consists of three levels of government:
• Federal
• State
• Local
The total public sector is all three collectively. The most frequently used yardstick
(measure) of the size of the government sector is govt spending. Other ways of
measuring the size of the public sector include the revenue it collects and the
number of people it employs. The table below shows Australia compared with other
OECD (Organisation for Economic Cooperation and Develoment) economies using
two different indicators.
Comparing the Size of Australia’s Public Sector with Other Countries
Examine the table comparing OECD countries and the size of their public sectors
in terms of expenditure and revenue for 2007. The figures include all levels of
government within a country so for Australia, total general government refers to
local, state and federal levels. (OECD in Figures, www.oecd.org)
Countries
Australia
Austria
Belgium
Canada
Czech Republic
Denmark
Finland
France
Germany
Greece
Hungary
Iceland
Ireland
Italy
Japan
Korea
Luxembourg
Mexico
Netherlands
New Zealand
Norway
Poland
Portugal
Slovak Republic
Spain
Sweden
Switzerland
Turkey
United Kingdom
USA
Economic Policy Objectives
Total General Govt
Revenue % GDP
35.8
47.9
48.6
40.4
41.0
55.6
52.6
49.7
43.9
40.2
44.6
48.3
37.2
46.6
34.6
33.8
41.0
21.7
46.3
44.4
58.3
40.5
43.1
34.0
41.0
56.0
34.7
41.8
34.2
Total General Govt
Expenditure % GDP
34.9
48.5
48.8
39.3
43.6
50.8
47.3
52.4
43.9
43.3
50.1
43.1
34.2
48.5
36.0
30.2
38.0
21.1
45.9
39.9
40.9
42.6
45.8
37.7
38.7
52.6
35.4
44.6
36.6
92
3BECO – Economic policies and management
STUDENT ACTIVITY 4.2ENT ACTIVITY 12.2
1. How many countries in the OECD achieved
a) public sector surpluses? _____________________
b) public sector deficits? _____________________
c) balanced budgets? ____________________
2. Which countries had the top two spending and taxing governments?
_______________________________________________________________________
3. How many countries had higher taxing and higher spending public sectors than
Australia?
a) higher spending ________________________
b) higher taxing _______________________
4. Calculate the average figures for government spending and revenue for the
OECD (to 2 decimal places).
a) av. expenditure ____________________ b) av. revenue ___________________
5. Which country has the highest surplus and what is it as a % of GDP?
___________________
6. Which country has the highest deficit and what is it as a % of GDP?
____________________
7. Comment on Australia’s position relative to other the countries in the list in
terms of the size of its public sector. Is Australia’s public sector too big; are
government spending and taxation too high?
__________________________________________________________________________________
__________________________________________________________________________________
__________________________________________________________________________________
__________________________________________________________________________________
__________________________________________________________________________________
High quality, open and transparent,
democratic and responsible government
is so important to the effective
functioning of an economy.
Economic Policy Objectives
93
3BECO – Economic policies and management
THE MACRO PERSPECTIVE
• Aggregate demand and aggregate supply interact to determine the level of
economic activity which is subject to fluctuations over time (the business cycle).
• Keynesian theory focuses on the role of government in managing and minimising
these fluctuations through its use of particular economic policies, in particular
fiscal policy.
• These macroeconomic policies are countercyclical, ie. they are used to stabilise
the economy by smoothing the fluctuations in the business cycle.
• The implementation of these macroeconomic policies have microeconomic effects
because they influence the economic decisions of firms and households to spend,
invest, produce, work, save, etc.
• Microeconomic reform targets particular underperforming sectors which make up
the macroeconomy. The aim is to achieve a more efficient allocation of resources
and enhance sustainable economic growth.
TYPES OF ECONOMIC POLICIES
1. Fiscal Policy (FP)
2. Monetary Policy (MP)
3. Microeconomic Policy (MER)
1 & 2 are macroeconomic policies since they
influence total demand - they are interrelated in
that О”s in one will have an impact on the other.
No. 3 relates to the productive capacity or supply
side of the economy.
The Federal Government uses 1 & 2 together changing the emphasis according to
changing economic circumstances. These two allow government to directly
influence the level of AD and hence the level of economic growth, price stability and
employment. Microeconomic policy works by government changing the economic
environment in which economic agents operate so that these market participants
can be more competitive and efficient and hence more productive. This in turn will
have important effects on pricing pressures, income and employment growth and
external balance.
MACROECONOMIC OBJECTIVES
1. Price stability - maintaining low inflation. (2 - 3% p.a. on average over the
economic cycle)
2. Full employment - reducing UE to as low as possible without aggravating
inflation.
3. Economic growth - achieving a sustainable rate of economic growth (ie. growth
without inflation).
4. Equitable income distribution - removing socially unacceptable income
disparities (inequalities).
5. Efficient resource allocation - attempting to ensure the nation’s productive
factors are put to their most valued uses which will improve total factor
productivity.
Achievement of all these goals simultaneously is very difficult. The main priority of
authorities here and overseas is to minimise inflation while stimulating economic
growth and therefore lowering unemployment. Microeconomic reform has taken on
more of the burden of achieving sustainable (low inflation) economic growth by
targeting inefficiencies in the economy, complemented by appropriate
macroeconomic policy settings. This has meant moving to structural budget
surpluses (ie. surpluses not reliant on asset sales) in the growth phase of the cycle
Economic Policy Objectives
94
3BECO – Economic policies and management
so that cyclically balanced budgets (ie. deficits and surpluses cancelling each other
out over the course of the business cycle) and reasonably moderate monetary policy
settings are achieved. Government economic objectives may be incompatible or
compatible.
STUDENT ACTIVITY 13.1
STUDENT ACTIVITY 4.3
Sketch a diagram of the business cycle indicating where each macro objective
would receive priority.
% change in real GDP
Time
COMPATIBLE OBJECTIVES
• Economic Growth (EG) and “full” employment: rising EG means growing demand
for factors of production. Unemployed resources including labour are utilised as
production increases. EG since the recession of 1990-91 has seen UE come down
from nearly 12% in 1992 to 4.0% in 2008.
• Economic growth and income distribution: EG is necessary for incomes to rise. As
incomes rise, tax revenue increases and government can redistribute income via
transfer payments and public services of various kinds. Income support schemes
and the provision of merit goods such as health care are sometimes referred to as
the �social wage’. This depends on appropriate redistributive policies being in place.
EG by itself will not guarantee equity (fairness) in income distribution but it is a
necessary condition for it to occur.
INCOMPATIBLE OBJECTIVES
• Price stability and “Full” employment: FE requires high level of EG which may →
AD > AS → inflation (demand pull). As production ↑ → demand for inputs ↑→ input
prices ↑ → cost push inflation. As production↑→ demand for labour ↑ → UE ↓. The
lowest UE since the early 1970s has been achieved without inflation being a problem
until very recently. An average rate of about 2ВЅ% since the 90/91 recession until
2007 has been achieved through microeconomic reforms which have made the
economy more flexible and significant global economic changes, particularly the
emergence of China as a low cost manufacturing centre have contributed too. Trade
liberalisation and labour market reforms have reduced inflationary pressures.
Liberalising trade has meant greater access to low priced manufactured goods for
Australians and decentralising wage setting has reduced cost pressures from wage
increases
Economic Policy Objectives
95
3BECO – Economic policies and management
• Price Stability + Economic Growth: If EG ↑ too strongly → inflation↑. As AD↑ →
demand for inputs ↑ → cost push inflation. As EG↑ → Y↑ → AD↑ → consumer
prices↑ if output can’t keep up. Note in the late 90s economic growth exceeded 4%
without inflation being a problem because there was surplus capacity being created
by MER. Price pressures have mounted over 2007 into 2008 as growth has taken
the economy closer to maximum capacity. Inflation for the year ending June 2008
= 4.5%.
STUDENT ACTIVITY 4.5 ACTIVITY 13.2
Explain how a high rate of economic growth affects the ability of the government to
achieve its other economic objectives.
__________________________________________________________________________________
__________________________________________________________________________________
__________________________________________________________________________________
__________________________________________________________________________________
__________________________________________________________________________________
__________________________________________________________________________________
__________________________________________________________________________________
__________________________________________________________________________________
__________________________________________________________________________________
__________________________________________________________________________________
__________________________________________________________________________________
__________________________________________________________________________________
__________________________________________________________________________________
__________________________________________________________________________________
__________________________________________________________________________________
__________________________________________________________________________________
__________________________________________________________________________________
__________________________________________________________________________________
__________________________________________________________________________________
__________________________________________________________________________________
__________________________________________________________________________________
__________________________________________________________________________________
Economic Policy Objectives
96
3BECO – Economic policies and management
__________________________________________________________________________________
__________________________________________________________________________________
__________________________________________________________________________________
__________________________________________________________________________________
__________________________________________________________________________________
__________________________________________________________________________________
__________________________________________________________________________________
__________________________________________________________________________________
__________________________________________________________________________________
__________________________________________________________________________________
__________________________________________________________________________________
__________________________________________________________________________________
__________________________________________________________________________________
__________________________________________________________________________________
__________________________________________________________________________________
__________________________________________________________________________________
__________________________________________________________________________________
__________________________________________________________________________________
__________________________________________________________________________________
__________________________________________________________________________________
__________________________________________________________________________________
__________________________________________________________________________________
Economic Policy Objectives
97
3BECO – Economic policies and management
THE PUBLIC SECTOR – FUNCTIONS AND REVENUE SOURCES
The structure, some of the functions and the main sources of revenue for
governments in Australia are indicated in the diagram below.
Tables are a very useful
way of presenting
information which is user
friendly.
LOCAL
•
•
•
•
•
•
•
•
•
•
•
STATE
local roads
footpaths
drains
oval & parks
libraries
swimming pools
building standards
garbage collection
street lighting
parking laws
salaries to employees
•
•
•
•
•
•
•
•
•
•
•
•
education
water supply
hospitals
railways
main roads
buses
police & law courts
agriculture
mining & forestry
housing
power
salaries to employees
FEDERAL
•
•
•
•
•
•
•
•
•
•
•
•
foreign affairs
defence
trade
post and telecommunications
social services (welfare)
immigration
health
territories (NT, ACT)
economic management
education
salaries to employees
payments
The money to pay for
all these services
comes from the sources
below.
LOCAL
•
•
•
•
•
•
land rates
building fees
hall hire
parking meters & fines
oval hire
admission charges to
pools
• government grants from
both state and federal
governments
Economic Policy Objectives
STATE
• special grants and the GST
revenue from federal govt
• land tax
• payroll tax
• selling government land
• privatising govt business
enterprises, eg Bankwest,
Alinta
• railway fares & freight
charges
• charges for water, power
& sewerage
• driver’s licences
• motor vehicle licences
• stamp duties on property and
other transactions
• harbour charges
FEDERAL
• personal income tax
• company tax
• indirect taxes eg. tariffs &
excise taxes, GST
• postage stamps
• Telstra charges
• airport charges
• privatising government
businesses eg. Qantas, Telstra
98
5
Fiscal Policy
Objectives. GOVERNMENT ECONOMIC POLICIES
You should be able to:
• explain the concept of fiscal policy
• outline different budget outcomes i.e. balanced, surplus and deficit budgets
• account for differences between planned and actual budget outcomes
• explain the methods of financing a budget deficit and the uses of a budget surplus
• distinguish between automatic fiscal stabilisers and discretionary fiscal policy
• explain the concepts of fiscal policy expansionary, contractionary (restrictive), neutral
stances
• demonstrate and explain the impact of different fiscal policy stances on the level of
economic activity
• evaluate the strengths and weaknesses of fiscal policy
• evaluate recent fiscal policy stances.
FISCAL OR BUDGETARY POLICY
1. Fiscal policy refers to government spending and revenue raising (taxation) in order
to influence the level and nature of economic activity, ie. to achieve macroeconomic
goals like full employment and price stability and to provide the public goods and
services not provided or inadequately provided by the market. In simple terms, FP is
used in the following way:
During a recession – G ↑ and T ↓→ AD ↑→ equilibrium level of income, employment
and output ↑.
During a boom – G ↓ and T ↑→ AD ↓→ equilibrium level of income, employment and
output ↓.
2. Fiscal policy does more than change the level of economic activity. It influences the
nature of activity through its allocative and distributive functions. The main method of
implementing fiscal policy is through the federal budget.
3. The budget contains information on:
a) government expenditure and revenue.
b) the performance of previous year and predictions of future economic performance.
c) current economic problems eg. UE or inflation.
d) new measures and predicted effects.
4. The deliberate changing of G and T is called discretionary fiscal policy. It is
discretionary because it requires judgement and decision making as to what the
economy needs to achieve stability. This is the focus of Keynesian demand
management theory - manipulating AD in order to get as close as possible to a full
employment equilibrium level of national income.
BUDGET OUTCOMES
This refers to 3 possible outcomes:
i) budget deficits: G > T - achieved by G↑ or T↓ or both (expansionary) eg. 1993/94
actual budget outcome = $18.18 billion or 4% of GDP.
ii) budget surplus: G < T - achieved by G↓ or T↑ or both (restrictive) eg. 2007/08 actual
98
budget outcome = $19.7 billion or 1.7% of GDP.
iii) balanced budgets: G = T (neutral effect) – rarely do economic circumstances
justify balanced budgets.
An actual Budget outcome is likely to be different to the planned outcome.
Why?
• EG may exceed expectations → tax revenue ↑→ surplus ↑ or deficit ↓.
• EG may fall short of expectations → tax revenue ↓→ surplus ↓ or deficit ↑.
• Unforeseen events or economic shocks e.g. natural disasters (drought,
earthquake, bushfire, cyclone), external or overseas events (natural disasters and
economic problems in trading partners eg. currency and debt crises in Indonesia,
Thailand and S. Korea 1997-98, or wars and terrorism eg. Gulf wars 1990 and
2003, September 11, 2001, the 2007-08 global credit and economic crisis and the
volcanic eruption in Iceland), and domestic economic events eg. Industrial strife or
wages blowout в†’ declining GDP в†’ worse budget outcome than expected.
• Unexpected positive events eg. breaking of a drought, larger jump in TOT (terms
of trade which is a measure of changes in the prices of exports relative to changes
in the price of imports ), than expected or some technological breakthrough or
greater progress in microeconomic reform в†’ greater economic efficiency в†’ major
boost in productivity в†’ higher national income в†’ better outcome than budget
expected.
• Generally an intended budget outcome rests on the assumptions about economic
performance in the future - impossible to predict accurately growth rates, interest
rates, CPI, TOT, AUD, investment, etc. It is really just intelligent, informed guess
work.
STUDENT ACTIVITY 5.1
Read the following article extracts. Discuss with a partner the consequences of the
events mentioned in the articles on the federal budget outcome. Jot down your
ideas in the space after the articles.
Article 1 (Australian Financial Review, 17-10-06)
Parched bush promised relief into 2008 by Angus Grigg
Prime Minister John Howard yesterday provided an extra $350 million to extend drought relief payments
beyond the next election and said the government would consider expanding assistance to cover small
businesses in rural areas. ...
The changes announced yesterday will allow the country’s 18 drought-declared areas to receive income
and interest rates assistance until March 2008. A federal election is expected by the end of 2007. ... This
comes as Australia battles its worst drought in 100 years, which is expected to reduce farm incomes by 60
per cent this year and wipe up to 0.8 percentage points from GDP growth. This follows heatwaves and
bushfires over the weekend after one of the driest winters on record. ...
Since 2001 the government has spent $1.2 billion on drought relief and said yesterday that 38 per cent of
the country’s agriculture land was affected.
99
Article 2 (Australian Financial Review, 12-10-06)
Economic growth inflates tax take, says OECD by Fleur Anderson
The total tax take collected by Australia’s federal, state and local governments grew faster than the rest
of the country’s economy in 2004 but this reflected strong economic growth rather than a rise in tax rates, an
international report has found.
The total tax take as a proportion of gross domestic product grew faster than the average of 30
developed countries in 2004, the Organisation for Economic Cooperation and Development says in a report
released in Paris last night.
Australia’s total tax revenue rose 0.5 percentage points to 31.2 per cent of GDP between 2003 and
2004, compared to an average 0.1 per cent of GDP for all developed countries. Treasurer Peter Costello said
Australia was the eighth-lowest taxing country in the OECD, according to the latest edition of the group’s
Revenue Statistics. ...
... the OECD report also showed Australia had the third-highest reliance on taxes on income and profits
as a single source of tax revenue, behind only New Zealand and Denmark.
__________________________________________________________________________________________
__________________________________________________________________________________________
__________________________________________________________________________________________
__________________________________________________________________________________________
__________________________________________________________________________________________
__________________________________________________________________________________________
__________________________________________________________________________________________
__________________________________________________________________________________________
__________________________________________________________________________________________
__________________________________________________________________________________________
__________________________________________________________________________________________
________________________________________________________________________________________
VOCAB: Fiscal balance - is now the key indicator of the fiscal position - the aim of budget policy is to
achieve fiscal balance over the course of the economic cycle (surpluses in times of growth balanced
by deficits in times of recession and recovery). Fiscal balance uses the accrual method to measure the
difference between revenue and expenditure (accrual method: recording transactions when they are made
not when payments are made or received).
Underlying Cash Balance - formerly known as the underlying budget outcome. This measures the actual
cash position of the government, ie. records cash payments made over the fiscal year and does not
necessarily coincide with the fiscal balance. It excludes asset sales. The headline cash balance includes
asset sales.
100
AUTOMATIC STABILISERS
The term automatic stabiliser refers to the effect of cyclical changes in the economy
which occur automatically and counterbalance economic fluctuations and reduce
the size of the multiplier effect of injections and leakages. An automatic stabiliser
tends to increase the government’s deficit during a recession and increase its
surplus during inflation without requiring any deliberate (or discretionary) action
by policy makers.
a) Progressive personal income tax - tax revenue increases when GDP and income
rise due to bracket creep (income earners moving into higher tax brackets as their
income rises over time) and falls when GDP declines. This acts as a brake on the
growth of AD when growth is too strong and cushions the fall in AD that occurs in
a recession.
b) Transfer payments - such as UE benefits, work in the opposite way, ie. increase
during recession and rising UE, and fall when UE falls during periods of economic
growth. The above examples relate directly to the government’s fiscal outcome,
however there are other automatic cyclical changes which have countercyclical
effects and do not work through government finances.
The automatic stabilisers of progressive personal income tax and UE benefits
contribute to the cyclical component of the budget, ie. automatic adjustments to
G and T due to the movement of the economy through the business cycle.
[Additional stabilising effects come from spending on imports and having a flexible
exchange rate. For example spending on M rises and provides an outlet for AD in
times of strong economic growth. Rising M → net X↓→ AD↓. During slowdowns M↓→ net X↑→ AD↑. A flexible AUD during an economic slowdown → depreciation →
X cheaper and more competitive and M more expensive → net X↑→ AD↑. During
strong growth → appreciation → X less competitive and M cheaper → net X↓→ AD↓.
A flexible ER helps insulate the domestic economy from the effects of external
shocks such as the Asian financial crisis or strong commodity prices so FP can be
used to target domestic problems such as inflation and UE.]
101
Fiscal drag may occur as the economy emerges from recession, ie. as GDP increases
and incomes increase, tax receipts increase also and blunt the effect of the growth of
demand. This may be unwanted in the early stages of recovery.
During a recession G > T - budget deficit (to cure a deflationary gap)
During a boom G < T - budget surplus (to cure an inflationary gap)
Discretionary FP contributes to the structural component of the budget, ie.
deliberate О”s to government spending and to tax rates.
BUDGET OUTCOME = STRUCTURAL COMPONENT + CYCLICAL COMPONENT.
STUDENT ACTIVITY 5.2CTIVITY 15.2
1. Use Keynesian model of income analysis to illustrate budgetary action by
government in a recession and inflationary boom.
a) In a recession (deflation).
b) In a boom (inflation).
2. Complete the following multiple choice questions.
i) Which of the following would have an automatic stabilising effect on the economy
during a slowdown?
a) rising savings.
b) falling transfer payments.
c) an appreciating currency.
d) declining income tax payments.
ii) Discretionary fiscal policy can be defined as
a) changes in the categories of taxing and spending that are the result of
political pressure on governments.
b) automatic changes in government spending and taxation to smooth out
the business cycle.
c) deliberate changes in government spending and taxation to smooth out
the business cycle.
d) changes that occur in automatic stabilisers as a result of growth in the
welfare state.
iii) A pure public good is
a) a product when consumed by one person does not make that product
less available to other consumers.
b) it is any good produced by the public sector.
c) it cannot be produced at a profit by firms.
d) it must be provided for all members of society.
102
Fiscal policy should be implemented
with economic stability as the
primary objective.
This is very difficult in the real
world of politics and influential
sectional interests.
VOCAB: Public Sector Borrowing Requirement - Total borrowings of all sectors and levels of
government in Australia. This includes Federal, State and Local govt plus govt authorities such as
Australia Post and Western Power.
It is very important to be able to apply the theory you learn in class and from your
texts. You must be able to fit the annual federal budget into the theoretical picture.
You could be asked a question on this year’s budget and perhaps be required to put
it into an overall macroeconomic context.
Examine the diagram of the business cycle showing annual change in RGDP.
Annual % change in RGDP 1979-80 to 2009-10 Dec
6.0
5.0
4.0
3.0
2.0
1.0
2008-09
2007–08
2006–07
2005–06
2004–05
2003–04
2002–03
2001–02
2000–01
1999–00
1998–99
1997–98
1996–97
1995–96
1994–95
1993–94
1992–93
1991–92
1990–91
1989–90
1988–89
1987–88
1986–87
1985–86
1984–85
1983–84
1982–83
1981–82
2009-10 Dec
-2.0
1980–81
-1.0
1979–80
0.0
-3.0
103
STUDENT ACTIVITY 5.3CTIVITY
1. Work with a partner on the following task. If you were in charge of fiscal policy,
what would you have done over the course of the business cycle? What would your
key objectives be and how would you adjust fiscal policy to achieve them? What
problems might you have in implementing your fiscal policy?
__________________________________________________________________________________
__________________________________________________________________________________
__________________________________________________________________________________
__________________________________________________________________________________
__________________________________________________________________________________
__________________________________________________________________________________
__________________________________________________________________________________
__________________________________________________________________________________
__________________________________________________________________________________
__________________________________________________________________________________
__________________________________________________________________________________
__________________________________________________________________________________
__________________________________________________________________________________
__________________________________________________________________________________
__________________________________________________________________________________
__________________________________________________________________________________
__________________________________________________________________________________
__________________________________________________________________________________
__________________________________________________________________________________
__________________________________________________________________________________
__________________________________________________________________________________
__________________________________________________________________________________
__________________________________________________________________________________
__________________________________________________________________________________
104
2. Examine the pie graphs below for the 2009-10 Budget.
(source: www.budget.gov.au/2009-10/content/overview/html/overview_40.htm)
Where the money comes from (government revenue)
Where the money is spent (government expenditure)
a) In the budget of 2009-10 which type of tax provided most revenue?
_______________________________
What percentage of total revenue (to 2 decimal places) did it contribute?
______________%
b) What proportion of total revenue did company & petroleum resource rent tax
contribute? _________________%
c) On what area of public expenditure was the greatest share of this revenue spent?
_______________________________________. What percentage of total revenue (to 2
decimal places) did it account for? _______________%
d) Health, welfare and education together account for _______________% of total
Commonwealth expenditure.
105
3. Calculate expected total expenditure and revenue for 2009-10.
Expenditure
____________________
Revenue
____________________
4. All the budgets from 1996-97 to 2008-09 aim to achieve surpluses. The current
budget plans for a deficit. Explain the reason for the change from surpluses to
deficit?
__________________________________________________________________________________
__________________________________________________________________________________
__________________________________________________________________________________
__________________________________________________________________________________
__________________________________________________________________________________
__________________________________________________________________________________
5. Examine the graph showing the level of Commonwealth public debt over the
period 1981-2006.
a) Suggest reasons for the increase in Commonwealth public debt in the mid 1980s
and 1990s.
__________________________________________________________________________________
b) Why do governments incur debt?
__________________________________________________________________________________
__________________________________________________________________________________
106
c) What problems may arise from governments having high levels of debt?
__________________________________________________________________________________
__________________________________________________________________________________
__________________________________________________________________________________
6. Examine the graphs below showing public debt.
(Source: http://www.budget.gov.au/2009-10/content/bp1/html/bp1_bst4-06.htm)
a) Which country has the highest level of public debt? __________________ Suggest
reasons for this.
________________________________________________________________________________
b) Which country had no public sector debt in 2008? _________________________
c) How can countries reduce debt?
________________________________________________________________________________
________________________________________________________________________________
________________________________________________________________________________
107
THE AIMS OF FISCAL POLICY IN THE FIRST DECADE OF THE 21st CENTURY
• Increasing the level of national savings is a priority of the federal government in
order to reduce the need to borrow abroad and to put downward pressure on interest
rates. If the public sector is a net saver (by running budget surpluses) then it does not
compete with the private sector for funds to finance its deficit spending and thus will
not contribute to the national saving-investment imbalance (Australia’s investment
needs > national savings). This helps keep interest rates down which is good for
economic growth. The relationship between the budget outcome and the current
account balance (CAD) can be illustrated in simple terms using the
leakages/injections model of equilibrium:
S + T + M = I + G + X therefore: M - X = I - S + G – T
In other words: CAD = savings/investment gap (I-S) + budget balance (G-T)!
The implication is that when the private sector’s need for investment funds is
increasing due to economic growth, government should be achieving growing
surpluses.
• Budget surpluses will enable the federal government to reduce accumulated
commonwealth debt and thereby reduce the need to spend on interest payments on
debt in annual budgets. This will allow government to make more equitable
adjustments to social policy and more competitive adjustments to taxation.
• By running surpluses, the government believes it will boost international confidence
in the Australian economy which will help keep interest rates down and encourage the
private sector to invest. By implementing responsible fiscal policy it is hoped
sustainable economic growth will be higher.
• Along with continued improvements to the tax system and microeconomic reform in
general, surplus-oriented budgetary policy should underpin strong, non-inflationary
economic growth and rising employment and allow monetary policy settings to achieve
interest rates lower than they would otherwise be.
• By accumulating surpluses and paying off debt during the good times, the
government can be in a strong financial position when the next recession occurs.
Public debt has opportunity costs but it also plays an
important role in financial markets providing an
investment option for managed funds (eg. super funds). If
debt is manageable and increases public infrastructure
enhancing overall economic growth, the opportunity
costs of debt may be justified.
108
STUDENT ACTIVITY 5.4
Complete the following questions.
i) Fiscal policy directly affects the level of national income and output through its
effects on
a) financial markets and interest rates.
b) merchandise trade.
c) wage levels.
d) aggregate demand.
ii) Financing a commonwealth budget deficit can be by
a) raising marginal tax rates.
b) using foreign exchange reserves.
c) selling bonds to the public.
d) retiring public debt.
iii) Some people argue that persistent budget deficits and the resulting growth in
government debt create economic problems. Which of the following is not such a
problem?
a) Their demand for funds crowds out real investment.
b) They cause increased costs of servicing external debt.
c) The resulting impact on AD leads to deflation.
d) They worsen the balance on the current account.
iv) An increased budget deficit would raise AD but it could reduce investment
spending by
a) indirectly causing interest rates to rise.
b) damaging household sector confidence.
c) selling government securities which are more attractive than real assets.
d) reducing disposable household income.
v) Since the 1996 budget, surpluses have been a goal of the Federal Government. A
consequence of this policy has been:
a) a worsening in the BOP.
b) a rise in unemployment.
c) a fall in interest rates and stronger private sector expenditure.
d) a growing problem with inflation.
vi) Inflation is likely to increase when a budget
a) deficit is the outcome during a boom .
b) deficit is the outcome during a recession.
c) surplus is the outcome during a boom.
d) surplus is the outcome during a recession.
vii) Which of the following defines discretionary fiscal policy?
a) Deliberate changes in government spending and taxation to smooth out
the business cycle.
b) Automatic changes in government spending and taxation to smooth out
the business cycle.
c) Changes in government purchases of financial assets to smooth out the
business cycle.
d) Changes that occur in automatic stabilisers as a result of economic
growth.
109
viii) Fiscal policy may act on determinants of demand as follows:
a) earnings from exports are increased when government spending is
increased.
b) saving is increased when interest rates are increased.
c) consumption is reduced when levels of taxation are increased.
d) investment spending is increased when governments run deficits.
STUDENT ACTIVITY 15.4
ix) The Commonwealth Government finances a budget deficit partly by
a) using portfolio investment fl owing in from overseas.
b) selling government securities on the open market.
c) buying back government securities on the financial market.
d) using its savings generated by previous budget surpluses.
x)
Expenditure
C+I+G
45
в—¦
GDP
Yfe
Given the situation depicted in the diagram above, the most likely government
fiscal policy action would be to
a) reduce government spending to lessen inflationary pressures in the
economy.
b) increase government spending to raise the level of employment .
c) leave government spending unchanged, but decrease taxes on
households and firms.
d) decrease tariffs to encourage spending on imports and thus reduce
domestic employment.
EFFECTIVENESS OF FISCAL POLICY
Some disadvantages of FP
1. Unforeseen changes in economic circumstances may undermine fiscal policy
goals, eg. changes in wages, investment, consumption spending, exports, natural
disasters and overseas events (eg. war in Afghanistan and GFC).
2. Problems of forecasting effects of FP - eg. will consumers increase spending or
saving with tax cuts? Will investment rise when the company tax rate is lowered?
3. Information for assessing the state of the economy and trends may be
inadequate. Data is always out of date – it reflects the state of the economy in the
past.
4. Political problems - restrictive fiscal policy can be avoided when needed or
reversed when it should continue due to political or electoral factors. Governments
are subject to pressures from various lobby groups (eg. conservationists, trade
unions, business groups, welfare groups, etc) particularly close to elections so that
110
fiscal policy may be strongly influenced by social and political factors instead of the
needs of the economy. In fact it could be said that given Australia’s three year
electoral cycle, fiscal policy in the hands of politicians is something of a liability.
Governments are reluctant to cut spending to rein in deficits or increase surpluses
when the economy demands it because they don’t want to upset voters, and they
don’t want to leave a large surplus to their political opponents if they lose control of
government. This tends to weaken FP as an economic tool.
5. Time lags:
i) recognition lag – it takes time to recognise the need for a particular course of
fiscal action (the role of statistical data is important).
ii) implementation lag – deciding and implementing policy takes time – budgets
must be approved by Parliament and may be held up for several months if the
government does not have the numbers in both houses of Parliament.
iii) impact lag – it takes time for fiscal policies to take effect and have the desired
impact once implemented.
6. Crowding out (if in times of late upswing):
a) Expansionary FP → public sector saving ↓→ budget surplus ↓ or deficit ↑.
b) Government borrows from money (capital) market by selling bonds – increases
demand for funds pushing up interest rates. In the diagram below demand for
money D1money increases to D2money. This leads to a rise in interest rates from r1 to r
2 . This adds to Public Debt.
c) Private investment falls from I1 to I2 , ie. investment is crowded out.
Interest rate
Interest rate
S money
r2
r1
D2money
Demand function
for investment
funds
D1money
Qmoney
I2
I1
Investment
Some advantages of FP
a) Can be selective eg. taxes and subsidies can be specifically targeted at particular
industries, sectors or income groups unlike monetary policy (MP) - has allocative
and distributive effects.
b) Impact lag is shorter than for MP - more immediate results particularly in
recession when MP may be ineffective.
c) Built-in stabilisers give some flexibility eg. fiscal drag in times of demand
inflation, ie as incomes rise people move into higher tax brackets - they lose more
of their income in taxes and can’t spend it. Therefore government spending cuts
need not be as severe в†’ political benefits. Discretionary fiscal changes can be
reinforced by automatic adjustments.
111
6.
Monetary Policy
Objectives. GOVERNMENT ECONOMIC POLICIES
You should be able to:
• explain the concepts of monetary policy and the cash rate
• outline the circumstances under which the RBA may change the cash rate
• explain the concepts of expansionary, contractionary and neutral monetary policy
stances
• demonstrate and explain the impact of different monetary policy stances on the level of
economic activity
• evaluate the strengths and weaknesses of monetary policy
• evaluate recent monetary policy stances.
MONETARY POLICY
Definition and Function
• Monetary policy refers to RBA actions to affect monetary and financial conditions
(chiefly interest rates) for the purpose of achieving low inflation and sustainable
economic growth. It is defined as central bank action to manipulate the price and
availability of credit in the economy. By doing this, the RBA influences the borrowing
and lending activities of the financial sector.
• The RBA announces its desired monetary policy position in terms of the cash rate
(interest rate or r) on funds in the short term money market (overnight cash market).
The bank then operates in the market each day to maintain the target cash rate. The
bank does this through its open market operations ie, its buying (or selling) of
securities to increase (or reduce) the level of funds banks have available to them to
lend to bank customers (borrowers). The aim is to manipulate the supply of funds in
order to bring about equilibrium between supply and demand in the cash market at
the desired cash rate.
• By changing the cash rate, the RBA changes the whole structure of interest rates (r)
across the economy and hence the level of economic activity. The ultimate goal is to
keep the underlying inflation rate between 2 - 3% on average over the business cycle.
• MP is conducted by RBA on behalf of the federal government which has the legal
power to override RBA decisions. Ultimately the federal govt. has responsibility for the
general level of economic activity however the RBA’s independence in conducting MP
has been well established in recent years.
The following extract is taken from the RBA Statement on the Conduct of Monetary
Policy of 14th August 1996.
Statement on the Conduct of Monetary Policy
In this statement the government acknowledged the high degree of independence the
RBA has in the conduct of MP and endorsed the bank’s inflation target range of 2 - 3%
on average over the business cycle.
“Monetary Policy is a key element of macroeconomic policy and its effective conduct
is critical to Australia’s economic performance and prospects...
The Reserve Bank Act gives the Reserve Bank Board the power to determine the
Bank’s monetary policy and take the necessary action to implement policy changes.
...”
112
The Reserve Bank Act of 1959 sets out the objectives as:
i) the stability of the currency of Australia (low inflation)
ii) the maintenance of full employment in Australia, and
iii) the economic prosperity and welfare of the people of Australia.
The RBA focuses on price stability because it is an essential precondition for the other
objectives. Low inflation and low inflation expectations “... assist business in making
sound investment decisions, underpin the creation of new and secure jobs, protect the
savings of Australians and preserve the value of the currency.”
The government also acknowledges the importance of disciplined fiscal policy and its
role in assisting and complementing monetary policy in achieving these objectives.
(For further information on the RBA and its history go to www.rba.gov.au and click on
�About the RBA’ on the top left side of the home page)
Regulatory Structure of the Financial System
• On July 1st, 1998, a new financial regulatory structure came into place. The new
structure consists of:
i) the Australian Prudential Regulation Authority (APRA)
ii) the Australian Securities and Investment Commission (ASIC)
iii) the Reserve Bank of Australia (RBA)
• APRA - is responsible for the prudential supervision of financial institutions : banks,
life and general insurance companies, superannuation funds, building societies, credit
unions and friendly societies. Its role is to look after the deposits of the public and
maintain public confidence in the banking system.
• ASIC - has responsibility for ensuring �market integrity’ and consumer protection
across the financial system. It sets and enforces standards for financial market
behaviour and for selling financial products including investment, insurance,
superannuation and deposit-taking activities.
• RBA - retains responsibility for the conduct of monetary policy and the maintenance
of overall financial stability. It no longer has responsibility for the prudential
supervision of banks. It remains the �lender of last resort’ , ie. “... the only agency
which is able to provide emergency liquidity support in the event of any threats to the
stability of the financial system” (RBA Bulletin, July 1998). It will continue to supervise
the payments system.
STUDENT ACTIVITY 6.1
1. Explain to a partner the role of MP and the RBA
2. Write a paragraph on the role of the MP and the RBA.
113
THE FINANCIAL SYSTEM
The financial sector fulfils the very important task of collecting + mobilising surplus
funds (savings, both domestic & foreign) in the economy and making them available to
borrowers. The efficiency with which this is done is central to the economic health of
the nation. It facilitates economic growth (ie. output + employment growth).
CIRCULAR FLOW
HH
S
Financial Sector
Consists of financial institutions:
• RBA
• Banks
• Non Bank Financial Institutions (superannuation funds,
credit unions, building societies, finance companies,
insurance companies, merchant banks)
• Sharemarket
Firms
I
The Money Supply may be defined as the volume of money which exists in the
economy at any point in time.
STUDENT ACTIVITY 6.2
Explain why and how the financial sector is important to the functioning of the
economy.
WHAT IS MONEY?
• Money is a medium of exchange. How well it fulfils this function depends on its
ability to retain and measure value, how convenient it is to use and above all the
degree of confidence the public has in money to do these things. People will accept
money whether it be notes and coin or electronic money, only if they are confident that
the money they receive can be exchanged for the goods and services they want, or
alternatively that it will substantially hold its value if they choose to store their
spending power in a bank for later use. In other words it should still be exchangeable
for the same quantity of goods and services at some later time. So the test of what
constitutes money is purchasing power, ie. its ability to be exchanged for goods and
services.
Glenn Stevens, Governor of the RBA, stressed the main role of the RBA when he said
“Preserving the purchasing power of money is the most important contribution
that monetary policy can make to sustainable prosperity” (October 2006).
• There is no single, official definition of the money supply. There are a number of
measures of the money supply called monetary (or financial) aggregates. The most
important are:
1. M3 = currency + bank deposits.
2. Broad money = M3 + deposits with non-bank financial institutions (NBFIs).
3. Credit = loans by all financial intermediaries.
4. Money Base = currency + private sector deposits with the RBA.
• RBA has tended to focus on credit because it gives a guide to the total volume of
borrowing and lending in the economy which is directly linked to the level of total
spending (AD) ie. the level of economic activity. Bank deposits are important because it
is from bank deposits that loans and advances come – banks create credit from their
lending activities.
114
FACTORS AFFECTING INTEREST RATES
The rate of interest is the price of money or debt. The price of money like the price of
anything, is determined by supply and demand. When either supply or demand shift,
the equilibrium rate of interest will change too. The primary influence on interest rates
in Australia is action by the Reserve Bank (monetary policy) although there are other
factors which impact on interest rates.
The price of
money is the rate
of interest (r)
r
Sm
Supply of money comes
from the RBA, banks
and other financial
institutions including
overseas sources
Equilibrium rate of interest is where the demand for
money and the supply of money are equal
r
Dm
Demand for money
comes from HH, firms
and governments
Qm
Q
r
Sm
When demand for money rises as during
an expansion, interest rates rise. More
money is required by HH and firms for
purchasing goods and services and
investment. Credit growth and liquidity
rise.
r1
r
Dm1
Dm
Qm
1
Q Q
r
Sm
During a contraction, AD falls causing
the demand for money to decrease and
interest rates to fall. The Dm function
would shift to the left and credit growth
falls.
r
r1
Dm
Dm1
Qm
Q1 Q
115
r
Sm
Sm1
r
r1
When the supply of money increases, the
scarcity of money falls making it cheaper
(ceteris paribus). HH and firms respond by
expanding their demand for money. In a
trough the RBA may be worried about rising
unemployment and so increases the
availability of money (liquidity) hoping people
will borrow and spend (credit growth rises).
Dm
Qm
Q
Q1
r
Sm1
Sm
r1
During strong growth, inflation may concern
the RBA so it will decrease the Sm and the
Sm function will shift to the left. Interest
rates rise and the demand for money
contracts. Q falls to Q1 representing falling
liquidity (credit growth declines)
r
Dm
Qm
Q1
Q
• Federal budgets: the effects depend on the way the deficit is financed which can be
done in three ways:
a) Borrowing from the RBA - increases liquidity (money supply or MS grows) → r↓
(known as “printing money”).
b) Borrowing from the private sector (the Australian public) - liquidity remains
unchanged because the govt takes money out of the economy through its sales of
securities (borrows) and puts it back again through its own spending so there is no net
change. However since the public sector competes with the private sector for funds
this may contribute significantly to the demand for funds during periods of economic
growth causing interest rates to rise (deficit spending → Dm↑→ r↑ where Dm is the
demand for money). This is known as the �crowding out’ effect. Borrowing from the
public may include from overseas sources as well - in theory liquidity does not
change under a floating exchange rate. The exchange rate adjusts to absorb external
sources of increased liquidity. In reality other factors may counteract this exchange
rate adjustment so that liquidity may increase as the borrowed capital flows into the
economy.
• Credit Creation: the credit creation process of banks, ie. their lending activities
generate new deposits which leads to new lending and in turn more deposits and so
on increasing the MS → r↓. This process is started off by an initial rise in bank
liquidity which forces down interest rates across the economy. Lower r → borrowing↑→
(C + I)↑→ AD↑→ national income, output and employment↑ via the multiplier. The level
of economic activity increases - the economy expands. Demand for money for spending
116
purposes expands because lower r makes holding money in interest bearing assets
less attractive (higher opportunity cost of saving).
• Market Operations: this is the primary function of the RBA and refers to the sales
and purchases of Commonwealth Govt Securities (CGSs) by the RBA in the money
market for the purpose of influencing r. These transactions between the RBA and the
financial sector (banks and some other financial institutions like super funds) alter the
supply of funds in the money market relative to the demand for those funds and thus
the general level of r.
Market sales of securities by the RBA decreases the MS → r ↑.
Market purchases of securities by the RBA increases the MS → r ↓.
Factors influencing r level relate to factors determining the supply and demand for
money. The main factor is the point in the business cycle the economy is at. In
recession, r↓ & in boom, r↑. Overseas r levels, balance of payments and exchange rates
have their impact too. The level of competition between financial institutions is a very
important factor in today’s financial sector. More competition puts downward pressure
on r. Demand factors relate to household, firm and government reasons for wanting
money. Demand for money is like the demand for a currency or a factor of production
- it is a derived demand, ie. it relates to private sector (consumer and producer)
demand for goods, services and factors of production and public sector fiscal
outcomes (deficits or surpluses).
Interest rates are determined by the supply and demand for money. In very simple
terms RBA actions increase or decrease credit supply in the banking system which in
turn causes the price of money (r) to fall or rise which in turn causes the demand for
credit to expand or contract. This will stimulate or slow AD and therefore influence the
level of economic activity.
STUDENT ACTIVITY 6.3
i) Oral activity – topic: Factors affecting interest rates.
ii) Speed writing exercise: Study the previous section on the factors which affect
interest rates for about 5-10 minutes. On a piece of A4 paper write as rapidly as you
can for 5-10 minutes on the topic �Factors which influence interest rates’. Swap your
work with your partner and read it and give a mark out of 5. Provide feedback.
_____________________________________________________________________________________
_____________________________________________________________________________________
_____________________________________________________________________________________
_____________________________________________________________________________________
_____________________________________________________________________________________
_____________________________________________________________________________________
_____________________________________________________________________________________
_____________________________________________________________________________________
117
_____________________________________________________________________________________
_____________________________________________________________________________________
_____________________________________________________________________________________
_____________________________________________________________________________________
_____________________________________________________________________________________
_____________________________________________________________________________________
_____________________________________________________________________________________
_____________________________________________________________________________________
_____________________________________________________________________________________
_____________________________________________________________________________________
_____________________________________________________________________________________
_____________________________________________________________________________________
_____________________________________________________________________________________
_____________________________________________________________________________________
_____________________________________________________________________________________
_____________________________________________________________________________________
_____________________________________________________________________________________
_____________________________________________________________________________________
_____________________________________________________________________________________
_____________________________________________________________________________________
118
MARKET OPERATIONS BY THE RBA - LIQUIDITY MANAGEMENT
“Most of the operations the RBA undertakes in financial markets are for the purpose of
implementing monetary policy. Monetary policy changes are announced in terms of a
target for the cash rate - the interest rate on overnight interbank loans in the monetary
market - and domestic money market operations are undertaken each day to maintain
the cash rate around the target level... The cash rate is determined in the market each
day by the interaction of the demand for and supply of Exchange Settlement (ES) funds funds banks use to settle transactions with each other and with the RBA. The RBA’s
ability to influence this rate rests on the fact that it is the sole supplier of these funds. It
can increase or decrease the supply of ES funds by undertaking domestic market
operations.”
(p5, Reserve Bank Annual Report, August 2000).
Central banks such as the RBA implement MP by engaging in transactions to
influence short term interest rates, in particular the overnight cash rate. All banks in
Australia maintain accounts with the RBA called Exchange Settlement Accounts
(ESAs). They must maintain a surplus in these accounts at all times. When a cheque
is used to pay a bill for example, the cheque which is written against the writer’s
(drawer) account at Bank A, is deposited in the receiver’s (payee) account at Bank B.
This means funds will have to be transferred from Bank A (from the drawer’s account)
to Bank B (into the payee’s account). The transfer of funds between banks to settle
such transactions each day occurs through these ESAs. The balances (funds) in these
ESAs are called Exchange Settlement (ES) funds.
If a bank does not have enough funds in its ESA, it has to borrow from other
banks. The need for ES funds to settle daily interbank transactions provides the
demand in the short term money in the cash market. Banks receive interest from the
RBA at 0.25% below the prevailing cash rate on the funds in their ESAs.
The demand for ES funds is fairly predictable although it does fluctuate daily.
The RBA adjusts the supply of ES funds to offset the changes in demand so that the
price of those funds, the cash rate, is preserved. So if the demand for ES funds rises
for some reason (eg increased tax payments to the Federal Government), the RBA
would inject funds into the ESAs of the banks thus preventing the cash rate rising. It
does this by purchasing short term securities (treasury notes or bonds) from the
banks. They receive the required quantity of cash from the sales of these securities
which is deposited in their ESAs. When there is a rise in the level of funds in ESAs,
the RBA sells securities to the banks which draws money out of their ESAs preventing
the cash rate falling. This is done each day to maintain the cash rate at the target
level. The following diagrams illustrate RBA actions to maintain the cash rate when
the demand for ES funds increases.
Cash rate
Cash rate would
rise when D for
ES funds
increases if RBA
did not inject
funds into ESAs
r2
r1
Aggregate ES funds (Sm)
Cash rate
Demand for funds by banks
in overnight cash market
increases (D1 в†’ D2)
D2
ES funds (S1) ES funds (S2)
Cash rate
(stable)
D1
D2
ES funds increase after
RBA intervenes by buying
securities from banks and
injecting funds into their
ESAs – this maintains the
cash rate at r1
D1
Q cash in money market
Q cash in money market
The RBA’s actions are calculated to ensure the banking system has the funds it
needs (and no more than that) to conduct its daily interbank transactions. The RBA’s
operations are always done with the effect on the cash rate in mind. When the RBA
wants to change the cash rate it simply targets the level of funds in the banks’ ESAs
119
through its open market operations. If it wants to raise the cash rate (tighten MP) it
increases its sales of securities relative to daily purchases thus reducing the
funds in the bank’s ESAs (supply of ES funds ↓ - reduces financial system’s
liquidity). The yield on short term securities = the cash rate which is also the rate at
which banks borrow from each other on the overnight cash market. If the RBA wants
to lower the cash rate (loosen MP), it will increase its purchase of securities
relative to sales thus pumping more cash into the ESAs (supply of ES funds ↑ increases financial system’s liquidity).
Since financial institutions are engaged in the buying and selling of many kinds
of securities, the change in the cash rate will flow through to all categories of
securities. These securities include short term securities (eg. 90 day bank bills) and
long term securities (eg. 10 year government bonds). Yields adjust right across the
economy in all asset markets - government bonds, the stock market and the property
market.
Greater liquidity caused by RBA action в†’
prices in wider market for all kinds of
assets ↑ (bonds, shares, property, etc.)
(P1→P2) → yields↓. The process of
adjustment in prices is triggered across the
whole economy. As liquidity↑ and short
term rates↓, funds move to where yields are
relatively more attractive which drives up
their prices and in turn their yields down
too. In this way a new equilibrium level of
higher prices and lower yields is established
across the economy. Think about the
reverse process if the RBA reduced
liquidity.
Price of assets
S of assets
Note: an asset price and its
yield are inversely related
P2
P1
D2 for assets
D1 for assets
Q1
Q2
Quantity of assets
traded in the market
The shift in interest rates and hence all yields will change the relative
opportunity costs of saving, borrowing, investing and spending and therefore the level
of economic activity. The effect of a change in the cash rate is transmitted very quickly
to the rates banks charge households and firms which in turn impacts on AD. The
impact on AD may take quite a long time to fully wash through the economy - 12 to 18
months usually. (For further information go to www.rba.gov.au then go to Monetary
Policy and Market Operations across the top of the home page).
STUDENT ACTIVITY 6.4
Read the following extract from the AFR 29-8-00, p4:
“The first tax instalment under the new tax system put the overnight money market $3.45
billion in deficit last week, a surprisingly high figure that indicates the Federal
Government could be in for a GST revenue bonanza. ...
Last week companies with a turnover of $20 million were required to remit their first
GST payment, and this created the substantial deficit in the money market. Government
sources confirmed that the Government’s accounts were substantially in surplus as a
result of the payments, and that this was somewhat larger than expected.”
Explain the likely action the RBA would have taken to preserve the cash rate.
_____________________________________________________________________________________
_____________________________________________________________________________________
_____________________________________________________________________________________
120
_____________________________________________________________________________________
_____________________________________________________________________________________
_____________________________________________________________________________________
_____________________________________________________________________________________
_____________________________________________________________________________________
_____________________________________________________________________________________
How RBA purchases of securities affects macroeconomic activity. Examine the
following diagrams.
r
Overnight cash market
S1
r
S2
Investment rises when
interest rates fall (cet par)
Expected rate of return must
be > cost of capital (r) for
investment to take place
r1
r2
Investment demand
function
Qm
I1
Securities purchases → liquidity↑
(S1→S2) → r↓→ C↑ & I↑ → Y↑,
E↑ + O↑ → economy expands
I2
Investment (in �real’ or
productive projects)
(line of potential
equilibrium points)
Total expenditure
AD2
Why do C + I ↑ when r↓?
2 reasons:
a) cost of borrowing ↓
b) opportunity cost of
spending + investing ↓
О”I
О”Y
Y/GDP
45в—¦
Y1
AD1
Also C rises when r falls в†’
ΔI↑ → ΔY increases further as
does employment and output
via the multiplier в†’ expansion
Y2
Market sales of securities by the RBA: everything is reversed in the above diagrams.
121
VOCAB: Short Term Security - the most frequently used security is a treasury note (essentially just a
electronic IOU) which is sold by the RBA to participants in the financial sector at a given price then
repurchased at a guaranteed higher price at a future date. The length of time between selling and buying
back the security varies but is not very long (eg. 5 weeks) hence the name short term security. The yield is
calculated by dividing the difference between the sale and buyback price by the sale price times 100. This
yield or rate is called the cash rate or cash target. The RBA in its daily transactions of short term securities
maintains equilibrium between the value of sales and the value of repurchases (redemptions) when it wants
to preserve the existing cash rate. When it wants the cash rate to fall it will increase repurchases relative to
sales (liquidity rises) with the aim of causing the cash rate to drop to a target level. When the RBA wants to
raise the cash rate and hence all interest rates, its sales will exceed repurchases (liquidity falls) to achieve a
higher cash target. It decides on a particular target yield and hence target price for the securities and issues
an appropriate quantity of securities. This achieves the desired change in liquidity which triggers change
throughout the whole financial system.
eg. sale price = $94 and repurchase price = $100
therefore the cash target = $100 - $94 x 100 = $6 x 100 = 6.38%
$94
$94
If RBA wants to lower r to a target of around 4.7% for example then it would need to lower the repurchase
price to about $98.43 for new securities:
$98.43 - $94 x 100 = $4.43 = 4.71%
$94
$94
STUDENT ACTIVITY 6.5
1. Using diagrams show how RBA market operations can reduce the level of economic
activity.
_____________________________________________________________________________________
_____________________________________________________________________________________
_____________________________________________________________________________________
_____________________________________________________________________________________
_____________________________________________________________________________________
_____________________________________________________________________________________
_____________________________________________________________________________________
_____________________________________________________________________________________
_____________________________________________________________________________________
_____________________________________________________________________________________
_____________________________________________________________________________________
_____________________________________________________________________________________
_____________________________________________________________________________________
122
2. Examine the table showing interest rate movements in Australia between Jan 1990
and May 2010 and complete the activities which follow.
Interest Rate Decisions  ‐  Changing the CASH RATE     Monetary policy decisions are expressed in terms of a target for the cash rate, which is the
overnight money market interest rate. A media release is issued at 2.30 pm after each
ReserveBank Board meeting, with the Board's decision taking effect the following day.
.
Effective
Date
Change in
cash rate
Percentage
points
New cash rate
target
Per cent
5 May 2010
7 Apr 2010
3 Mar 2010
2 Dec 2009
4 Nov 2009
7 Oct 2009
8 Apr 2009
4 Feb 2009
3 Dec 2008
5 Nov 2008
8 Oct 2008
3 Sep 2008
5 Mar 2008
6 Feb 2008
7 Nov 2007
8 Aug 2007
8 Nov 2006
2 Aug 2006
3 May 2006
2 Mar 2005
3 Dec 2003
5 Nov 2003
5 June 2002
8 May 2002
5 Dec 2001
3 Oct 2001
5 Sep 2001
4 Apr 2001
7 Mar 2001
7 Feb 2001
2 Aug 2000
+0.25
+0.25
+0.25
+0.25
+0.25
+0.25
-0.25
-1.00
-1.00
-0.75
-1.00
-0.25
+0.25
+0.25
+0.25
+0.25
+0.25
+0.25
+0.25
+0.25
+0.25
+0.25
+0.25
+0.25
-0.25
-0.25
-0.25
-0.50
-0.25
-0.50
+0.25
4.50
4.25
4.00
3.75
3.50
3.25
3.00
3.25
4.25
5.25
6.00
7.00
7.25
7.00
6.75
6.50
6.25
6.00
5.75
5.50
5.25
5.00
4.75
4.50
4.25
4.50
4.75
5.00
5.50
5.75
6.25
Effective
Date
3 May 2000
5 Apr 2000
2 Feb 2000
3 Nov 1999
2 Dec 1998
30 Jul 1997
23 May 1997
11 Dec 1996
6 Nov 1996
31 Jul 1996
14 Dec 1994
24 Oct 1994
17 Aug 1994
30 Jul 1993
23 Mar 1993
8 Jul 1992
6 May 1992
8 Jan 1992
6 Nov 1991
3 Sep 1991
16 May 1991
4 Apr 1991
18 Dec 1990
15 Oct 1990
2 Aug 1990
4 Apr 1990
15 Feb 1990
23 Jan 1990
Change in
cash rate
Percentage
points
+0.25
+0.25
+0.50
+0.25
-0.25
-0.50
-0.50
-0.50
-0.50
-0.50
+1.00
+1.00
+0.75
-0.50
-0.50
-0.75
-1.00
-1.00
-1.00
-1.00
-1.00
-0.50
-1.00
-1.00
-1.00
-1.00 to -1.50
-0.50
-0.50 to -1.00
New cash rate
target
Per cent
6.00
5.75
5.50
5.00
4.75
5.00
5.50
6.00
6.50
7.00
7.50
6.50
5.50
4.75
5.25
5.75
6.50
7.50
8.50
9.50
10.50
11.50
12.00
13.00
14.00
15.00 to 15.50
16.50 to 17.00
17.00 to 17.50
123
MONETARY POLICY CHECKLIST :
What the RBA observes when deciding on its MP position
Overseas events - inflation and r levels, especially in the USA.
Exchange rate - if $A falls too low it may cause M prices to rise - could cause
inflation.
Wages growth - wants to keep W growth < 4.5% otherwise could в†’ inflation. Also
wants W↑ related to productivity.
Housing finance growth & building approvals - indicator of strength of AD.
Consumption - motor vehicle and retail sales are important indicators of the
strength of household spending which is important to inflation. Sentiment indicators
are important too.
BOP - especially the CAD - if it is over 5.5% of GDP it maybe a cause for concern.
Inflation - wants to keep the CPI between 2-3% annum.
Fiscal Policy - wants to see growing surpluses as growth continues.
Business Investment - wants to see investment in creating productive capacity and
raising productivity. Business sentiment and conditions indicators are important too.
a) Suggest reasons for the cuts in the cash rate between 1990 – 1993 early 2009.
_____________________________________________________________________________________
_____________________________________________________________________________________
_____________________________________________________________________________________
b) Changes in interest rates are mostly less than 1%. Why?
_____________________________________________________________________________________
_____________________________________________________________________________________
_____________________________________________________________________________________
____________________________________________________________________________________
_____________________________________________________________________________________
c) Look at the progress of MP changes over the period in the table. Is there a link
between the path of the cash rate and the business cycle? Explain.
_____________________________________________________________________________________
_____________________________________________________________________________________
_____________________________________________________________________________________
_____________________________________________________________________________________
_____________________________________________________________________________________
_____________________________________________________________________________________
124
3. Read the following article extract from the AFR, 8-11-99.
How the rate rise will work by Stephen Koukoulas
The Reserve Bank of Australia’s raising of the
cash rate from 4.75 per cent to 5 per cent last
week is aimed at keeping annual inflation at
between 2 and 3 per cent.
The banks, as the mechanism for transmitting
the interest-rate adjustment, have been quick to
pass on the rise to variable mortgage rates and
business loan rates.
For this, the RBA and the Government must be
pleased as the banks’ prompt action speeds up
the transmission from the official policy change
to its impact on the real economy.
How will an increase in the cash rate help the
RBA to achieve its inflation objective?
There are two main drivers of the link between
higher interest rates and, eventually, lower
inflation than would otherwise be the case.
Importantly, higher interest rates increase the
cost of borrowing for those with variable interestrate facilities.
As the cost of servicing a loan of a given size
increases with a higher interest rate, demand
elsewhere in the economy will be reduced. This
will be particularly so if the growth in real
incomes is not strong enough to cover the higher
debt servicing costs. ...
Borrowers must therefore limit or stop spending
in one part of the economy to cover the higher
interest cost imposed by the RBA. As spending
elsewhere decreases, the ability of corporations to
increase selling prices diminishes.
The other effect of higher interest rates is that it
encourages savings. In broad terms, as interest
rates approach zero, the incentive to save is not
strong.
Conversely, as interest rates rise, the inclination
of people - householders and corporations – will
be to save in order to receive the higher, almost
risk-free return from the higher interest rate. This
encourages money to move away from
consumption and investment, slowing the rate of
economic growth and making it difficult for prices
- and hence inflation - to accelerate too rapidly.
So will last week’s 25 basis point increase in
rates be enough to limit inflation pressures? Not
likely. ...
When the impact on household incomes of the
massive income tax cuts from July next year
reach consumers, demand will be boosted and
any impact from last week’s interest rate rise will
be swamped.
Given the resilience of consumer spending, a
slowly improving outlook for business investment
- so far the only weak part of the economy
- and the impetus for growth from the external
environment getting stronger by the day, the
balance of probabilities suggests that interest
rates will need to rise by about two percentage
points over the next 12 to 18 months. ...
i) Explain how the role of banks is important in transmitting monetary policy changes
through the economy.
_____________________________________________________________________________________
_____________________________________________________________________________________
_____________________________________________________________________________________
_____________________________________________________________________________________
_____________________________________________________________________________________
_____________________________________________________________________________________
ii) Explain in your own words how a rise in interest rates will reduce aggregate
demand.
_____________________________________________________________________________________
_____________________________________________________________________________________
_____________________________________________________________________________________
125
4. Study the transmission mechanism below and write in full essay form how the
transmission mechanism works to bring about a change in the real economy when the
RBA changes its monetary policy setting.
Monetary Policy Transmission Mechanism
2
1
3
Banks change
rates on loans &
deposits
RBA changes
cash rate
6
Cost of borrowing
& return to saving
change
5
AD changes в†’ inventories changes в†’ O,
UE, Y О” change в†’ GDP changes as the
economy moves to a new equilibrium point
Total spending
4
Consumption &
investment change
Borrowing and
saving change
Total spending
AD1
AD2
AD2
AD1
When the cash
rate rises
Y/GDP
Y/GDP
Y2
Y1
When the cash
rate falls
Y1
Y2
_____________________________________________________________________________________
_____________________________________________________________________________________
_____________________________________________________________________________________
_____________________________________________________________________________________
_____________________________________________________________________________________
____________________________________________________________________________________
_____________________________________________________________________________________
_____________________________________________________________________________________
_____________________________________________________________________________________
_____________________________________________________________________________________
_____________________________________________________________________________________
_____________________________________________________________________________________
_____________________________________________________________________________________
126
_____________________________________________________________________________________
_____________________________________________________________________________________
_____________________________________________________________________________________
_____________________________________________________________________________________
_____________________________________________________________________________________
____________________________________________________________________________________
_____________________________________________________________________________________
_____________________________________________________________________________________
_____________________________________________________________________________________
_____________________________________________________________________________________
_____________________________________________________________________________________
_____________________________________________________________________________________
_____________________________________________________________________________________
_____________________________________________________________________________________
_____________________________________________________________________________________
_____________________________________________________________________________________
_____________________________________________________________________________________
_____________________________________________________________________________________
____________________________________________________________________________________
_____________________________________________________________________________________
_____________________________________________________________________________________
_____________________________________________________________________________________
_____________________________________________________________________________________
_____________________________________________________________________________________
_____________________________________________________________________________________
_____________________________________________________________________________________
127
5. Research Activity: Describe the strengths and weaknesses of MP using the chart
below (use you text book as a reference).
STRENGTHS
WEAKNESSES
6. Complete the following multiple choice questions.
i) When the Reserve Bank enters the market to buy government securities, it probably
intends to
a) increase the liquidity of the market.
b) push up interest rates in the economy.
c) decrease funding for a Federal government budget deficit.
d) reduce the money supply.
ii) In the open bond market a fall in interest rates will mean the market value of
previously issued government bonds will
a) depend on what share prices do.
b) remain unchanged.
c) rise.
d) fall.
128
iii) The transmission mechanism for MP refers to the process by which a change in
the cash rate by the RBA is transmitted throughout the whole economy and impacts
on the decisions of households and firms to spend and invest. The speed of this
process will be improved by:
i) spread of and improvements in information technology
ii) transparency of RBA decision making
iii) reduction of RBA independence
iv) reduction of discretionary power of banks to alter interest rates
a) i) & ii)
b) ii) & iv)
c) ii) & iii)
d) iii) & iv)
iv) If the Reserve Bank implements expansionist market operations then it will
a) encourage banks to increase their lending activities.
b) borrow from overseas.
c) sell government securities on the open market.
d) buy short term securities from banks.
v) If the Reserve Bank sells Commonwealth Government securities to the private sector
then the quantity of �cash’ in the market will
a) decrease and short term interest rates will fall.
b) decrease and short term interest rates will rise.
c) increase and short term interest rates will rise.
d) increase and short term interest rates will fall.
vi) The main difference between monetary policy and fiscal policy is that
a) monetary policy is action influencing the cost and supply of loanable funds
whereas fiscal policy is taxing and spending by the government.
b) monetary policy deals with money matters whereas fiscal policy deals with
budgetary matters.
c) monetary policy is determined by the RBA whereas fiscal policy is determined
by the government (Treasury).
d) monetary policy affects the exchange rate whereas fiscal policy concerns
taxation rates.
vii) The aim of the RBA’s daily market operations is to make sure
a) that banks have enough funds for their day-to-day interbank requirements.
b) the RBA can regulate bank lending.
c) ensure customers don’t stop saving and borrowing from banks.
d) the RBA can be �the lender of last resort’.
viii) The main weakness of monetary policy is its
a) lack of flexibility due to the need to receive specific approval by Parliament.
b) tendency to become highly political and subject to constant adjustment to
meet the demands of interest groups.
c) tendency to encounter time lags which slow its rate of operation.
d) inability to have much effect on the level of activity during periods of sustained
economic boom.
ix) If the RBA were to increase bank ES funds the most likely effect would be
a) a decrease in interest rates.
b) a decrease in the price of government bonds.
c) a decrease in the demand for money.
d) a decrease in investment spending.
129
x) Which of the following pairs of economic indicators is the RBA likely to least take
account of when deciding on MP?
a) overseas interest rates and motor vehicle registrations.
b) consumption spending and housing loan approvals.
c) employment and wages growth.
d) inflation and the value of the Australian dollar.
7. Read the statement by the RBA governor on the change in MP.
MEDIA RELEASE
Date: 7 April 2009
At its meeting today, the Board decided to lower the cash rate by 25 basis points to 3.0 per cent,
effective 8 April 2009.
Recent information from abroad indicates that the contraction in the global economy continued
during the first few months of this year, and most assessments of the near-term outlook have
been further marked down. Considerable economic policy stimulus is in train in most countries,
the full effects of which are not yet discernible, but which should help contain the downturn over
the rest of the year. There are tentative signs of stabilisation in several countries, including
China, though it is too early yet to judge how durable these will prove to be.
Conditions in global financial markets have continued to improve gradually, helped by progress
towards a resolution of banking system difficulties in the United States and other major
countries. Sentiment remains fragile, however, and the contraction in economic activity is
affecting asset quality of financial institutions.
The Australian economy is contracting, though by less than those of its trading partners.
Capacity utilisation has fallen from its peak, and will decline further over the rest of the year.
With demand for labour weakening, growth in labour costs will probably also fall. Hence
inflation over the medium term is likely to be lower than it has been over the past two years.
Demand for credit is weak overall, though credit for owner-occupied housing is picking up.
There has already been a major change in both monetary and fiscal policy in Australia. Market
and mortgage rates are at very low levels by historical standards and business loan rates are
below recent averages, reducing debt-servicing burdens considerably. Nonetheless, the Board
judged that there was scope for a further modest adjustment to the cash rate. The stance of
monetary policy, together with the substantial fiscal initiatives, will provide significant support
to domestic demand over the period ahead.
a) List the reasons for the fall in the cash rate in dot point form.
_____________________________________________________________________________________
_____________________________________________________________________________________
_____________________________________________________________________________________
_____________________________________________________________________________________
130
_____________________________________________________________________________________
_____________________________________________________________________________________
_____________________________________________________________________________________
_____________________________________________________________________________________
_____________________________________________________________________________________
_____________________________________________________________________________________
b) What factors may have acted to reduce inflationary pressures in the economy.
_____________________________________________________________________________________
_____________________________________________________________________________________
_____________________________________________________________________________________
_____________________________________________________________________________________
_____________________________________________________________________________________
_____________________________________________________________________________________
_____________________________________________________________________________________
_____________________________________________________________________________________
c) “At its meeting today, the Board decided to lower the cash rate by 25 basis points to
3.0 per cent, effective 8 April 2009.” Explain how the RBA will achieve this.
_____________________________________________________________________________________
_____________________________________________________________________________________
_____________________________________________________________________________________
_____________________________________________________________________________________
_____________________________________________________________________________________
_____________________________________________________________________________________
_____________________________________________________________________________________
_____________________________________________________________________________________
_____________________________________________________________________________________
131
IN SUMMARY: THE RBA, THE INTERBANK PAYMENTS SYSTEM AND MONETARY
POLICY
Money flows back and forth between the RBA and banks.
When MP is tightened: Flows to the RBA from banks as payment for CGS > flows
from the RBA to the banks when CGS are repurchased by the RBA. Level of funds in
ESAs ↓ (liquidity falls) → r rise.
When MP is loosened: flows to the RBA from banks as payment for CGS < flows from
RBA to banks as CGS are repurchased. Level of funds in ESAs ↑ (liquidity rises) → r
fall.
ESAs – all banks and some other major financial institutions have these accounts with
the RBA which is banker to the banks and lender of last resort. These accounts must
have an adequate level of funds so that the banks can conduct their daily interbank
payments activities (settling cheques, etc.)
Money flows between the banks via their Exchange Settlement Accounts (ESAs) on a
daily basis to meet their obligations to each other.
Reserve Bank of Australia
Financial
Institution A
Financial
Institution B
Financial
Institution C
Financial
Institution D
Financial
Institution E
The RBA sets the overnight cash rate which banks must charge each other if they
need to borrow to cover their daily interbank payments. The RBA also uses the ESAs
to manipulate the availability of credit in the financial system and therefore influence
interest rates throughout the economy. The RBA does this by altering the level of
funds in the ESAs through its open market operations (OMO), ie. its buying and
selling of short term government securities. These are risk free securities which are
issued by the RBA. Banks bid for them daily. When they buy them the money goes to
the RBA and is not available for the banks to use in their normal business of lending
to the public. When the RBA buys the securities back on the date of maturity, the
money goes back into the ESAs. The banks want to maintain a level of funds in their
ESAs which meets their daily interbank needs and no more than that because it can
be put to better use out in the economy. However they are not allowed to go into
overdraft in their ESAs so maintaining the right level of liquidity in their ESAs makes
the banks very sensitive to RBA actions. The yield on these securities is set by the
RBA and is the same as the overnight cash rate. Changing this rate through OMO
(open market operations) is known as Monetary Policy.
132
7.
Microeconomic Reform
I
Objectives. GOVERNMENT ECONOMIC POLICIES
You should be able to:
• explain the concept of microeconomic reform policy
• explain the concept of productivity
• outline common measures of productivity
• explain the concept of economic efficiency
• discuss examples of microeconomic reform e.g. labour market reform, deregulation
of financial markets, taxation reform, reducing levels of protection
• explain the relationship between microeconomic reform and structural change
• demonstrate and explain the impact of microeconomic reform on aggregate supply
• evaluate current microeconomic reform policy.
Microeconomic Reform
Economies undergo change over time. Old industries are transformed or disappear
and are replaced by new industries. This is a natural process which is uneven in its
speed and in the range and number of industries affected. This historical
structural change process can be facilitated through microeconomic reform.
Microeconomic reform refers to policies introduced by government (State and Federal)
which aim to improve the operation of individual segments of the economy ie.
markets, sectors, industries + firms, both public and private, for the purpose of
improving the overall efficiency and performance of the macroeconomy.
Microeconomic reform (MER) improves competition and thus efficiency This results
in better resource allocation and more output from existing inputs (increased factor
productivity). This lowers unit production costs which makes possible lower
consumer prices and improved consumer welfare.
MER improves product and factor market responsiveness to market signals
allowing greater economic flexibility. This improves international competitiveness
leading to stronger economic growth, lower UE and higher real incomes.
MER is part of a global trend to improve economic performance by:
• removing unnecessary regulation and government intervention which inhibit the
efficient operation of markets.
• achieving improved resource allocation in response to price signals.
• encouraging competition which will reduce production costs.
The importance of MER is highlighted in the following extract from the Autumn
2000 edition of Economic Roundup (Commonwealth Treasury):
“Increased competition and more dynamic markets have contributed to lifting the
medium-term potential growth rate of the Australian economy to around 3.5 to 4
per cent per annum. This means that the rate of growth that the Australian
economy can sustain without producing significant inflationary pressures is now
above the average rate of growth achieved during the past three decades.” (P35)
Three Types of efficiency are achieved by MER:
a) Technical efficiency: producing output at the least cost combination of
resources (achieving the long run minimum average cost of production) through
competition в†’ raises productivity of factors of production and lowers unit
133
production costs. This is achieved through structural reform at the firm and
industry level.
b) Allocative efficiency: resources allocated to their most valued uses competition in factor + product markets в†’ more efficient resource use. Requires
removal of artificial barriers to efficient operation of markets so that resource
supply and demand is more responsive to price signals. Examples include removing
subsidies, tariffs, quotas, discriminatory taxes such as the former wholesale sales
tax, artificial barriers to entry (telecommunications, airlines) which promotes
competition and therefore efficiency. Price flexibility improves resource allocation.
c) Dynamic efficiency: this refers to firms adjusting to the changing patterns of
consumer demand + technological change в†’ quick response from competitive firms
in producing new products + adopting new methods of production. Uncompetitive
or less competitive firms get left behind and don’t survive without govt support
(subsidies). Govt should ensure a competitive environment exists and provide
quality infrastructure and incentives for research and development. Competition в†’
incentives for firms to keep up or get ahead of rivals in the creation of new products
and production techniques and restructure work and management practices в†’
productivity ↑.
STUDENT ACTIVITY 17.1STUDENT ACTIVITY 17.1
STUDENT ACTIVITY 7.1
Read the following extract from Economic Roundup, Autumn 2000 and complete
the question below.
“The Australian economy is reaping the rewards
of a broad agenda of structural reforms. A common
goal of many of these reforms is increased
competition and improved market dynamism. As a
consequence, competition in the Australian
economy is now much stronger than it has been at
any time in the post-war period.
One characteristic of a competitive market is
that purchasers can readily choose between a range
of sellers to find the best combination of quality
and price. In such a market, the most successful
sellers are those who best judge market conditions
when setting their prices.
Those who set excessive prices are forced to pull
their prices into line or risk losing business.
Competition drives dynamism because the speed of
change in offering alternatives to the customer is of
fundamental importance.
The competitive nature of markets for most
goods and services in Australia today means that
vigorous, dynamic competition is now the driving
force behind market prices.
Competitive markets have a range of other
benefits. On the supply side, producers wishing to
increase their profitability are forced to focus on
alternatives to charging higher prices. For
example, they may seek to reduce their costs, find
more efficient innovative production methods or
pursue new markets. Australian businesses are
proving that they can respond to competition by
continuously improving their performance in all
these ways.
Demand side factors have also added to
competitive pressures in Australian markets. For
example, firms that have improved their
marketing techniques have made it easier for
consumers to compare quality and price, thus
making markets even more competitive.
Increased consumer awareness and �shopping
around’ have played an important part in the
transformation of the Australian economy to one
characterised by highly competitive markets. This
trend will continue as new technologies, such as
the internet and e-commerce, make consumers
better informed and further reduce the effective
distance between consumers and potential
suppliers.”
134
Identify in your own words, how competitive markets are beneficial.
__________________________________________________________________________________
__________________________________________________________________________________
__________________________________________________________________________________
__________________________________________________________________________________
__________________________________________________________________________________
__________________________________________________________________________________
__________________________________________________________________________________
__________________________________________________________________________________
PRODUCTIVITY
The level of economic growth is determined by the quantity and quality of available
resources. More output requires:
a) an increase in the quantity of inputs and/or
b) an increase in the quality of inputs (productivity)
The main resources are physical capital (equipment, buildings, infrastructure),
human capital (skills and knowledge of the workforce) and technology (new
methods, products and the science embedded in capital)
Rising living standards can only come from productivity growth. Productivity
improvements result from:
• new technology
• better methods of using resources (improved management)
• training and education
• removing regulatory barriers to trade and commerce so markets can operate more
efficiently (MER)
Productivity growth means producing the same amount of output with fewer
resources or alternatively, producing more output with the same amount of inputs.
It may result in job losses in the short term but in the longer term more jobs are
created as a result of better resource allocation, innovation and change. Higher
productivity lowers production costs which get passed on as lower consumer
prices, as higher wages for workers, or higher returns to firms and shareholders
(higher profits and/or dividends).
Higher wages and lower consumer prices result in higher demand for goods and
services generally which results in the creation of new jobs.
MER → productivity ↑→ jobs growth > job losses
135
Productivity ↑ → output per unit of input ↑ → unit production cost ↓ →
benefits shared between:
• consumers (lower
prices)
• workers (higher
wages)
• producers (higher
profits)
Factors affecting Productivity
• Level of skill and knowledge of workforce.
• Willingness to adopt new ideas and methods.
• Having an open and competitive economy.
• Minimising rules and regulations which restrict the operation of markets
and hinder change.
• Size of the market – large markets encourage specialisation and productivity
growth. Trade liberalisation grows markets.
• Quality of public and private infrastructure – transport routes,
communications, education, health system, power and water systems.
• Capital deepening – this means increasing the quantity and quality of
capital per worker. This requires investment.
Price level
MER increases the
productive potential of the
economy – Yfe1 shifts to
Yfe2. This means more
output at lower prices
ceteris paribus). In other
words real income rises.
P1
P2
AD
Y/GDP
Yfe1
Yfe2
Price level
AS1
AS2
By increasing the potential
of the economy, AD can
increase along with the
output potential of the
economy without causing
an inflation problem.
P2
P1
AD2
AD1
Yfe1
Y/GDP
Yfe2
136
Main trends in Australia's productivity performance
Official Australian Bureau of Statistics measures of Australia's productivity performance are available from the
mid-1960s. These show that there have been three phases of productivity growth:
•
•
•
relatively rapid productivity growth in the 1960s through to the mid-1970s, corresponding to the
tail end of Australia's rapid development phase after the Second World War;
very slow productivity growth from the mid-1970s to the end of the 1980s; and
a return to more rapid productivity growth in the 1990s, accelerating to a record underlying rate
from the mid-1990s (labour productivity growth of 3.1 per cent a year and multifactor productivity
growth of 1.7 per cent a year from 1993-94 to 1999-00).
Figure 1: Australia's productivity growth (Percentage average annual rate of growth)
Australia's productivity performance compared with other high-income countries was relatively poor over a number
of decades, up until the 1990s. However, Australia was only one of a few high-income countries to show an
acceleration in productivity growth in the 1990s. (Source: http://www.pc.gov.au/research/productivity/primer/trends)
Multifactor productivity measures reflect output per unit of some combined set of inputs. A change in multifactor
productivity reflects the change in output that cannot be accounted for by the change in combined inputs. As a result,
multifactor productivity measures reflect the joint effects of many factors including new technologies, economies of
scale, managerial skill, and changes in the organization of production.
Whereas labor productivity measures the output per unit of labor input, multifactor productivity looks at a combination
of production inputs (or factors): labor, materials, and capital. In theory, it’s a more comprehensive measure than
labor productivity, but it’s also more difficult to calculate. (Source: http://en.wikipedia.org/wiki/Multifactor_productivity)
A nation's productivity is the volume of goods and services it produces (its output) for a given volume of inputs
(such as labour and capital). A nation that achieves productivity growth produces more goods and services from
its labour, capital, land, energy and other resources. Much, but not all, of Australia's output growth can be
accounted for by increases in the inputs to production. The amount by which output growth exceeds input growth
is the productivity improvement. Productivity growth can generate higher income and benefits might also accrue
in the form of lower consumer prices.
Productivity can be measured in a variety of ways. The most comprehensive Australian measure available at
present is multifactor productivity for the market sector. Multifactor productivity represents that part of the growth
in output that cannot be explained by growth in labour and capital inputs. Examples of multifactor productivity
growth include improved production techniques, better management practices, and organisational change.
Technological change, such as increased computing power, is embodied in the asset, and as such is captured in
the capital inputs. (Source: ABS 1383.0.55.001)
STUDENT ACTIVITY 7.2
Explain the importance of productivity to economic growth and living standards.
Answer this question in your file.
137
PRODUCTION FUNCTION – a model of productivity
Y/GDP
O3
Production Function 2
MER increases productivity which
is reflected in the shift in the PF
upward
Output increase due to
productivity growth
Production Function 1
O2
Output increase due to
increase in inputs
O1
Movement along PFrepresents
increasing production using
existing skills and technology.
Decreasing gradient reflects
diminishing returns to inputs.
Inputs eg labour
I1
I2
When inputs are increased, eg more labour and/or capital is employed (I1 to I2),
output rises from O1 to O2.
When productivity increases given input level I2, output rises further to O3.
EXAMPLES OF MICROECONOMIC REFORMS
The following are examples of economic reforms which have been implemented. The
goal is to improve competition and create more efficient and dynamic markets. The
results have been mixed.
a) Tax reform: In 2000 the tax system saw the replacement of a range of narrowly
based, inefficient indirect taxes with a single, uniform, broadly based goods and
services tax (the GST). This will achieve greater efficiency in the allocation of
resources across the economy by eliminating the discriminatory and distorting
effects of multiple taxes at different rates on a narrow range of economic activities.
Other changes have improved compliance (getting people to pay the taxes they
should pay) which improves the revenue raising capacity of the tax system making
reductions to tax rates possible which are good for growth.
b) Tariff reductions: this is the most outstanding example of reform - 1988 Industry
Statement by Federal government advocated reducing tariff protection + import
quotas. Tariff reduction program began in 1991 в†’ has resulted in a shift of
resources out of protected manufacturing industries eg. motor vehicles, clothing,
footwear, into new and improved manufacturing industries and the rapidly growing
service sector. There was intense debate on tariff reductions between those who
receive tariff protection and its critics but there is no doubt consumers have
benefited from the increased competition in the form of lower prices and more
choice.
138
c) Competition policy:
National Competition Policy is aimed at:
i) reducing the anti-competitive conduct of firms. (role of ACCC)
ii) reducing regulations which restrict competition without good reason.
iii) the reform of public monopolies to expose them to more competition eg
Telstra.
iv) creating more competition between public and private sectors by removing
public sector privilege в†’ lower infrastructure costs.
d) Transport:
• coastal shipping & port authority (waterfront) reforms → increased productivity →
lower prices.
• aviation - deregulated → competition → lower air fares.
e) Telecommunications: Telstra’s monopoly ended in 1997 and since then the
number of firms in the industry (licensed carriers and providers of telephone and
internet services) has grown greatly. This growth in competition has produced
greater efficiency which has lowered costs & prices and increased consumer choice.
f) Financial deregulation: в†’ competition by opening up the market to foreign
financial institutions and reducing controls on the operation of banks в†’ greater
range of financial services to consumers at lower cost. Reforms have facilitated the
flow of financial resources for investment into new and expanding businesses and
increased the range of financial services available to consumers.
g) Privatisation and corporatisation of government owned businesses: eg.
Commonwealth Bank and Qantas - exposes former public enterprises to
competitive forces → more market focussed → efficiency ↑ and lower real prices for
consumers. An example is the electricity industry where the generation,
transmission and distribution functions of former public monopolies have been
divided into separate businesses, some privatised others publicly owned. A National
Electricity Market has been established in Queensland, NSW, ACT, Victoria and
South Australia to foster inter-state trade and competition in the electricity
industry.
h) Labour market reform: significant reforms have been implemented since the late
1980s. Reforms before 1996 included the following measures:
• Award restructuring
• Multi-skilling
• Productivity-based wage increases
• Enterprise bargaining.
VOCAB: Enterprise Bargaining - decentralising the wage determination process to the
enterprise level, where employers and employees bargain directly over industrial matters such as
wages and conditions of work. The process need not involve a third party. They focus on
productivity based wage increases and usually cover large numbers of workers.
Workplace Agreements - written agreements between employers and individual employees. They
do not involve third parties. They focus on wage increases based on productivity improvements
and tradeoffs.
Like all MERs, the purpose of the above reforms was to improve the economy’s
efficiency and competitiveness by achieving greater flexibility in the operation of the
labour market. This would help to reduce inflationary pressures and thus boost
Australia’s international competitiveness. Diagrammatically this effect could be
139
illustrated with a shift to the right in the AS function in the AD/AS model
illustrating higher output at lower prices.
Further reform of the labour market was to be achieved by deregulating and
decentralising workplace relations and wage negotiations. This inevitably meant
reducing the power and role of the Australian Industrial Relations Commission
(AIRC) and trade unions in the process of determining wages and working
conditions. This was the objective of the Workplace Relations Act of 1996 (WRA)
and the recent Workplace Relations Amendment Act of 2005 (Work Choices).
STUDENT ACTIVITY 7.3
1. Write a sentence on each of the following topics:
a) Microeconomic reform:
__________________________________________________________________________________
__________________________________________________________________________________
__________________________________________________________________________________
b) Competition:
__________________________________________________________________________________
__________________________________________________________________________________
c) Productivity:
__________________________________________________________________________________
__________________________________________________________________________________
__________________________________________________________________________________
d) Privatisation:
__________________________________________________________________________________
__________________________________________________________________________________
__________________________________________________________________________________
e) Financial deregulation:
__________________________________________________________________________________
__________________________________________________________________________________
140
2. Explain in your own words the primary goal of industrial relations reforms since
1996.
__________________________________________________________________________________
__________________________________________________________________________________
__________________________________________________________________________________
__________________________________________________________________________________
__________________________________________________________________________________
__________________________________________________________________________________
__________________________________________________________________________________
3. Read the following article and complete the exercise below it by Katharine
Murphy
Deregulation raises skill levels
Economic reform dating from the mid-80s has created a
sea change in Australian workplaces, with deregulation
prompting a surge in demand for skilled workers, according
to a new study by the Productivity Commission.
The study, released today, concludes that microeconomic
reform led to increased take-up of new technology in
Australia, which in turn created a demand for highly skilled
workers across a number
of industries.
Key reforms creating the demand shift in the Australian
labour market include the 1983 decision to float the dollar,
tariff reductions, competition and government-sector reform,
industrial relations changes and the introduction of
government incentives for research and development.
Australia’s focus on developing world-competitive exports
has also been a factor fuelling the demand for skilled
employees, the Productivity Commission finding a positive
association between exports and the demand for highly
trained personnel.
“For the industries where information is available on
software assets, it is found that the more computer intensive
an industry, the more likely it is on average to employ highskilled workers,” the report says.
“When trade variables are included, there is a consistent and
positive association between exports and skilled workers.”
Against the backdrop of anti-globalisation protests at this
week’s World Economic Forum, the study also contends that
expanding import competition has not resulted in the
widespread loss of low-skilled jobs from the economy.
It argues that while opponents of globalisation says the
trend towards high-skilled workers reflects Australia’s and
other industrialised nations’ expanding trade with low-wage
countries, new technology is actually playing a pivotal and
understated role in shaping the new patterns of demand.
“Changing employment patterns are more closely
associated with a pull toward skilled workers rather than a
push away from lower-skilled workers,” it says.
The study also claims that while economic reform
has created a growing dispersion in earnings between
high-skilled and low-skilled workers, the gap is
relatively modest, with the differential rising only 4 per cent
between 1986 and 1998.
(Australian Financial Review, 14th Sept 2000)
With statements a) to e), state whether you agree or disagree and explain your
position.
a) Microeconomic reform has resulted in a serious deterioration in income
distribution in Australia.
__________________________________________________________________________________
141
__________________________________________________________________________________
b) Economic reform has resulted in a greater take-up of new technology.
__________________________________________________________________________________
__________________________________________________________________________________
c) The labour force overall has improved its level of productivity since the mid
1980s.
__________________________________________________________________________________
__________________________________________________________________________________
d) Structural change in the economy has impacted on the nature of the labour
force.
__________________________________________________________________________________
__________________________________________________________________________________
e) Microeconomic reform has resulted in a massive decline in low-skilled jobs.
__________________________________________________________________________________
__________________________________________________________________________________
f) In your own words explain the relationship between the labour force, economic
reform, technology and skill levels.
__________________________________________________________________________________
__________________________________________________________________________________
__________________________________________________________________________________
__________________________________________________________________________________
__________________________________________________________________________________
__________________________________________________________________________________
__________________________________________________________________________________
__________________________________________________________________________________
__________________________________________________________________________________
__________________________________________________________________________________
__________________________________________________________________________________
142
__________________________________________________________________________________
4. Read the article provided from the AFR 21-6-00 below and answer the following
questions.
We can’t afford reform retreat
For all those competition sceptics let me be clear
- we must continue to remove barriers to
competition if Australians want lower prices, better
goods and services, job growth and an improved
ability to compete in world markets.
On an economy-wide basis, recent IMF and
OECD reports have linked Australia’s recent
economic strength and resilence - including
sustained growth and declining unemployment with structural reform policies like National
Competition Policy. Australia’s annual productivity
growth has averaged 2.4 per cent over the last six
years, a rate matched only by Norway among the
world’s developed nations.
Increased competition in specific sectors is
bringing clear benefits for consumers and
businesses across Australia. For example the
introduction of competition into
telecommunications has resulted in substantial
price falls, with an expansion in the range of new
products and services offered and improved
consumer access to those services.
Reductions in business costs have then flowed
on to assist our entire community. However, we are
by no means alone. Other countries are getting in
on the act, using greater competition to strengthen
their economy and improve living standards. Not
surprisingly, historically pro-competitive countries
such as the United States and United Kingdom
have achieved substantial community benefits
through reducing market restrictions and
regulations. Perhaps more telling is the fact that
countries such as the Netherlands, Spain, South
Korea and Japan, previously heavily reliant on
market regulation, are also increasing their
emphasis on competition and market forces.
by Graeme Samuel
In the European Union, studies have confirmed
gains of 3-7 per cent of GDP as a result of the
Single Market Program which enhances
competition throughout the EU by establishing the
free movement of labour, capital, goods and
services. ...
While the benefits of increased competition are
widespread, governments need to manage change
to ensure that a range of labour-market and
welfare initiatives minimise any short to mediumterm disadvantage to a specific sector or area. In
particular, reforms tend to encounter difficulty
where the costs are borne by a relatively small, but
often vocal, group while the benefits are spread
among the greater community. ...
If public support for reform is to be maintained,
governments need to ensure that the benefits of
increased competition are widely enjoyed. The role
of the consumer is particularly important in reform
implementation. Competition reform ultimately has
the consumer as a major beneficiary, through
driving down prices, increasing innovation and
responsiveness to
customer needs. ...
Undoubtedly competition policy in Australia is
part of a far wider trend by nations towards greater
reliance on competition and market forces.
Traditionally pro-competition as well as
government interventionist nations are deriving
significant social and economic benefits from
competition reform. Australia cannot afford to
ignore international trends nor attempt to �turn
back the clock’, because of the risk that future
benefits for the Australian community will be lost.
a) OECD and IMF reports claim Australia’s economy has improved due to
structural reform (MER). What evidence or criteria do they point to?
__________________________________________________________________________________
__________________________________________________________________________________
__________________________________________________________________________________
__________________________________________________________________________________
b) Australia is not alone in terms of economic reform. Other countries “are getting
in on the act” and catching up. What are the implications for Australia?
__________________________________________________________________________________
c) The main problem with structural change is that the burden of the reform
process is usually borne by a small, vocal and highly visible group (eg. textile
143
workers or dairy farmers) whereas benefits are less visible and dispersed across the
whole community.
i) What is the usual result of this?
__________________________________________________________________________________
ii) What needs to be done by government to smooth the path of reform?
__________________________________________________________________________________
__________________________________________________________________________________
__________________________________________________________________________________
5. Read the following article from the Australian Financial Review, 10 November
2005. Identify the main points the author makes to support his view that
microeconomic reform is not responsible for a productivity-based rise in economic
growth over the past decade and a half.
The surge we didn’t have
One of the during myths of the Australian public-policy
debate is the claim that the micro-economic reforms of the
1980s and 1990s have generated a surge of productivity
growth. This claim is constantly used as a basis for
suggesting that, whatever the problem, the answer is that
more reform is needed.
Claims of a productivity surge were fi rst generated in
1998, when the Australian Bureau of Statistics published
experimental estimates of multifactor productivity (MFP)
growth (the term �multifactor’ refers to the fact that capital as
well as labour inputs are taken into account) showing a
stunning productivity growth rate of 2.4 per cent for the
period after 1993-94, about double the historical average.
Not surprisingly, these estimates were greeted with
enthusiasm. Commentators claimed micro-economic reform
was transforming Australia into a �new economy’.
The initial ABS estimates were subsequently revised
downward to yield a productivity growth rate of 1.8 per cent
for the period 1993-94 to 1998-99, compared to the historical
average of 1.2 per cent.
This increase could have been explained as a once-off
cyclical recovery from the very low productivity growth rates
of the preceding years, encompassing the “recession we had
to have”. However, such a prosaic explanation was rejected,
particularly by the Productivity Commission, which staked its
case for micro-economic reform on the new economy thesis.
Another possible explanation was that the increase in
measured productivity reflected the increase in work pressure
and work intensity that was obvious to all in the mid-1990s.
This was also dismissed.
Although productivity growth slowed from 1998-99
onwards, the decline was explained away as the result of a
variety of temporary factors, from drought to the disruptions
associated with the introduction of the GST. These would, it
was claimed, work themselves out over the course of the
by John Quiggin
productivity cycle.
The latest national accounts, … should settle the question
once and for all. ABS now identifies the period from 1998-99
to 2003-04 as a complete productivity cycle and reports:
“During the most recent MFP growth cycle (1998-99 to
2003-04), MFP grew annually, on average, by 1.0 per cent
– slightly lower than the long-term average between 1964-65
to 2003-04 of 1.2 per cent.”
The acceleration of productivity growth in the mid-1990s
was not sustained. The results for 2004-05 are even worse.
Productivity actually declined 1.7 percentage points. …
The low point for productivity growth was the period
from 1984-85 to 1993-94, when micro-economic reform was
well under way, and when substantial benefits were already
being claimed. …
If productivity growth generated by micro-economic
reform does not explain the generally strong performance of
the economy over the past decade, what does explain it?
Thanks to a combination of good luck and good management
Australia has not suffered a recession since 1991 (unlike New
Zealand, where monetary policy was bungled at the time of
the Asian crisis). …
In the past couple of years, another factor has come into
play. Thanks to strong demand from China for mineral
exports, our terms of trade have improved dramatically to
levels unparalleled since the commodity boom of the early
1970s. As a result, the value of output per worker has
improved much more than physical productivity. This
favourable shock may or may not persist, but either way it
has nothing to do with micro-economic reform.
Particular instances of micro-economic reform should be
assessed on their merits. The claim that micro-economic
reform is a primary source of growth has been tested
empirically, and shown to be false.
144
LABOUR MARKET REFORM CONTINUED - THE WORKPLACE RELATIONS ACT
OF 1996
This act was passed in the federal parliament at the end of 1996. Its purpose was
to breathe new life into labour market reform by accelerating the decentralisation
process. It aimed to increase labour market responsiveness to structural and
cyclical changes in the economy which have been imposed on Australia by the
reduction of protection and the globalisation of the economy. The focus is on
removing restrictive workplace practices and boosting productivity.
Under the WRA, employers and employees can strike individual agreements or nonunion collective agreements even in workplaces where employees are union
members. Under the new act, collective agreements must be approved by a “valid
majority” of employees. It aims to achieve this by nurturing a labour market which
is governed by negotiation at the enterprise level, not centrally in the AIRC and
which is not constrained by detailed and comprehensive award regulations. Wage
settlements will more commonly occur at the enterprise level and take account of
productivity. The belief is that this will encourage a more efficient allocation of
resources across the economy in the longer term and result in a more competitive
economy.
Some of its main features include:
• It retains Awards but simplifies them by stripping them back to 20 core
conditions or “allowable matters”.
• It introduced Australian Workplace Agreements (AWAs) as an alternative to
enterprise agreements. The act allows individual workplace agreements (AWAs) to
be negotiated between employers and employees but they have to meet a “no
disadvantage” test. This means a worker who enters into a workplace agreement
must not be worse off than he/she would be under the Award covering their
particular job.
• The task of overseeing AWAs is the job of the Employment Advocate, a new
institution in the industrial relations landscape.
• The role of the AIRC is restricted to certifying agreements and administering the
award system.
• Tough new sanctions have been introduced under the Act to combat industrial
action by unions. Unfair dismissal laws have been changed to make it less difficult
for employers to dismiss unsuitable and undesirable workers.
• Unions have lost their monopoly as the workers’ representative in negotiations
with employers over wages and conditions. The Act encourages direct agreementmaking between employers and employees and locks into place the shift to
workplace bargaining which began in the last years of the Accord.
Australia’s labour market has become more flexible. Demographic and social
changes are contributing to the already powerful structural and industrial changes
that are forcing microeconomic reform on the economy. The composition of the
workforce has changed with female participation being the most significant change
over the past two decades. The shift towards more part-time and casual work is
another factor which is being driven by the growth and deregulation of the services
sector. Over this period since the late 1980s, the power of unions has declined as
145
has their membership. Skilled workers who are able to take advantage of new
technology and are more adaptable to new work arrangements, are more highly
paid. Unemployment is overwhelmingly an affliction of those with the lowest levels
of educational achievement. This supply side reform has seen the devolution of
wage setting to the enterprise level as a major goal, the central purpose of this
reform being the more flexible use of labour at the enterprise level and an emphasis
on productivity growth.
Other programs seek to improve the quality of the labour force through changes to
the apprenticeship system, the introduction of the �work for the dole’ scheme and
improving vocational education in secondary schools which will reduce mismatches
between supply and demand in the labour market.
In short these policies → quality of labour ↑→ fewer shortages of skilled labour →
rate of labour cost growth ↓→ rate of inflation slows. However more needs to be
done to educate and train the workforce to the level demanded of a modern
economy at the beginning of the 21st century. Australia needs to match its major
competitors in terms of its commitment of resources to education, training,
innovation and research.
So in summary the WRA divides workers into three categories: Those dependent on
a) Awards: workers who are the least skilled and in the weakest bargaining position
and are unable to negotiate an enterprise agreement. Wage increases tend to be
lower and dependent on the ACTU negotiating �living wage’ increases in the AIRC
on the workers’ behalf. The proportion of the workforce covered by awards has
declined from over 70% before reforms began in the early 1980s to around 20% in
recent times.
b) Certified Agreements (Enterprise Agreements): these are collective agreements
which workers enter into after the enterprise bargaining process with employers
has concluded. Workers are usually represented by a union in their negotiations at
the enterprise or industry level.
c) AWAs: for workers who negotiate on an individual basis without trade union
involvement. AWAs can be negotiated collectively like enterprise agreements but
must be signed individually. They can cover any matters which the bargaining
parties wish to include.
THE WORK CHOICES LEGISLATION 2006
The Work Choices legislation builds on the WRA of 1996. The legislators regard the
existing industrial relations (IR) system as being too complex, despite all the
reforms too date. They believe the new laws will make the system simpler and more
accessible and effective. It is believed that continuing the decentralisation of the IR
system will produce a more flexible labour market.
Some of the main changes Work Choices will implement are (according to
government):
• it will establish the Australian Fair Pay Commission to protect minimum and
award wages – this will further simplify awards by reducing the number of
allowable matters and take over the role of the AIRC in determining wage increases
for workers on awards. This takes the process of wage determination for the lowest
paid out of the adversarial environment of a court setting and puts it into the
146
hands of the Fair Pay Commissioner who will make decisions on the basis of
economic circumstances and research;
• it will simplify the agreement making process at the workplace – a more
streamlined bargaining process;
• it will ensure an ongoing role, for the Australian Industrial Relations Commission
– one confined to dispute resolution;
• it will �better balance’ the unfair dismissal laws – exempt from current laws,
businesses with up to 100 employees; and
• it will introduce a national system of workplace relations – ultimately the
government hopes it will cover up to 85% of Australian workers and replace the
state systems and reduce expensive duplication in the area of industrial relations.
The government claims the reforms will:
• not cut minimum and award classification wages
• not abolish awards
• not remove the right to join a union
• not take away the right to strike
• not outlaw union agreements
• not abolish the AIRC.
The new government elected at the end of 2007 has introduced new labour market
legislation which will abolish Work Choices and replace it with Fair Work Australia
legislation. This will abolish AWAs and apply unfair dismissal laws to all
businesses. It will enhance the role of unions in the negotiation process between
employees and employers.
147
FEDERAL BUDGET 2010‐11  Government Revenue 2010‐2011  Government Expenditure 2010‐2011      Detailed economic forecasts for 2010-11 and 2011-12
В В В В В В В В В В В В Historical budget and net financial worth dataВ В Inflation
Inflation is the sustained rise in the general level of prices in the economy. When prices go up
consumers can’t purchase the same quantity of goods and services they could before prices went up with
the same amount of money. Neither can producers purchase the same quantities of resources used in the
production process so the cost of making goods and services increases. Purchasing power declines so
people find themselves worse off.
Suppose a consumer has $100 to spend on goods and services and after a period of time prices rise
by 10%. The consumer will need $110 to buy the same goods and services at the end of the period due to
inflation. With $100 he/she will only be able to buy 100/110 or 91% of the goods and services they could
buy before prices went up by 10%. The consumer’s real income has fallen. The higher the inflation rate the
more serious the problem is. The only way to keep pace with inflation is for income (for both workers and
firms) to rise by the same rate as inflation and thus maintain real income. However this is difficult to
achieve for all workers and firms. This is one of the major reasons why governments are concerned with
inflation.
It is the job of the Australian Bureau of Statistics to keep track of inflation. The ABS collects data
on price changes on a large selection of goods and services which the average Australian family purchases.
It measures the changes in the prices of these products over time with a mathematical tool called the
Consumer Price Index (CPI). It releases the CPI every 3 months. The CPI is a very important piece of
statistical information because it influences the behaviour of consumers and producers.
The CPI collection of goods and services which the ABS collects price data on covers the following
categories:
Food
Communication
Education
Tobacco and alcohol
Household furnishings supplies & services
Clothing & footwear
Miscellaneous
Health
Recreation
Transportation
Housing
Prices are collected from many sources: supermarkets, department stores, shoe shops, car dealers,
service stations, hotels, schools, hairdressers, newsagents, travel agents, government departments and so on.
Something like 100,000 prices are collected each quarter. The most volatile are collected monthly for
example milk, fresh fruit and vegetables, meat, bread, alcohol, petrol, holiday travel and accommodation.
For most other items, prices are not so volatile and are collected quarterly.
To calculate the CPI you need to know the dollar value of the basket goods and services of the base
or reference year and the year being calculated. For example, if the total cost of the CPI basket for the base
year (year 1) is $1500 and for year 2 it is $1575, then the CPI is calculated as follows:
$ value of basket in a year 2
$ value of basket in the base year
CPI year 2
x
100
=
$1575 x 100
$1500
=
105
If the cost of the basket rises to $1600 in year 3 then the CPI for year 3 is:
CPI year 3
=
$1600
$1500
=
106.7
x 100
The CPI can be used to calculate the inflation rate for a particular year. For example, what is the inflation
rate for year 3 above? This is calculated using the following formula.
Calculating the inflation rate for year 3 = CPI for year 3 - CPI for year 2
CPI for year 2
Year 3 inflation rate = 106.7 - 105
105
x
100
x 100
= 1.6%
The inflation rate is the percentage change in the CPI from one year to the next.
Student Activities
Use the table below to answer the questions which follow.
Consumer Price Index for June each year
(base year 1989-90 = 100)
1996-97
1997-98
1998-99
1999-00
2000-01
2001-02
2002-03
2003-04
2004-05
2005-06
2006-07
2007-08
2008-09
eg. what was the inflation rate in 1998 – 99?
121.8 - 120.3
120.3
x 100 =
1.25%
120.3
120.3
121.8
124.7
132.2
136.0
140.2
143.5
147.0
151.9
157.5
164.6
167.0
(ABS: Australian Economic Indicators 1350.0)
1. Calculate the inflation rate to two decimal places for each year:
a) 1999-00 ____________________
b) 2000-01
____________________
c) 2001-02 ____________________
d) 2002-03
____________________
e) 2003-04 ____________________
f) 2004 - 05
____________________
g) 2005 - 06 ____________________
h) 2006-07
____________________
i) 2007-08 ____________________
j) 2008-09
____________________
2. Which year in the table had the highest inflation rate? ________ and the lowest rate? ________
3. If the total cost of a basket of goods and services is $2623 in the reference year, calculate the CPI to one
decimal
place for the following years:
a) if the total cost of the basket of goods and services rises to $2695? ____________
b) if the total cost of the basket of goods and services rises to $2948? ____________
c) if the total cost of the basket of goods and services rises to $3119? ____________
4. Discuss the following topics with a partner and write your answers briefly in the spaces provided.
a) Workers naturally want to maintain real incomes. How do they do this? What problems can this lead to?
______________________________________________________________________________
______________________________________________________________________________
______________________________________________________________________________
b) Inflation pushes up the prices of inputs into the production process increasing costs to producers.
How might they respond to inflation and what problems might this cause?
______________________________________________________________________________
______________________________________________________________________________
______________________________________________________________________________
c) Imported goods from countries with a lower level of inflation will be relatively cheaper than locally
made goods. How will this effect local producers and how might they respond to the increased
competition from overseas products?
______________________________________________________________________________
______________________________________________________________________________
______________________________________________________________________________
d) How might the CPI affect the behaviour of consumers and producers? Think about how you would react
if you expected inflation to rise in the future and your wage (if you were a worker) or profits (if you were
a business person) were to decline making it difficult for you to “make ends meet”. What would you do?
______________________________________________________________________________
______________________________________________________________________________
______________________________________________________________________________
THE KEYNESIAN MODEL OF INCOME AND EXPENDITURE ANALYSIS   C (total spending by HH in the 2 sector CFM) Line of potential equilibrium points where C=O=Y   C      Autonomous  (a) consumption or survival spending (spending on needs or non‐discretionary goods and services).  C=O=Y (equilibrium) 45°  Y (total income to HH in the 2 sector CFM)
   Equilibrium points where O=Y   C+I+G+Xn AD or AE (includes all forms of expenditure)   C+I+G  C+I C    When we add the other sectors to the model we have C plus all the injections (I, G and Xn)             a Equilibrium shifts with the addition of each injection increasing economic growth   45° Y or GDP Y           Y1         Y2        Y3
В В В В PRODUCTIONВ FUNCTION – aВ modelВ ofВ productivityВ В В OutputВ В В В В В В В В В В O3В ProductionВ FunctionВ 2В afterВ productivityВ growthВ OutputВ increaseВ dueВ ProductionВ FunctionВ 1В beforeВ productivityВ growthВ В toВ productivityВ growthВ В В В В В В В В O2В В В В OutputВ increaseВ dueВ toВ increaseВ inВ inputsВ В В В В В В В В O1В В В В В InputsВ egВ labourВ В В В В В В В I1В В В В В В В В В В В В В В В В В В В I2В В WhenВ inputsВ areВ increased,В egВ moreВ labourВ and/orВ capitalВ isВ employedВ (I1В toВ I2),В outputВ risesВ fromВ O1В toВ O2.В В В В В WhenВ productivityВ increases,В В givenВ inputВ levelВ I2,В outputВ risesВ furtherВ toВ O3.В AВ nation'sВ productivityВ isВ theВ volumeВ ofВ goodsВ andВ servicesВ itВ producesВ (itsВ output)В forВ aВ givenВ volumeВ ofВ inputsВ (suchВ asВ labourВ andВ capital).В AВ nationВ thatВ achievesВ productivityВ growthВ producesВ moreВ goodsВ andВ servicesВ fromВ itsВ labour,В capital,В land,В energyВ andВ otherВ resources.В Much,В butВ notВ all,В ofВ Australia'sВ outputВ growthВ canВ beВ accountedВ forВ byВ increasesВ inВ theВ inputsВ toВ production.В TheВ amountВ byВ whichВ outputВ growthВ exceedsВ inputВ growthВ isВ theВ productivityВ improvement.В ProductivityВ growthВ canВ generateВ higherВ incomeВ andВ benefitsВ mightВ alsoВ accrueВ inВ theВ formВ ofВ lowerВ consumerВ prices.В В ProductivityВ canВ beВ measuredВ inВ aВ varietyВ ofВ ways.В TheВ mostВ comprehensiveВ AustralianВ measureВ availableВ atВ presentВ isВ multifactorВ productivityВ forВ theВ marketВ sector.В MultifactorВ productivityВ representsВ thatВ partВ ofВ theВ growthВ inВ outputВ thatВ cannotВ beВ explainedВ byВ growthВ inВ labourВ andВ capitalВ inputs.В ExamplesВ ofВ multifactorВ productivityВ growthВ includeВ improvedВ productionВ techniques,В betterВ managementВ practices,В andВ organisationalВ change.В TechnologicalВ change,В suchВ asВ increasedВ computingВ power,В isВ embodiedВ inВ theВ asset,В andВ asВ suchВ isВ capturedВ inВ theВ capitalВ inputs.В Source:В ABSВ В В 1383.0.55.001В THEВ ROLEВ OFВ INVENTORIESВ TheВ Production‐DistributionВ ChainВ (orВ theВ SupplyВ chain)В StageВ 1В В ProductionВ GoodsВ areВ producedВ inВ factoriesВ usingВ capitalВ andВ labour.В FinishedВ goodsВ areВ storedВ inВ warehousesВ untilВ theyВ areВ sentВ outВ toВ customers.В WhileВ theyВ areВ storedВ theyВ areВ calledВ inventories.В StageВ 2В В WholesalingВ GoodsВ areВ purchasedВ fromВ theВ producersВ byВ firmsВ whichВ sellВ toВ businessesВ whichВ sellВ toВ consumers.В TheВ wholesaleВ stageВ isВ whereВ largeВ quantitiesВ ofВ goodsВ areВ orderedВ andВ storedВ inВ largeВ warehousesВ beforeВ beingВ sentВ outВ toВ shopsВ andВ departmentВ storesВ whereВ consumersВ seeВ themВ andВ buyВ them.В WhileВ goodsВ areВ waitingВ toВ beВ transportedВ toВ shopsВ theyВ areВ inВ storageВ andВ areВ calledВ inventories.В StageВ 3В В RetailingВ В GoodsВ areВ sentВ outВ toВ smallВ andВ largeВ shopsВ whereВ consumersВ buyВ them.В GoodsВ arriveВ atВ theВ retailersВ whereВ someВ areВ putВ intoВ theВ showroomsВ andВ shopВ frontsВ wereВ consumersВ canВ inspectВ themВ andВ theВ restВ areВ keptВ inВ storageВ outВ theВ backВ ofВ theВ shopВ orВ somewhereВ relativelyВ nearbyВ untilВ theyВ areВ neededВ toВ replaceВ theВ goodsВ inВ theВ showroomВ whenВ theyВ areВ sold.В WhileВ inВ storageВ theyВ areВ alsoВ consideredВ inventories.В В SoВ atВ everyВ stageВ inВ theВ productionВ andВ distributionВ chain,В thereВ areВ inventories.В WhenВ consumersВ increaseВ theirВ spendingВ andВ buyВ moreВ goods,В retailersВ shiftВ moreВ outВ ofВ storageВ intoВ theirВ shopВ frontsВ forВ sale.В TheyВ needВ toВ orderВ moreВ toВ replaceВ theirВ reducedВ inventories.В WholesalersВ receiveВ moreВ ordersВ fromВ retailersВ soВ theyВ immediatelyВ shiftВ moreВ ofВ theirВ stockВ outВ ofВ storageВ toВ theВ retailers.В TheyВ inВ turnВ willВ needВ toВ restockВ soВ sendВ theirВ ordersВ throughВ toВ producers.В ProducersВ willВ increaseВ theirВ supplyВ ofВ goodsВ toВ wholesalersВ andВ inВ turnВ willВ needВ toВ increaseВ productionВ toВ buildВ upВ theirВ inventoriesВ soВ theyВ areВ readyВ toВ meetВ furtherВ increasesВ inВ demandВ fromВ theirВ customers.В AsВ productionВ increases,В theВ demandВ forВ resourcesВ willВ increase.В MoreВ employmentВ willВ occurВ andВ incomesВ willВ riseВ makingВ possibleВ furtherВ householdВ spending.В MoreВ consumptionВ willВ putВ furtherВ pressureВ onВ stocksВ andВ productionВ willВ accelerate.В PressureВ inВ productВ andВ factorВ marketsВ willВ causeВ pricesВ toВ rise.В AsВ incomesВ rise,В leakagesВ willВ increaseВ tooВ eventuallyВ helpingВ toВ slowВ theВ paceВ ofВ growthВ asВ theВ economyВ movesВ toВ aВ newВ higherВ equilibriumВ levelВ ofВ nationalВ income.В
© Copyright 2026 Paperzz