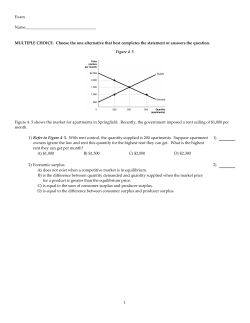
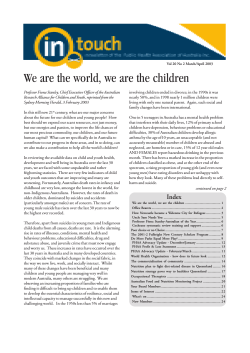
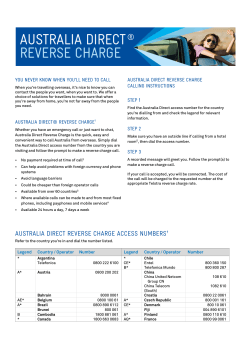
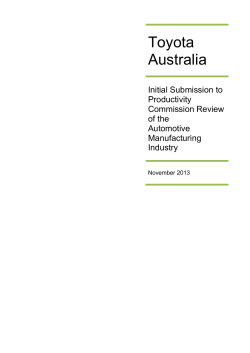
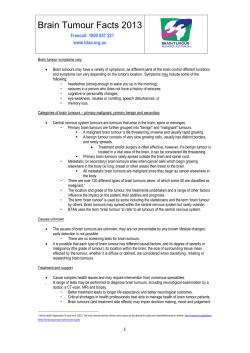
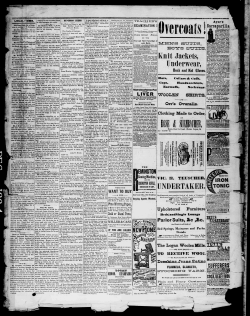
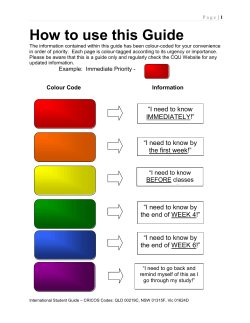
Clearing the air Why Australia urgently needs effective national air pollution laws www.envirojustice.org.au About Environmental Justice Australia Environmental Justice Australia (formerly the Environment Defenders Office, Victoria) is a not-for-profit public interest legal practice. Funded by donations and independent of government and corporate funding, our legal team combines a passion for justice with technical expertise and a practical understanding of the legal system to protect the environment. We act as advisers and legal representatives to the environment movement, pursuing court cases to protect our shared environment. We work with community-based environment groups, regional and state environmental organisations, and larger environmental NGOs. We provide strategic and legal support to their campaigns to address climate change, protect nature and defend the rights of communities to a healthy environment. While we seek to give the community a powerful voice in court, we also recognise that court cases alone will not be enough. That’s why we campaign to improve our legal system. We defend existing, hard-won environmental protections from attack. We also pursue new and innovative solutions to fill the gaps and fix the failures in our legal system to clear a path for a more just and sustainable world. Donate at: www.envirojustice.org.au/donate For further information on this report please contact: Nicola Rivers, Director of Advocacy and Research, Environmental Justice Australia Telephone: 03 8341 3100 Email: [email protected] Environmental Justice Australia Telephone: 03 8341 3100 (Melbourne metropolitan area) 1300 336 842 (Local call cost for callers outside Melbourne metropolitan area) Facsimile: 03 8341 3111 Email: [email protected] Website: www.envirojustice.org.au Post: PO Box 12123, A’Beckett Street VIC 8006 Address: Level 3, the 60L Green Building, 60 Leicester Street, Carlton SEEK LEGAL ADVICE REGARDING SPECIFIC CASES While all care has been taken in preparing this publication, it is not a substitute for legal advice in individual cases. For any specific questions, seek legal advice. Environmental Justice Australia would like to acknowledge the considerable expert advice and guidance provided by Doctors for the Environment Australia and the Nature Conservation Council of NSW in compiling this document. Any errors or omissions are the responsibility of Environmental Justice Australia and this report does not necessarily represent the views of these contributors. Produced & published by Environmental Justice Australia ABN 74 052 124 375 Publication date: 20 May 2014 2 Clearing the air www.envirojustice.org.au Contents 1 Executive summary 4 1.1 What is the problem? 4 1.2 Air pollution regulation is failing 4 1.3 The solution 5 2 Air pollution: A serious issue health issue for Australia 7 2.1 Particulate pollution 8 2.2 The government response 11 2.3 Our regulatory failure 11 Major sources of air pollution in Australia 12 3 Air pollution – an environmental injustice 14 4 Health costs of air pollution 17 5 Environmental impacts of air pollution 18 6 Australian air pollution protection laws 20 6.1 State and Territory implementation 21 7 Up in the air: Why the current system is failing Australians 22 7.1 The current process for setting standards is failing 22 7.2 The standards we have are inadequate 23 7.3 Monitoring and enforcement is weak or non-existent 26 8 Clearing the air: How we can ensure better air quality 28 8.1 Promises to fix the system are repeatedly broken or delayed 28 8.2 The solutions we need 28 Appendix 31 Sources for Infographics 33 www.envirojustice.org.au Clearing the air 3 1 Executive summary Effective regulation of air pollution is critical to ensuring Australians are safe from air pollution. Individuals cannot readily control the extent to which they are exposed to harmful air-borne pollutants. They need the law to protect them. The problems with the way air pollution is currently regulated in Australia are many and complex. However the two critical elements that are currently lacking are strong Commonwealth Government leadership on standard setting to break the current regulatory logjam and mechanisms to ensure implementation of the national standards occurs at state, territory, regional and pollution-source levels. The Commonwealth Government should take seriously its responsibility for achieving clean air across Australia by implementing a national scheme for air pollution that is binding on States and Territories – an Air Pollution Prevention Act. The Air Pollution Prevention Act should protect the health of all Australians, wherever they live. 1.1 What is the problem? Air pollution in Australia is inadequately regulated, monitored and enforced. It has been estimated that each year more than 3000 Australians die premature deaths from urban air pollution.1 Last year a Senate Committee inquiry concluded that despite improvements in Australian air quality over the last two decades, air quality is still a significant problem in many parts of Australia.2 Some communities are much more affected than others, depending on how close they are to pollution sources. The serious health consequences from exposure to the different sources of air pollution are now well established. Pollutant impacts vary but there is a consensus that there is no �safe’ level of exposure for many of these pollutants and that there are harmful impacts from exposure at levels even below the current air quality standards.3 Two recent studies have shown that particular groups suffer significant environmental injustice from industrial air pollution in Australia.4 Communities closest to industrial pollution sites are characterised by social and economic disadvantage. There are environmental impacts also. Some types of air pollution exacerbate climate change, and more extreme air pollution events will occur as a result of climate change including more petrochemical smog and higher human exposure to particulate pollution and ground level ozone.5 1.2 Air pollution regulation is failing Australia lacks an effective system of regulation for air pollution. The current system is based on a completely unsatisfactory arrangement that leaves important standards to protect health to be set by complex intergovernmental arrangements involving Commonwealth, State and Territory governments. This system is failing to adequately protect public health. The Australian Medical Association has stated: Current air quality standards in Australia lag behind international standards and have failed to keep pace with scientific evidence. Insufficient monitoring and poor compliance mechanisms, fragmentation between different sectors and tiers of government, and the lack of exposure targets are but some of the areas requiring review and reform.6 1 4 Begg, Vos, Barker, Stevenson, Stanley & Lopez, The burden of disease and injury in Australia 2003, Australian Institute of Health and Welfare, Cat. no. PHE 82, Canberra (2007), p234, available at http://www.aihw.gov.au/publication-detail/?id=6442467990. 2 Senate Community Affairs References Committee, Parliament of Australia, Impacts on Health of Air Quality in Australia, 2013, p3. 3 Doctors for the Environment Australia, Submission no 4 to Senate Community Affairs References Committee, Parliament of Australia, Impacts on Health of Air Quality in Australia, 2013, pp5,8; World Health Organization, Health Aspects of Air Pollution with Particulate Matter, Ozone and Nitrogen Dioxide, Report on WHO Working Group (2003) pp5-6. 4 Chakaraborty and Green, Australia’s first national level quantitative environmental justice assessment of industrial air pollution, Environmental Research Letters 9 (2014) 044010; Higgenbotham et al, Environmental injustice and air pollution in coal affected communities, Hunter Valley, Australia, Health & Place 16 (2010) 259–266. 5 Environment Protection Authority South Australia, Effects of global climate change on local air quality, EPA SA website, available at http://www.epa.sa.gov.au/environmental_info/ air_quality/air_quality_and_climate_change. 6 Australian Medical Association, submission to Senate Community Affairs References Committee, Parliament of Australia, Impacts on health of air quality in Australia, 2013, p2. Clearing the air www.envirojustice.org.au Since 1998, efforts have been made to set air quality and emissions standards as well as monitoring and reporting requirements through “National Environmental Protection Measures” (NEPMs) agreed by State and Territory governments and the Commonwealth. Implementation of these NEPMs falls to State and Territory governments. NEPMs are now an inefficient and ineffective way of dealing with air pollution. The science, technology, and needs of the community have moved far beyond what was required when the NEPMs were established and they have failed to keep pace. The NEPM processes can be torturously slow, as shown by the sixteen years of failure to make a compliance standard for PM2.5. Standards are inadequate and do not address the real risks to communities who suffer the most exposure such as those near major roads, mines or industrial activity. Monitoring and enforcement is weak or nonexistent. There is no penalty if States and Territories don’t comply with NEPMs, and state monitoring and enforcement of state air pollution laws is patchy. In addition, communities have no powers to compel monitoring of the air pollution affecting them, and very limited rights to stop it occurring. 1.3 The solution Despite COAG promising a National Plan for Clean Air since 2011, the Commonwealth Environment Minister recently announced that development of the Plan would be delayed until at least July 2016. Left to COAG, it is unlikely national laws will be achieved for many years, if at all. With more than 3000 people dying each year from air pollutionrelated illness, governments cannot afford to delay any longer. The Commonwealth Government should take seriously its responsibility for achieving clean air across Australia by implementing a national scheme for air pollution that is binding on States and Territories – the Air Pollution Prevention Act. With more than 3000 “people dying each year from air pollution-related illness, governments cannot afford to delay any longer ” The Air Pollution Prevention Act would be standalone Commonwealth legislation that does not rely on agreement from States and Territories. It could be in place much quicker than a COAG-negotiated outcome because it would remove years of negotiation on appropriate standards between the States and Territories. It would set standards based on science at levels needed to protect all Australians, rather than settling for a �race to the bottom’ between States. A national Air Pollution Regulator should be established as a Commonwealth government agency with responsibility for implementing, monitoring and enforcing the Air Pollution Prevention Act. The Regulator would be responsible for ensuring States and Territories are complying with the standards, investigating community complaints of breaches, and taking enforcement action against States and Territories. The States and Territories would be required to implement the national laws in each jurisdiction and enforce local breaches of the Act. They would be required to report to the Regulator annually on implementation, monitoring and enforcement of the Act. Air pollution affects everyone, however some Australian communities are bearing a much heavier burden than others. Only genuine national leadership, via Commonwealth laws that put an obligation on States and Territories to clean up our air, can protect the health of all Australians. www.envirojustice.org.au Clearing the air 5 Air pollution nuMber crunch 1041 27,519 heAlthy yeArs oF liFe Are lost by AustrAliAns every yeAr FroM exposure to Air pollution up to $8.4 billion AnnuAl estiMAted heAlth costs oF Air pollution in sydney nuMber oF tiMes between 2000 And 2006 thAt coAl Mines in the hunter reGion breAched their pollution licences totAl econoMic cost in the yeAr 2000 oF Air pollution FroM Motor vehicles Alone wAs $2.4 billion 3000 AustrAliAns die preventAble deAths eAch yeAr FroM Air pollution zero the sAFe level oF exposure to MAny oF the MAJor Air pollutAnts www.envirojustice.org.au Sources: see page 33 6 Clearing the air www.envirojustice.org.au 2 Air pollution: A serious issue health issue for Australia Air pollution in Australia is inadequately regulated, monitored and enforced. It has been estimated that each year more than 3000 Australians die premature deaths from urban air pollution.7 The World Health Organization recently announced that air pollution is now the world’s largest environmental health risk. They estimated that ambient air pollution caused �3.7 million premature deaths worldwide in 2012’.8 While air pollution in Australia is not as bad as some countries, the evidence is clear that thousands of preventable deaths occur every year in Australia. Some communities are much more affected than others, depending on how close they are to pollution sources. Our current standards have not kept pace with the standards we should have, according to the best research. The serious health consequences from exposure to the different sources of air pollution are now well established. The World Health Organization Director of Public Health, Environmental and Social Determinants of Health painted a very worrying picture when she said: The risks from air pollution are now far greater than previously thought or understood, particularly for heart disease and strokes...Few risks have a greater impact on global health today than air pollution; the evidence signals the need for concerted action to clean up the air we all breathe.9 Doctors for the Environment Australia summarise the health issues associated with air pollution as: There is a vast international body of literature on the health impacts of air pollution... It reports a wide range of adverse health outcomes, including exacerbation of chronic respiratory and cardiovascular disease, and premature mortality. Air pollution worsens asthma and chronic obstructive pulmonary disease and can increase the risk of cardiac arrhythmia, heart attack, stroke and lung cancer, and hinders lung development. This translates to increases in emergency department presentations and hospital admissions, as well as deaths.10 is no �safe’ level of “...there exposure for many of these pollutants and there are harmful impacts from exposure at levels even below the current air quality standards... ” Pollutant impacts vary but there is a consensus that there is no �safe’ level of exposure for many of these pollutants and that there are harmful impacts from exposure at levels even below the current air quality standards.11 7 Begg, Vos, Barker, Stevenson, Stanley & Lopez, The burden of disease and injury in Australia 2003, Australian Institute of Health and Welfare, Cat. no. PHE 82, Canberra (2007), p234, available at http://www.aihw.gov.au/publication-detail/?id=6442467990. 8 World Health Organization, Ambient (outdoor) air quality and health, Fact Sheet N°313 (March 2014) available at http://www.who.int/mediacentre/factsheets/fs313/en/. 9 Dr Maria Neira, World Health Organization, 7 million premature deaths annually linked to air pollution, News Release, 25 March 2014, available at http://www.who.int/mediacentre/ news/releases/2014/air-pollution/en/. 10 Doctors for the Environment Australia, Submission no 4 to Senate Community Affairs References Committee, Parliament of Australia, Impacts on Health of Air Quality in Australia, 2013, p4. 11 Doctors for the Environment Australia, Submission no 4 to Senate Community Affairs References Committee, Parliament of Australia, Impacts on Health of Air Quality in Australia, 2013, pp5,8; World Health Organization, Health Aspects of Air Pollution with Particulate Matter, Ozone and Nitrogen Dioxide, Report on WHO Working Group (2003) pp5-6. www.envirojustice.org.au Clearing the air 7 While air pollution affects everyone, it affects particular groups in the community more than others. Groups who are more likely to be vulnerable to the health effects of air pollutants include: • children • pregnant women • elderly people • asthmatics and people with chronic disease (especially heart and lung diseases) • low socio-economic groups.12 Those most at risk from the health impacts of air pollution are those who live near heavily used road and rail transport corridors, people exposed to wood smoke from home fires, and people who live near industrial pollution sources such as coal mines, coal-fired power stations and smelters.13 2.1 Particulate pollution Particulate matter pollution (also known as particulate pollution or PM pollution) is one of the most common and concerning forms of pollution, as new evidence has emerged showing that exposure causes lung cancer, cardiovascular disease and stroke.14 Particulate matter pollution is made up of particles that are referred to as coarse, fine or ultrafine particles (PM10, PM2.5, or PM0.1) depending on the size of the particles. PM pollution is not one particular chemical substance; it is a classification by size rather than substance.15 For example PM2.5 are airborne particles less than 2.5 micrometres in diameter (approximately 1/40 the average width of a human hair). PM2.5 and PM0.1 are considered more dangerous to human health than PM10, as they are more easily drawn deep into the lungs and are closely linked to serious health impacts, particularly heart and lung disease. Sources of PM pollution are extremely varied. The main causes of PM pollution in Australia are: • coal burning for power generation • mining • emissions from combustion processes such as petrol and particularly diesel vehicles • farming • wood burning • bushfires • dust storms • industrial activities such as brickworks, refineries, iron and steel making, quarrying, smelters, cement plants and paper mills.16 PM pollution is a problem in both large cities and rural towns. The health impacts of PM pollution are particularly concerning. PM pollution can cause a range of health problems and is strongly associated with hospitalisation and death for cardio-pulmonary disease, lung cancer, chronic obstructive pulmonary disease and cardiovascular diseases.17 Even short-term exposure can cause serious ongoing health problems.18 12 Australian Medical Association, Submission no 114 to Senate Community Affairs References Committee, Parliament of Australia, Impacts on Health of Air Quality in Australia, 2013, p6. 13 Centre for Air Quality & Health Research and Evaluation, submission no 29 to Senate Community Affairs References Committee, Parliament of Australia, Impacts on Health of Air Quality in Australia, 2013 p4. 14 World Health Organization, Global Health Observatory: Ambient Air Pollution available at http://www.who.int/gho/phe/outdoor_air_pollution/en/. 15 National Pollution Inventory, Substance Fact Sheet: Particulate Matter, available at http://www.npi.gov.au/resource/particulate-matter-pm10-and-pm25. 16 National Pollution Inventory http://www.npi.gov.au/resource/particulate-matter-pm10-and-pm25; CSIRO Submission no 48 to Senate Community Affairs References Committee, Parliament of Australia, Impacts on Health of Air Quality in Australia, p8. 17 World Health Organization, Global Health Observatory: Ambient Air Pollution, available at http://www.who.int/gho/phe/outdoor_air_pollution/en/. 18 Doctors for the Environment Australia, Submission no 4 to Senate Community Affairs References Committee, Parliament of Australia, Impacts on Health of Air Quality in Australia, 2013, p8. 8 Clearing the air www.envirojustice.org.au A fire that choked a town At just 25, a fit and healthy Estelle Landy had never experienced chronic illness before. But when Hazelwood coal mine caught fire, blanketing the town of Morwell in toxic smoke, the effects were obvious. Everyone was reporting the same symptoms. A dry throat, a headache, feeling tired and unable to focus. �At one point it got so bad that I nearly called an ambulance. I was working away on the computer and my chest just felt tighter and tighter, it was so hard to breathe,’ Estelle remembers. The effects on the natural world were obvious and sinister. �All the birds left; every single one. They were able to fly away so they did. My poor horses were stuck outside all the time and their coats started to fall out.’ Victoria’s pollution monitoring systems showed levels of particulate pollution that were up to 15 times higher than the current air quality standard. The Government’s eventual response was targeted at the most vulnerable, but really the whole population needed help, believes Estelle. �In some ways it was even harder on working people,’ she explains. �All the assistance we finally got was for people who had a health care card, which means a family income of less than $46,000 per year. But for me and my friends, we were young, we were working, and there was just no help. If you had a job and you left town to get away from the pollution, you could lose your job. There was nowhere to turn.’ actually have to “ Isweep coal dust off my pillow before I go to sleep each night ” Small business owners suffered too, with Morwell a virtual ghost town for weeks and no one to patronise shops or cafes. �The streets were so empty it felt like there should be looters running through them. No one could go out or exercise or do anything, we were all stuck inside.’ Uncertainty about the long-term effects of the disaster worries Estelle. �Not knowing what the long-term effects could be is the worst. We were breathing that air for weeks in Morwell. Even now, there’s so much coal dust in the air that it covers surfaces in my house. Even my bed gets this fine layer of black dust on it. I actually have to sweep it all off my pillow before I go to sleep each night.’ 19 19 Landy, E, 8 May 2014, pers. comm. www.envirojustice.org.au Clearing the air 9 AIR POLLUTION HEALTH IMPACTS HEALTH IMPACTS OF AIR POLLUTION Impaired lung growth in children Increased asthma, coughs and bronchitis Impairment of brain development in babies and small children Low birth weight and adverse birth outcomes Heart attack and stroke Upper respiratory tract irritation and infection Worsening of existing health problems in people with chronic disease PEOPLE MOST SUSCEPTIBLE Children Pregnant women and unborn children Elderly people People with chronic disease Sources: see page 33 www.envirojustice.org.au 10 Clearing the air www.envirojustice.org.au 2.2 The government response Last year a Senate Committee inquiry concluded that despite improvements in Australian air quality over the last two decades, air quality is still a significant problem in many parts of Australia.20 Similarly a 2011 government review into the adequacy of the current national regulation found that �there are significant health effects at current levels of air pollution in Australian cities’ and that the current standards �are not meeting the requirement for adequate protection of human health’.21 It recommended that the standards be improved to protect the health of the Australian population. Even Commonwealth Environment Minister Greg Hunt acknowledges the importance of this issue, stating: �… I would like to complete a National Clean Air Agreement by 1 July 2016. The Australian Institute of Health and Welfare estimated that urban air pollution was responsible for more than 3000 early deaths in 2003. This is a critical national issue and I would like it to be a signature objective of my watch.’22 As we will explain, these words do not signify action, nor is our current air pollution regulatory system up to the task. 2.3 Our regulatory failure Australia lacks an effective system of regulation for air pollution. The current system is based on a completely unsatisfactory arrangement that leaves important standards to protect health to be set by complex intergovernmental arrangements involving Commonwealth, State and Territory governments. This system is failing to adequately protect public health. Although the need for action has been recognised, the necessary steps to solve the problem are repeatedly stalled and deferred. The Commonwealth Government recently shut down the inter-governmental committee tasked with driving the national reform process to improve Australian air quality. It also announced that the National Plan for Clean Air that Commonwealth, State and Territory governments agreed in 2011 to establish would be delayed until July 2016.23 Despite the rhetoric, clean air is evidently not a priority for the Australian Governments. Effective and comprehensive protection from air pollution is challenging and complex. However the basic elements necessary to reform the current system are clear. We need strong Federal Government leadership on standard setting to break the current regulatory logjam. We also need mechanisms to ensure that appropriate standards are translated into action. 20 Senate Community Affairs References Committee, Parliament of Australia, Impacts on Health of Air Quality in Australia, 2013, p3. 21 National Environmental Protection Council, Ambient Air Quality NEPM Review, Adelaide (2011) p 28, available at http://www.scew.gov.au/resource/national-environment-protectionambient-air-quality-measure-review-review-report. 22 The Hon Greg Hunt MP, Inaugral Alan Hunt Oration, Speech to the Urban Development Institute of Australia 7 March 2014, available at http://www.environment.gov.au/minister/ hunt/2014/sp20140307.html. 23 The Hon Greg Hunt MP, Agreed Statement, Environment Ministers Meeting 29 April 2014 available at http://www.environment.gov.au/minister/hunt/2014/mr20140429.html?utm_ source=mins&utm_medium=rss&utm_campaign=feed. www.envirojustice.org.au Clearing the air 11 Major sources of air pollution in Australia Coal-fired power stations Coal-fired power stations are one of the biggest and most harmful sources of air pollution. They threaten both human health and the environment. Electricity generation is the single largest source of both PM2.5 and sulfur dioxide pollution as well as the second-largest source of nitrogen dioxide.24 Together with coal mining, electricity generation is responsible for about 58 per cent of all PM2.5 emissions.25 Coal mines and coal trains As with coal-fired power stations, the impacts of coal mining are severe and far reaching. Coal mining accounts for 27 per cent of PM2.5 and 58 per cent of PM10 pollution in greater metropolitan Sydney. In the Upper Hunter region, those levels are higher, at 66 per cent of PM2.5 and 87per cent of PM10 emissions.26 The Asthma Foundation New South Wales has highlighted the links between coal mining and asthma, citing one study that found that nearly 40 per cent of nine-to-15-year-olds in the Hunter Valley and the New England region had suffered from asthma. The national average is just 10 per cent. 27 �Lithgow in the Blue Mountains has a coalmine, a newly extended coal-fired power station and an asthma rate 80 per cent higher than the New South Wales average.’28 Unconventional gas extraction Extracting gas from unconventional sources (coal seam gas, shale gas and tight gas) is a significant contributor to local air pollution. Hydrocarbons and volatile organic compounds can escape along with methane. The United States has recently introduced legislation to control these hazardous pollutants from fracking gas wells;29 Australia has no such legislation. 24 National Pollution Inventory 2011-2012 available at www.npi.gov.au. 25 National Pollution Inventory 2011-2012 available at www.npi.gov.au. 26 NSW EPA, Submission no 80 to Senate Community Affairs References Committee, Parliament of Australia, Impacts on Health of Air Quality in Australia, 2013, pp 10–11. 27 Senate Community Affairs References Committee, Parliament of Australia, Impacts on Health of Air Quality in Australia, 2013, p35. 28 Senate Community Affairs References Committee, Parliament of Australia, Impacts on Health of Air Quality in Australia a, 2013, p35. 29 Weinhold, The Future of Fracking; New Rules Target Air Emissions for Cleaner Natural Gas Production, Environmental Health Perspective July 2012; 120(7): 272–279 available at http://ehp.niehs.nih.gov/wp-content/uploads/120/7/ehp.120-a272.pdf. 12 Clearing the air www.envirojustice.org.au Major sources of air pollution in Australia Factories and other industrial sources Factories and industrial sites like iron ore smelters can emit a range of harmful substances such as PM10 and PM2.5, sulfur dioxide, carbon monoxide, and lead that can impact on communities that live nearby. For example, people who live near petrol refineries, chemical manufacturing industries, mineral ore processing plants and power stations experience higher levels of sulfur dioxide pollution.30 Cars and trucks Cars and trucks are a major source of PM2.5 and the second-largest source of nitrogen dioxide.31 They are a major cause of ozone and petrochemical smog in capital cities, particularly Sydney, Melbourne, Brisbane and Perth, which can experience ozone levels above the NEPM standards.32 The health risks of living near busy roads and continuous exposure to high levels of air pollution for sustained periods of time are significant. Exposure to diesel emissions is particularly harmful and has recently been declared by the World Health Organization to be a known cause of cancer.33 Wood heaters Wood heaters in homes are a huge source of emissions of PM2.5 and PM10. One evening’s fire from one home can generate more smoke than 5000 cigarettes. In Sydney, wood heaters have been found to cause up to 48 per cent of the city’s total PM10 emissions and 60 per cent of PM2.5 emissions.34 Short-term exposure can cause eye and lung irritation and long-term exposure can cause decreased lung function and bronchitis. There are significant problems with the regulation of wood heaters in Australia and better regulation has been stymied by the woodheating industry.35 30 Department of the Environment and Heritage, Air quality fact sheet: Sulfur dioxide (SO2) (2005) available at http://www.environment.gov.au/resource/sulfur-dioxide-so2. 31 National Pollution Inventory 2012-2012, available at www.npi,gov.au. 32 Department of Infrastructure and Transport, Final Regulation Impact Statement for Review of Euro 5/6 Light Vehicle Emissions Standards, Canberra (2010), p14 available at http:// www.infrastructure.gov.au/roads/environment/files/Final_RIS_Euro_5_and_6_Light_Vehicle_Emission Review.pdf. 33 World Health Organization, Bulletin of the World Health Organization, Volume 90 Number 7, (July 2012), 477-556, available at http://www.who.int/bulletin/ volumes/90/7/12-010712/en/. 34 NSW EPA, Submission no 80 to Senate Community Affairs References Committee, Parliament of Australia, Impacts on Health of Air Quality in Australia, 2013, p33. 35 Senate Community Affairs References Committee, Parliament of Australia, Impacts on Health of Air Quality in Australia, 2013, pp62-63. www.envirojustice.org.au Clearing the air 13 3 Air pollution – an environmental injustice An environmental injustice arises when there is an unequal distribution of risks and impacts from a polluting activity. Air pollution affects everyone to some degree, however many Australians are worse off than others. This injustice arises in two ways. Firstly, the risks and impacts of air pollution are unequally distributed geographically – affected communities are often the most socially and economically disadvantaged. Secondly, some individuals in our community are more vulnerable than others to the effects of air pollution, particularly the very young, and those who are elderly or vulnerable through pre-existing health problems. While people in larger cities are generally exposed to higher levels of air pollution than people in rural areas, certain communities in Australia suffer disproportionately high impacts of toxic pollution due to the proximity of highly polluting facilities. This is particularly the case in coal mining regions such as the Hunter Valley in NSW and the Latrobe Valley in Victoria, for communities near industrial sites such as the Port Pirie lead smelter, and for residents of suburbs within close proximity to major roads and rail that cause diesel or PM pollution. The case studies in this report highlight the impacts on some of these communities. Two recent studies have shown that particular groups suffer significant environmental injustice from industrial air pollution in Australia.36 Communities within one kilometre of industrial pollution sites are characterised by social and economic disadvantage.37 A study published in 2014 stated: This national level quantitative assessment of environmental justice has found significant and systemic inequities in the social distribution of industrial air pollution in Australia. Regardless of how air pollution was measured; facility presence, emission volume, or toxicity, our analysis indicated a consistent and disproportionate impact on indigenous and socially disadvantaged communities.38 It is unjust that certain communities suffer the impacts of pollution significantly more than others. Current air pollution laws do not adequately protect these communities. 36 Chakaraborty and Green, Australia’s first national level quantitative environmental justice assessment of industrial air pollution, Environmental Research Letters 9 (2014) 044010; Higgenbotham et al, Environmental injustice and air pollution in coal affected communities, Hunter Valley, Australia, Health & Place 16 (2010) 259–266. 37 Chakaraborty and Green, Australia’s first national level quantitative environmental justice assessment of industrial air pollution, Environmental Research Letters 9 (2014) 044010. 38 Chakaraborty and Green, Australia’s first national level quantitative environmental justice assessment of industrial air pollution, Environmental Research Letters 9 (2014) 044010. 14 Clearing the air www.envirojustice.org.au Train danger uncovered in the coal corridor Charlotte McCabe worries every day about what coal dust is doing to her kids. �We know there are these fine particles in the air all the time around the kids. We have a 4 year old and a 13 month old. All the parents are really worried about what they are exposing their kids to.’ Charlotte lives in Tighes Hill in Newcastle. Up to 100 coal trains a day thunder past her suburb and the Carrington coal terminal is about a kilometre away from her house. �We recently painted our house and there was an oily black grime on the walls that just wouldn’t come off. I don’t know what it was but it looked like black coal dust.’ �The coal terminal has a phenomenal amount of coal stockpiled and it’s not covered. They hose it down to reduce the dust but on hot days that doesn’t help. The rail line has constant coal trains going past with wagons full of uncovered coal. Even the empty coal trains stir up dust because they are not washed down after they’re unloaded.’ �The thing I worry about the most is my kids’ lungs and the lungs of the other kids. There are schools all along the train line. My daughter’s childcare centre is right next to the train line and it’s a beautiful centre but right next to all that dust.’ �It’s so hard to challenge the government and the companies when they say everything is fine, because the information is so bamboozling and technically loaded that you don’t even know what questions to ask. We’ve all had to become experts. Surely we shouldn’t have to do that, it should be the EPA’s job.’ �The small percent of the profit that it would take to cover the coal - why would they not do that to protect our health? The companies are pretty much regulating themselves.’ thing I worry about “theThemost is my kids’ lungs and the lungs of the other kids. There are schools all along the train line. ” �People say if you move in next to a train line you shouldn’t complain but if you compare the number of trains now compared to 10 years ago it’s increased so much, and it’s going to get so much worse if they go ahead with the fourth coal terminal.’ �We’ve thought about leaving Newcastle but I feel like I can’t run away from this to leave the problem for other families.’ 39 39 McCabe, C, 13 May 2014, pers. comm. www.envirojustice.org.au Clearing the air 15 AIR POLLUTION HOT SPOTS 2 1 3 4 11 12 10 5 8 9 1 PORT HEDLAND 2 MT ISA 6 7 3 GLADSTONE 4 BRISBANE BIGGEST SOURCE BIGGEST SOURCE BIGGEST SOURCE BIGGEST SOURCE Iron ore dust from port operations Copper, lead, zinc mines Coal operations, aluminum smelter, chemical manufacturing Coal trains PROBLEM Asthma mortality rates are 322% higher than the rest of Queensland. At least 11% of children have elevated blood lead levels. PROBLEM 8.6 million tonnes of coal a year transported through Brisbane suburbs in uncovered trains. Pollution from iron ore dust regularly exceeds national standards. Hospitalisation for respiratory problems is 30% higher than WA average. 5 HUNTER VALLEY PROBLEM 6 7 8 YARRAVILLE BROOKLYN BIGGEST SOURCE BIGGEST SOURCE BIGGEST SOURCE BIGGEST SOURCE Coal mines and coal trains Coal mines and coal fired power stations Diesel trucks –7000 trucks daily on one residential street Nearby industrial estate PROBLEM PROBLEM One of the highest PM pollution levels in Australia. The 2014 Hazlewood coal mine fire caused pollution 15 times the acceptable limit. Particulate pollution exceeds safe health levels on numerous days each year. Worst air and dust pollution levels in Melbourne. Particulate pollution regularly exceeds acceptable limit. PROBLEM The national standard for PM10 pollution was exceeded 171 times in 2013 in the Hunter region. 9 MORWELL Community concern for years over excessive coal dust, alumina dust and other toxic air pollutants. PROBLEM 10 11 12 ANGLESEA PORT PIRIE BIGGEST SOURCE BIGGEST SOURCE BIGGEST SOURCE BIGGEST SOURCE Coal mine and power station Lead smelter, one of the biggest in the world Coal mine and power station Iron pelletising plant PROBLEM PROBLEM PROBLEM Power stations are the most polluting in Australia. Lung cancer rates twice the expected number. Highest rate of childhood asthma in the State. Lung cancer rates are 50% higher in Whyalla than similar towns. PROBLEM Power station emits high levels of sulphur dioxide More than 3000 children had elevated blood lead levels in the last decade. PORT AUGUSTA PROBLEM WHYALLA Sources: see pages 33–34 www.envirojustice.org.au 16 Clearing the air www.envirojustice.org.au 4 Health costs of air pollution Serious health impacts also mean serious health costs. So while the causes of air pollution may deliver short-term economic benefits they also cause huge longer-term economic costs. In 2005 the NSW Government estimated that air pollution in greater metropolitan Sydney cost between $1.01 billion and $8.4 billion every year in 2003 dollars (approximately $1.28 billion to $10.67 billion in today’s dollars).40 Across Australia, the total economic cost of motor vehicle air pollution-related mortality and morbidity was approximately $2.4 billion in 2000.41 It has been estimated that in 2000, air pollution from motor vehicles was responsible for 1420 deaths across Australia.42 the causes of “air...while pollution may deliver short-term economic benefits they also cause huge longer-term economic costs. ” The health costs associated with some of the individual pollutants has also been calculated. For example in the capital cities, each tonne of PM10 pollution that is prevented saves about $235,000 in health care costs, and for nitrogen dioxide the saving is about $1000 a tonne. 43 40 Department of Environment and Conservation (NSW), Air Pollution Economics: Health Costs of Air Pollution in the Greater Sydney Metropolitan Region, Sydney (2005), p43, available at http://www.environment.nsw.gov.au/resources/air/airpollution05623.pdf. 41 Bureau of Transport and Regional Economics, Health impacts of transport emissions in Australia: Economic Costs, Working Paper no. 63, Bureau of Transport and Regional Economics. Department of Transport and Regional Services, Canberra (2005) p100. 42 Bureau of Transport and Regional Economics, Health impacts of transport emissions in Australia: Economic Costs, Working Paper no. 63, Bureau of Transport and Regional Economics. Department of Transport and Regional Services, Canberra (2005) pp90-91. 43 Department of Infrastructure and Transport, Final Regulation Impact Statement for Review of Euro 5/6 Light Vehicle Emissions Standards, Canberra (2010) pp55-57 available at http:// www.infrastructure.gov.au/roads/environment/files/Final_RIS_Euro_5_and_6_Light_Vehicle_Emissions_Review.pdf. www.envirojustice.org.au Clearing the air 17 5 Environmental impacts of air pollution Air pollution also has an impact on the natural environment. Impacts are many and varied depending on the pollution source. Air pollutants can harm or kill birds and animals and can kill or stunt growth of plants. For example, lead does not break down in the environment but will remain attached to soil for many years. It accumulates in living tissue such as plants and animals as well as water and over time can kill plants, birds, fish and animals. Nitrogen dioxide contributes to smog, and excessive levels harm plants and animals directly or via acid rain.44 Sulphur dioxide also causes environmental damage as acid rain. Surface ozone is the most damaging air pollutant to crops and ecosystems.45 ...lead does not “break down in the environment... It accumulates in living tissue such as plants and animals as well as water... ” Air pollutants also have an impact on climate change. For example black carbon, or soot, is a type of PM2.5 that comes from the incomplete combustion of fossil fuels, biofuels and biomass. In Australia, black carbon comes from vehicle emissions, especially diesel vehicles, as well as bushfires, wood heaters and coal burning.46 Black carbon is a major contributor to climate change as it increases the effects of warming in the atmosphere.47 Reducing black carbon is predicted to have a significant effect on reducing global warming.48 Ozone, sulfur dioxide and carbon monoxide are other greenhouse gases that contribute to climate change. Just as air pollution is having an impact on climate change, climate change will also have an impact on air pollution. As temperatures increase and the impacts of climate change become more severe we can expect that the frequency of high ozone days in excess of the national standards will also increase.49 The South Australian EPA predicts that as temperatures increase and humidity levels decline the increased intensity and frequency of dust storms will add to extreme air pollution events, which will include higher levels of petrochemical smog, and result in higher human exposure to particulate pollution and ozone.50 44 National Pollution Inventory 2011-2012, available at http://www.npi.gov.au. 45 Avnery, Mauzerall, Liu, Horowitz, Global crop yield reductions due to surface ozone exposure: 2. Year 2030 potential crop production losses and economic damage under two scenarios of O3 pollution, Atmospheric Environment 45 (2011) 2297-2309 at 2297, available at https://www.princeton.edu/~mauzeral/papers/Avnery%20Mauzerall%20etal%20ag%202030%20AE%202011.pdf. 46 Ball, The charcoal challenges: fire and climate dynamics, The Conversation (10 May 2012) available at http://theconversation.com/the-charcoal-challenges-fire-and-climatedynamics-6788; 47 Zimmer, Black Carbon and Warming: It’s Worse than We Thought, Environment 360, (17 January 2013) available at http://e360.yale.edu/feature/carl_zimmer_black_carbon_and_ global_warming_worse_than_thought/2611/. 48 Zimmer, Black Carbon and Warming: It’s Worse than We Thought, Environment 360, (17 January 2013) available at http://e360.yale.edu/feature/carl_zimmer_black_carbon_and_ global_warming_worse_than_thought/2611/. 49 Allen, Tango in the Atmosphere: Ozone and Climate Change, NASA Earth Observatory, February 2004 available at http://www.giss.nasa.gov/research/features/200402_tango/. 50 Environment Protection Authority South Australia, Effects of global climate change on local air quality, EPA SA website, available at http://www.epa.sa.gov.au/environmental_info/ air_quality/air_quality_and_climate_change. 18 Clearing the air www.envirojustice.org.au Table 1: Summary of the sources and health impacts of different pollutants Pollutant Known health effects Vulnerable populations • motor vehicle emissions (particularly diesel engines) • industry emissions • mining activity • agricultural practices • wood-burning • unflued gas heating and cooking • bushfires • wind-blown dust • cigarette smoke • coal dust • coal burning • upper respiratory tract irritation and infection • exacerbation of asthma • decreased lung function • exacerbation of, and increased mortality from, cardiorespiratory diseases • myocardial infarction • premature mortality • atherosclerosis • adverse birth and neurodevelopment outcomes • elderly people with respiratory and cardiovascular conditions • children with asthma Ozone (O3) • reaction of sunlight and vehicle or industrial emissions • hydrocarbons and oxides of nitrogen • decreased lung and pulmonary function • upper respiratory tract infection (especially in children) • exacerbation of chronic respiratory conditions, including asthma, emphysema and chronic bronchitis • increased airway reactivity. can cause respiratory symptoms even in people without lung problems • people with chronic respiratory conditions (especially children with asthma) Oxides of nitrogen (NOx) • motor vehicle emissions • energy generation • mining and other industrial emissions • unflued gas appliances • upper respiratory tract infection (especially in children) • exacerbation of chronic respiratory conditions, including asthma • eye irritation • reduced immunity to lung infection • people with respiratory conditions (especially children with asthma) Sulfur dioxide • fossil fuel combustion • metal smelting or photochemical industries • throat irritation • exacerbation of cardiovascular diseases, including asthma • people with respiratory conditions (esp. children with asthma) • elderly people with respiratory and/or cardiovascular diseases Carbon monoxide • biomass and fossil fuel combustion • vehicle exhaust emissions • cigarette smoke • reduction of oxygen-carrying capacity of the blood, resulting in headache, nausea, dizziness, breathlessness, fatigue, visual disturbance • angina, coma • death • low birth weight (after maternal exposure during pregnancy) • people with ischaemic heart disease • pregnant women Lead • smelting • in children, neuropsychological and cognitive effects • in adults, hypertension and classic lead poisoning • children and pregnant women Air toxics (hydrocarbons aldehydes, volatile organic compounds, asbestos) • motor vehicle and industry emissions • biomass • occupational exposures • smoking • increase in the incidence of cancer • reproductive and developmental effects • eye irritation • genetic damage • central nervous system defects • immunodeficiency • disorders of the respiratory and nervous systems • smokers • people with respiratory conditions (especially children with asthma); Particulate matter (PM10 and PM2.5) Sources Source: Australian Medical Association Submission Senate Community Affairs References Committee, Parliament of Australia, Impacts on health of air quality in Australia, 2013, p3. www.envirojustice.org.au Clearing the air 19 6 Australian air pollution protection laws Historically, State and Territory governments have had responsibility for protecting people from pollution. In 1992, in order to reduce the ongoing disputes of the previous two decades over responsibility for environment protection, the Commonwealth, State and Territory Governments signed the Intergovernmental Agreement on the Environment. The Intergovernmental Agreement on the Environment set out a shared approach to dealing with environment and conservation issues, and included provision for a new body which would establish national standards for pollution. Thus the National Environmental Protection Council and the National Environment Protection Measures (NEPM) were born. The National Environmental Protection Council is made up of Commonwealth, State and Territory environment ministers. The National Environmental Protection Council develops NEPMs which are then made law though mirror legislation in the States, Territories and the Commonwealth. Implementation of the NEPMs falls to State and Territory Governments. States and Territories can adopt broader or more stringent regulation than provided for by the NEPM but may not adopt lower standards. While the Commonwealth has a role in developing NEPMs it does not decide how States will implement them or have any direct responsibility for regulating, monitoring or enforcing air pollution laws. There are four NEPMs that directly relate to air quality – the National Environmental Protection Measure for Ambient Air Quality (Air NEPM); the National Environment Protection Measure for Air Toxics (Air Toxics NEPM); the National Environment Protection Measure for Diesel Vehicle Emissions (Diesel NEPM); and the National Environment Protection Measure for the National Pollutant Inventory (NPI NEPM). The Air NEPM sets national ambient air standards for six major pollutants that are commonly released from industrial processes and pose significant health risks to humans (see table 1 for a summary of the sources and health impacts of various pollutants). The Air NEPM was first made in 1998 and then amended in 2003 to include an advisory (non-binding) standard for PM2.5. The NEPM standards for each of the pollutants is shown in tables 2 and 3 (see appendix). States and Territories are expected to keep air pollution below these standards. In contrast, the Air Toxics NEPM does not contain mandatory standards; rather, it is a requirement to monitor and report on certain toxic emissions (see table 4). Air toxics are a range of air pollutants found in outdoor air in relatively low concentrations, but have characteristics that make them a risk to human health. Air toxics come from numerous sources, including motor vehicle emissions, products of burning fuels, industrial emissions and materials such as paints and adhesives.51 There has been little monitoring for air toxics in Australia thus far, and it is unlikely that governments will make national standards without significant further monitoring and investigation.52 A separate NEPM exists for diesel engines which are a significant cause of nitrogen dioxide and PM pollution. Diesel exhaust emissions are listed by the WHO as a carcinogen and are therefore a significant concern. In September 2014 the new Euro 6 standards will be applied in Europe to reduce pollution from vehicle engines.53 However this stricter standard will not begin operating in Australia until 2017.54 The NPI NEPM established a national system of reporting of 93 different substances emitted by industrial facilities across Australia. One of the aims of the NPI NEPM is to give the public access to information on what harmful substances are being emitted near them. Emissions reported to the NPI are estimates generated by industrial facilities rather than actual emission levels. 51 Department of the Environment and Heritage, Air toxics: Air quality fact sheet (2005), available at http://www.environment.gov.au/resource/air-toxics. 52 Department of the Environment and Heritage Air toxics: Air quality fact sheet (2005), available at http://www.environment.gov.au/resource/air-toxics. 53 Regulation (EC) No 715/2007 of the European Parliament and of the Council of 20 June 2007 on type approval of motor vehicles with respect to emissions from light passenger and commercial vehicles (Euro 5 and Euro 6) and on access to vehicle repair and maintenance information, OJ L 171, 29/06/2007, p. 1–16. 54 Department of Infrastructure and Regional Development, Vehicle Emission Standards (10 April 2014) available at http://www.infrastructure.gov.au/roads/environment/files/ Emission_Limits_for_Light_Vehicles_Euro_2_Euro_6.pdf. 20 Clearing the air www.envirojustice.org.au 6.1 State and Territory implementation The implementation of air quality standards is the responsibility of State and Territory governments via regulation of the harmful activities that cause air pollution. This is done through state planning and environmental protection laws as well as other specific measures to address particular types of pollution. It is typically the responsibility of the State and Territory Environment Protection Authorities (EPAs). Air pollution sources can either be �point source’ (a single identified source such as a coal mine) or �non-point source’ (a number of small sources that combine). Both sources can be significant contributors to air pollution and have a significant impact on the environment and human health. Non-point source pollution is particularly difficult to regulate because it comes from many emitters, usually in low levels. While on their own they may not have a significant impact on health, cumulatively they have a very significant impact. Table 5 sets out the main laws that implement the Air NEPM in each State (see appendix). The way in which air quality is regulated varies from State to State, however the general approach for point source pollution is to regulate industrial facilities that cause emissions via a works approval and licencing system. Certain industries, or any industry that emits over a certain level of harmful substance, are required to seek approval before constructing a facility. They are also required to hold an ongoing pollution licence which regulates how much of each substance the facility can emit, along with conditions for monitoring and reporting. Some jurisdictions also operate specific schemes to reduce harmful pollution from certain sectors or in certain regions such as coal mines in the Hunter Valley. In 2013, PM levels “exceeded the standards 10 171 times in Newcastle and the Hunter Valley. Monitoring and enforcement of point source pollution is critical to make these schemes work, but is often lacking. For example, in NSW between 2000 and 2008, over 3000 pollution licence breaches were recorded but only six of those went to court. In the Hunter Region alone, 27 coal mines breached pollution licences 1041 times between 2000 and 2006.55 In 2013, PM10 levels exceeded the Air NEPM standards 171 times in locations in Newcastle and the Hunter Valley. In Victoria, the EPA has only taken companies to court for air pollution offences five times in the last five years.56 ” Non-point source emissions are sometimes regulated via laws that target the producer of the product rather than the individual emitter. Standards for reducing emissions from diesel vehicles is one example. However the difficulty with identifying and controlling non-point source pollution means that these sources are often not regulated at all. In general, air pollution laws do not effectively regulate cumulative impacts from multiple smaller sources. 55 Australian Network of Environmental Defenders Officers, Submission no 85 to Senate Community Affairs References Committee, Parliament of Australia, Impacts on Health of Air Quality in Australia, 2013. 56 EPA Victoria prosecutions database available at http://www.epa.vic.gov.au/our-work/compliance-and-enforcement/epa-sanctions/prosecutions. www.envirojustice.org.au Clearing the air 21 7 Up in the air: Why the current system is failing Australians Effective regulation of air pollution is critical to ensuring Australians are safe from air pollution. Individuals cannot readily control the extent to which they are exposed to harmful air-borne pollutants. They need the law to protect them.57 The Australian Medical Association has stated: Current air quality standards in Australia lag behind international standards and have failed to keep pace with scientific evidence. Insufficient monitoring and poor compliance mechanisms, fragmentation between different sectors and tiers of government, and the lack of exposure targets are but some of the areas requiring review and reform.58 The problems with the way air pollution is currently regulated in Australia are many and complex. Some relate to the way in which air pollution is regulated via the NEPM process, some relate to inadequacies in the standards themselves, and some to major issues with monitoring and enforcement. We do not address all of the problems in this report but will outline some of the most significant regulatory issues. The two critical elements that are currently lacking in our regulatory system are strong Commonwealth government leadership on standard setting to break the current regulatory logjam, and mechanisms to ensure implementation of the national standards occurs at state, regional and pollution-source levels. Two examples of how these failures have played out in practice are that – 1. despite clear evidence and government recognition of the high level of harm currently occurring from PM2.5, there is still no standard for PM2.5, and 2. communities who are the most vulnerable – those who live in close proximity to major pollution sources, and those who are at highest risk from exposure including the elderly, children, pregnant women and people with medical conditions that are exacerbated by air pollution – are not adequately protected by our laws. These issues are explored further below. 7.1 The current process for setting standards is failing NEPMs are now an inefficient and ineffective way of dealing with air pollution. When the Air NEPM was first made in 1998 it was a useful first step in understanding Australia’s air pollution levels and beginning to address this problem as a national issue. However the science, technology, and needs of the community have moved far beyond what was required at that time and the NEPMs have failed to keep pace. The NEPM process is no longer a useful tool in reducing harmful levels of air pollution in Australia. NEPMs require input and negotiation from nine separate governments to develop standards, and then two-thirds majority agreement to make them. This process has to be repeated each time a NEPM is revised. The processes can be torturously slow, as shown by the sixteen years of failure to make a compliance standard for PM2.5: • In 1998, ministers first discussed making a PM2.5 standard, but determined that there was not enough data to set an appropriate standard. • In 2001, ministers committed to a review to consider setting a standard. • In 2003, ministers concluded there was not enough data to make a compliance standard, so made a reporting standard instead.59 • In 2007, 2011 and 2014, ministers again considered the need for a compliance standard but have failed to make one on each occasion, despite over a decade of overwhelming evidence of serious health impacts. 57 Australian Network of Environmental Defenders Officers, Submission no 85 to Senate Community Affairs References Committee, Parliament of Australia, Impacts on health of air quality in Australia, 2013. 58 Australian Medical Association, submission to Senate Community Affairs References Committee, Parliament of Australia, Impacts on health of air quality in Australia, 2013, p2. 59 National Environmental Protection Council, Review of the National Environment Protection (Ambient Air Quality) Measure, Issues Scoping Paper October 2005. 22 Clearing the air www.envirojustice.org.au Despite monitoring and reporting of PM2.5 being compulsory since 2004, there remains no compliance standard. In contrast, the United States has had compulsory PM2.5 standards in place for 14 years.60 The most recent review of the Ambient Air Quality NEPM was completed in 2011, and found significant problems, gaps and failures of the NEPM. 23 recommendations were made to improve it but none has yet been implemented. In fact the Commonwealth Environment Minister Greg Hunt recently stated that the reform process would be delayed another two years until 2016.61 Many of the recommendations that were made by the National Environmental Protection Council review would be a valuable improvement to the NEPM, but they are of little use if the process for making them is so flawed that they cannot be implemented. 7.2 The standards we have are inadequate In 2011, the National Environment Protection Council stated: Overall, the results of the health reviews show that there are significant health effects at current levels of air pollution in Australian cities. These findings indicate that the current standards are not meeting the requirement for adequate protection of human health. There is evidence that these standards should be revised to minimise the impact of air pollution on the health of the Australian population.62 Australia has no nationally binding standard for PM2.5 pollution, despite the fact that it is now recognised that PM2.5 is causing a significant health burden on Australians.63 As noted above, the National Environmental Protection Council has been considering implementing PM2.5 as a mandatory standard for over a decade, but has failed to act. In April this year, environment ministers yet again failed to set a standard for PM2.5, and instead decided to continue with monitoring only.64 While the standards for other pollutants meet or are similar to international standards, they could be improved. The current standards have been in place for more than 15 years and do not reflect the latest thinking. In 2006 the World Health Organization significantly lowered their recommended standards, particularly for nitrogen dioxide, ozone and sulfur dioxide.65 Australia’s standards fall short of these recommended standards. There is no reason why Australia should not adopt world’s best practice. This means not just adopting standards for the pollutants that have been outlined in this report but also properly assessing whether in fact these are currently the pollutants that present the greatest risk to the community. Chemicals such as arsenic or cadmium are not currently regulated by the national standards, but have a significant impact on communities through mining activities.66 A key issue with current standards is that their thresholds of acceptable pollution levels are set for ambient air, which means the average air quality in a region. Ambient thresholds can’t address the real risks to communities who suffer the most exposure. An objective of the NEPMs is to provide equivalent protection from air pollution to people �wherever they live in Australia’.67 However, people who live close to major roads, mines or industrial activity are exposed to sustained levels of increased pollution and continue to have their health compromised. The Air NEPM explicitly states that monitoring stations �must be located in a manner such that they contribute to obtaining a representative measure of the air quality likely to be experienced by the general population in the region’,68 and only in population centres with over 25,000 people.69 Monitoring under the NEPM can therefore only occur away from sources of pollution, and does not occur at all in smaller communities. In the Hunter Valley in NSW for example, this 60 National Ambient Air Quality Standards for Particulate Matter, 40 CFR Part 50 (1997). 61 The Hon Greg Hunt MP, Inaugral Alan Hunt Oration, Speech to the Urban Development Institute of Australia 7 March 2014 http://www.environment.gov.au/minister/hunt/2014/ sp20140307.html. 62 National Environmental Protection Council, Ambient Air Quality NEPM Review, Adelaide, 2011, p28 available at http://www.scew.gov.au/resource/national-environment-protectionambient-air-quality-measure-review-review-report. 63 National Environmental Protection Council, Ambient Air Quality NEPM Review, Adelaide, 2011, p28 available at http://www.scew.gov.au/resource/national-environment-protectionambient-air-quality-measure-review-review-report. 64 The Hon Greg Hunt MP, Agreed Statement, Environment Ministers Meeting 29 April 2014 available at http://www.environment.gov.au/minister/hunt/2014/mr20140429.html?utm_ source=mins&utm_medium=rss&utm_campaign=feed. 65 World Health Organization, WHO challenges world to improve air quality, Media Release, 5 October 2006, available at http://www.who.int/mediacentre/news/releases/2006/pr52/ en/; WHO, Air quality guidelines for particulate matter, ozone, nitrogen dioxide and sulfur dioxide - Global update 2005 - Summary of risk assessment, available at http://whqlibdoc. who.int/hq/2006/WHO_SDE_PHE_OEH_06.02_eng.pdf?ua=1. 66 Senate Community Affairs References Committee, Parliament of Australia, Impacts on health of air quality in Australia, 2013, p23. 67 National Environment Protection Council Act 1994 (Cth) s3. 68 National Environment Protection (Ambient Air Quality) Measure 2003 cl 13. 69 National Environment Protection (Ambient Air Quality) Measure 2003 cl 14. www.envirojustice.org.au Clearing the air 23 means that communities frequently exposed to levels of PM10 and PM2.5 pollution above the national standard have no regulatory protection.70 is no �safe’ level “ Thereof exposure to many air pollutants. ” Government has repeatedly failed to resolve this failure of the NEPM system. Communities have no powers to compel monitoring of the air pollution affecting them, and very limited rights to stop it occurring. In order to deal adequately with these issues the system needs to be more responsive to the particular sources of emissions and the people who are exposed to those emissions.71 Problems also arise from the way the NEPM standards are categorised. For example, the Air NEPM currently allows five �exceedence’ days each year, being days where pollution exceeds the standard’s limit. Under this approach large polluting industries are not encouraged to lower particulate emissions as there appears to be an assumption that any exceedences can simply be absorbed by these allowed pollution days. A better approach would be to make �not to be exceeded’ standards with exceptions made for �natural events’. There is also a fundamental question about whether having single standard is sufficient to deal with the problem. There is no �safe’ level of exposure to many air pollutants. Available evidence suggests that, at least for particulate pollution and for NO2, further health gains can be achieved by further reduction in pollutant levels. However the current model of air pollution regulation does not encourage emission reductions that would achieve these health gains.72 The standards are currently often viewed as a benchmark for best practice, when instead they should be viewed as a ceiling for pollution concentrations. Ambient concentrations of harmful pollutants should be minimised to levels well below the NEPM standards. Every tonne of pollution that is avoided translates to immediate health, environmental and economic benefits. The fact that there is no threshold below which no adverse health impacts occur means that the focus should be on continuous improvement and reducing pollution levels as much as possible rather than simply staying under a single standard. 70 In 2013, PM10 levels exceeded the NEPM standards on 171 occasions in locations in Newcastle and the Hunter Valley. Hunter Community Environment Centre, Premier urged to control air pollution in 2014: 50% increase in air pollution breaches in Newcastle and the Hunter, Media Release (28 December 2013) available at http://www.hcec.org.au/20140119/ premier-urged-control-air-pollution-2014-50-increase-air-pollution-breaches-newcastle-and 71 For more general information on appropriate air quality standard setting see National Health and Medical Research Council, Ambient air quality standards setting: an approach to health based hazard assessment, Canberra (2006) available at http://www.nhmrc.gov.au/_files_nhmrc/publications/attachments/eh40.pdf. 72 Centre for Air Quality & Health Research and Evaluation, submission no 29 to Senate Community Affairs References Committee, Parliament of Australia, Impacts on Health of Air Quality in Australia, 2013 p5. 24 Clearing the air www.envirojustice.org.au West is the best, except for the air When Sam McArthur moved to the inner West of Melbourne in 1996, she felt like a pioneer. �Back then, not many people I knew could see how great the West was. I laugh about it now, but I had friends saying “We’ll never visit you, it’s too far away”.’ Nearly two decades later, Sam loves the lifestyle – but there is one major downside. �The sense of community is fantastic. Parks, cafes, schools for the kids – it’s all here. The only problem is the air.’ As the parent of a five-year-old son who has just started Prep at Kingsville Primary, the air pollution issue is becoming even more serious for Sam and her family. �My son’s school is 400 metres away from our place. It should be the perfect walk to school through lovely streets laid out in the 19th century.’ Unfortunately, that isn’t the case, with air pollution causing serious worry to Sam. �We live between Somerville Road and Francis Street, and the walk is awful. A never-ending parade of heavy trucks belch out diesel fumes. They are so huge that sometimes you can feel the ground shaking as they pass. I dread to think what this daily exposure to air pollution loaded with carcinogens is doing to his little lungs.’ There’s no relief on the school grounds either. �He’s just started Prep and I’m so happy and proud of him. It should be a fantastic time in his development, but the Prep classrooms are 20 metres from Somerville Road.’ Western Melbourne is an area experiencing huge growth in families with young children. With many people priced out of other parts of Melbourne due to the high cost of housing, and others attracted by the same amenities and strong community feel that keep Sam so attached to Yarraville, the effects of the diesel fumes are felt far beyond this one family. �There are 120 preps in my son’s year at school. That’s 120 children breathing in these fumes day after day. You have to wonder what the effects on our children will be – and the cost to our society.’ Truck fumes smother suburban streets For decades the communities in Melbourne’s west have been pushing for change after experiencing diesel pollution at levels harmful to their health. Particular concern has been expressed over Francis Street, Yarraville, which sees an estimated 20,000 vehicles pass through it every weekday.73 Up to 7000 of these vehicles are diesel trucks which use the residential street as a toll-free passage from the West Gate Freeway to the port precinct. Residents report queues of trucks stretching up to 300 metres blowing black smoke, and washing covered in black soot. There are numerous schools along the truck routes around Yarraville. Air particle monitoring was initially conducted by the EPA in 2001 and found that on numerous days the residents of this area were being exposed to extreme air pollution at unsafe levels – some of the highest diesel pollution levels ever recorded in Australia.74 Despite new diesel fuel regulations and a curfew being introduced on trucks entering Francis Street at night,75 a decade later the air quality issues have not been solved. A second EPA monitoring program of motor vehicle emissions was conducted on Francis Street during 2013 and still found that air pollution was prevalent at levels which exceeded standards set to protect health on numerous days.76 Particularly high levels of PM2.5 were measured. 73 EPA Victoria, Francis Street Monitoring Program - Final report, Publication 1546.1, 10 December 2013. 74 EPA Victoria, Air monitoring at Francis Street, Yarraville, Publication 821, 30 November 2001. 75 EPA Victoria, Air pollution and noise monitoring, Publication 1460, May 2012. 76 EPA Victoria, Francis Street Monitoring Program - Final report, Publication 1546.1, 10 December 2013. www.envirojustice.org.au Clearing the air 25 7.3 Monitoring and enforcement is weak or non-existent Another significant problem with the way NEPMs operate is that there is no penalty if States and Territories don’t comply with them. Jurisdictions are required to report to the National Environmental Protection Council each year on their implementation of NEPMs, but there are no consequences from a failure to meet the standards. The NEPMs are designed to set national standards and encourage jurisdictions to work towards them, rather than result in any consequences for the States and Territories themselves if standards are not met or monitoring is not properly conducted. Monitoring under the Air NEPM is designed to capture data on the average air quality in a region in order to understand the general impacts on the population.77 Monitoring stations are therefore located away from major pollution sources such as roads, industrial areas and mines. There is strong criticism from many sectors that this type of monitoring hides the true levels of air pollution many communities are exposed to.78 For example, motor vehicles cause about 30 per cent of PM pollution in Melbourne. A study from the EPA has confirmed that the PM standards are not met near some busy roads in Melbourne.79 It is clear that there are many communities who are exposed to much higher levels of harmful pollutants on a much more frequent basis than the NEPM data reveals.80 Indeed some communities experience air quality exceeding NEPM standards on an almost daily basis.81 Similarly, some pollutants are measured over a period of time such as 24 hours that allows the levels to be averaged out, hiding any spikes in emissions. This ignores the fact that short-term exposure to some pollutants can be very damaging to health.82 of air “ Enforcement pollution is also a significant problem ...there are no consequences from a failure to meet the standards... ” Monitoring of known pollution sources such as industrial sites usually occurs as a result of State Government requirements on individual polluters as part of their operating licence. This type of monitoring has also been criticised as being inaccurate and very difficult for the community to access. For example in Victoria, it took years for the local community exposed to particulate pollution from the Alcoa coal mine to access air pollution data collected by the company.83 Inaccuracies can result from poorly written licences which do not require monitoring at sites that will accurately record community exposure.84 Enforcement of air pollution is also a significant problem. As noted above, over 3000 pollution licence breaches were recorded in NSW between 2000 and 2008 but only six were taken to court85 and in Victoria the EPA has only taken companies to court for air pollution offences five times in the last five years.86 77 National Environment Protection (Ambient Air Quality) Measure (Cth) clause 11; see also EPA NSW submission in response to Hunter Community Environment Centre submission no 5 to Senate Community Affairs References Committee, Parliament of Australia, Impacts on health of air quality in Australia, 2013 for an illustration of the effect of this shortcoming in practice. 78 See for example submissions discussed in the Senate Community Affairs References Committee, Parliament of Australia, Impacts on health of air quality in Australia, 2013. 79 EPA Victoria (2006). Review of air quality near major roads. Publication 1025. February 2006. Environment Protection Authority Victoria. 80 Senate Community Affairs References Committee, Parliament of Australia, Impacts on health of air quality in Australia, 2013. 81 For example in the Lower Hunter where monitoring over a one month period showed the PM10 standard exceed by more than 50% every day. Hunter Community Environment Centre submission no 5 (Supplementary submission) to the Senate Community Affairs References Committee, Parliament of Australia, Impacts on health of air quality in Australia, 2013. 82 Coal Terminal Action Group, Coal train signature study, (2013) p.6, available at http://www.hcec.org.au/sites/default/files/CoalTrainSignatureReportAug2013.pdf#overlaycontext=node/103. 83 Evidence to Senate Community Affairs References Committee, Parliament of Australia, Canberra 17 May 2013, 54 (Dr Merryn Redenbach, Quit Coal). 84 Australian Network of Environmental Defenders Offices, Submission no 85 to Senate Community Affairs References Committee, Impacts on health of air quality in Australia, 2013. 85 Australian Network of Environmental Defenders Offices, Submission no 85 to Senate Community Affairs References Committee, Parliament of Australia, Impacts on health of air quality in Australia, 2013. 86 EPA Victoria prosecutions database available at http://www.epa.vic.gov.au/our-work/compliance-and-enforcement/epa-sanctions/prosecutions. 26 Clearing the air www.envirojustice.org.au Air pollution politicAl delAy And preventAble deAths 3000 2003 states required to report pM2.5 levels for the first time through the nepM. AustrAliAns die preventAble deAths eAch yeAr FroM Air pollution 2005 nepM review of pollution standards scheduled to commence. review not completed until 2011. 2007 coAG releases air pollution discussion paper as part of review. 2011 thAt’s 33,000 deAths by 2014 coAG identifies air quality as a �priority issue of national significance’ and commits to a national plan for clean air by 2014. nepM review completed, 23 recommendations for reform made, none have been implemented. 2014 Federal government delays national clean air plan. coAG commits to �consider working towards’ the plan by July 2016. www.envirojustice.org.au Sources: see page 35 www.envirojustice.org.au Clearing the air 27 8 Clearing the air: How we can ensure better air quality 8.1 Promises to fix the system are repeatedly broken or delayed COAG has recognised that current air quality laws are deficient and in 2011 agreed to the development of a new National Plan for Clean Air to be completed by the end of 2014.87 However the future of the National Plan for Clean Air is now in doubt. Despite COAG working on this reform since 2011, the Commonwealth Environment Minister recently announced that development of the Plan would be delayed for another two years, until July 2016.88 Even this date seems unlikely after the Commonwealth Government abolished the Standing Council on Environment and Water which was tasked with developing the plan. In addition the commitment has recently been weakened further. Rather than presenting their Plan to COAG by 2016, Ministers now �agreed to consider working towards finalising an agreement’ by July 2016.89 COAG processes are notoriously slow even when a commitment has been made and a standing committee has carriage of the reform. Ministers also declined once again to consider making a binding PM2.5 standard, instead stating they would take the entirely ineffective step of reducing the reporting standard.90 After 16 years of the National Environmental Protection Council considering PM2.5 standards, it remains unregulated. “ Each year that national air pollution laws are not made represents thousands of preventable deaths ” 8.2 A further issue is that the National Plan for Clean Air is only a plan. It will be presented to COAG for further discussion and negotiation amongst all States and Territories before jurisdictions decide what concrete actions they will take. Based on past performance, it is likely to take many years for States and Territories to achieve actual reform and change the laws. The Commonwealth Environment Minister himself has stated that around 3000 people in Australia die each year from air pollution-related illnesses.91 That’s more than twice our national road toll.92 Each year that national air pollution laws are not made represents thousands of preventable deaths. The Commonwealth Government should take action now. The solutions we need It is clear that the current laws and the proposed process for developing new national standards are failing. Left to COAG, it is unlikely that effective national laws will be achieved for many years, if at all. With 3000 people dying each year from air pollution-related illness, governments cannot afford to wait any longer. Pollution doesn’t respect state borders and the large industries that cause the most air pollution often operate across Australia. The Commonwealth Government needs to exercise leadership and break the current logjam. The National Plan for Clean Air should not be delayed until 2016. The Commonwealth Government should take 87 COAG Standing Council on Environment and Water, Public Statement on the Development of the National Plan for Clean Air (31 May 2012) available at www.scew.gov.au/system/files/ pages/eabd6720-1c40-4f73-a326-acafa51cd799/files/national-plan-clean-air-public-statement.pdf. 88 The Hon Greg Hunt MP, Inaugral Alan Hunt Oration, Speech to the Urban Development Institute of Australia 7 March 2014 http://www.environment.gov.au/minister/hunt/2014/ sp20140307.html. 89 The Hon Greg Hunt MP, Agreed Statement, Environment Ministers Meeting 29 April 2014 available at http://www.environment.gov.au/minister/hunt/2014/mr20140429.html?utm_ source=mins&utm_medium=rss&utm_campaign=feed. 90 The Hon Greg Hunt MP, Agreed Statement, Environment Ministers Meeting 29 April 2014 available at http://www.environment.gov.au/minister/hunt/2014/mr20140429.html?utm_ source=mins&utm_medium=rss&utm_campaign=feed. 91 The Hon Greg Hunt MP, Inaugral Alan Hunt Oration, Speech to the Urban Development Institute of Australia 7 March 2014 http://www.environment.gov.au/minister/hunt/2014/ sp20140307.html. 92 Department of Infrastructure, Transport & Regional Economics http://www.bitre.gov.au/publications/ongoing/road_deaths_australia_monthly_bulletins.aspx. 28 Clearing the air www.envirojustice.org.au responsibility for ensuring the Plan is developed as a priority. However it should also be highlighted that a plan is not regulation. Governments should not imply that a plan can solve the problems faced by the community. In order to effectively and appropriately regulate air pollution, the Commonwealth should commit to implementing the framework for a national air pollution regulatory system through Commonwealth legislation. 8.2.1 The Air Pollution Prevention Act The Commonwealth Government should take seriously its responsibility for achieving clean air across Australia by implementing a national scheme for air pollution that is binding on States and Territories – the Air Pollution Prevention Act. Nationally significant problems that cause thousands of deaths and severe health problems in communities across Australia warrant national regulation. Other activities that cause death and significant impacts on human health, such as smoking, speeding on our roads, drug use and alcohol for minors, are all heavily and directly regulated. Air pollution warrants similar controls to protect community health. A single national regulation that clearly articulates pollution standards would ensure a consistent national approach that applies in every community across Australia. The Air Pollution Prevention Act would be standalone Commonwealth legislation that does not rely on agreement from States and Territories. It could be in place much quicker than a COAGnegotiated outcome because it would remove years of negotiation on appropriate standards between the States and Territories. It would set standards at levels needed for the benefit of all Australians, rather than a �race to the bottom’ between States. It would replace the current air pollution NEPMs. The States and Territories would then be required to implement the laws in each jurisdiction in a way that works best in that jurisdiction. The Air Pollution Prevention Act should include a strict timeframe by when each jurisdiction must have their implementation laws in place. The purpose of the Air Pollution Prevention Act should be to achieve continuous improvement in air quality and compliance with national standards. It must apply to all Australians wherever they live. The current practice of exempting smaller communities and those that happen to be close to point sources must be discontinued. The Air Pollution Prevention Act should include: • the maximum permitted concentrations of each of the major pollutants that meet world’s best practice and World Health Organization guidelines, with set review periods mandated • an exposure reduction framework that ensures pollution levels will continue to improve over time below the standards • particular standards for known harmful activities, for example coal trains, vehicle emissions and other mining or industrial processes, to be developed by an independent regulator • targeted requirements for higher-risk communities such as those that live near a major pollution source • improved implementation requirements at both Federal and State/Territory level to ensure that standards are properly implemented at the state and territory, regional and point source level • a requirement that existing pollution sources that contribute to breaching the standard be brought within standard within three years • improved monitoring of PM pollution including monitoring at all major population centres and near known PM pollution sources both urban and rural • compliance and enforcement mechanisms that include incentives and sufficiently deterring penalties, including innovative penalties for non-point source pollution to ensure States and Territories comply • a right to citizen enforcement of the laws so that communities affected by pollution laws can take polluters to court to enforce the law if regulators refuse to. www.envirojustice.org.au Clearing the air 29 8.2.2 A national Air Pollution Regulator An Air Pollution Regulator should be established as a Commonwealth government agency with responsibility for implementing, monitoring and enforcing the Air Pollution Prevention Act. The Regulator would be responsible for ensuring States and Territories are complying with the standards, investigating community complaints of breaches, and taking enforcement action against States and Territories. A high level of scrutiny, accountability and consequences for State and Territory governments and their regulators is critical to ensuring a national system of air pollution laws is actually implemented. The Regulator should publish an annual report on air quality in each State and Territory, the locations and causes of non-compliance, and the State’s response to non-compliance. The Regulator should have responsibility for ensuring there is consistency in monitoring and reporting arrangements by States, and advising the Commonwealth on States’ and Territories’ non-compliance. 8.2.3 State and Territory action The State and Territory level is the most appropriate level for on-ground implementation of air pollution laws. They have experience in pollution control and have specific responsibility for the majority of regulatory approvals that impact on air pollution. Under the Air Pollution Prevention Act, States and Territories would be responsible for achieving the standards in the Act and enforcing local breaches of the Act. They would need to develop implementation plans and develop criteria for the regulation of polluting activities to ensure that the standards are met. The standards and specific activity restrictions could be implemented via a combination of industrial pollution laws, planning laws and direct regulation of certain polluting activities. They would be required to report to the Regulator annually on implementation, monitoring and enforcement of the Act. 30 Clearing the air www.envirojustice.org.au Appendix Table 2: Air NEPM standards Pollutant Averaging period Maximum concentration Goal within 10 years Maximum allowable exceedences Carbon monoxide 8 hours 9.0 ppm 1 day a year Nitrogen dioxide 1 hour 1 year 0.12 ppm 0.03 ppm 1 day a year None Photochemical oxidants (as ozone) 1 hour 4 hours 0.10 ppm 0.08 ppm 1 day a year 1 day a year Sulfur dioxide 1 hour 1 day 1 year 0.20 ppm 0.08 ppm 0.02 ppm 1 day a year 1 day a year None Lead 1 year 0.50 µg/m3 None Particles as PM10 1 day 50 µg/m3 5 days a year Table 3: Air NEPM advisory standard for PM 2.5 Pollutant Averaging period Maximum concentration Goal Particles as PM2.5  1 day 1 year 25 µg/m3 8 µg/m3 Goal is to gather sufficient data nationally to facilitate a review of the Advisory Reporting Standards as part of the review of this Measure scheduled to commence in 2005.* ppm = parts per million μg/m³ = micrograms per cubic metre *The review was completed in 2011 Table 4: Air Toxics NEPM advisory standards Pollutant Averaging period Monitoring investigation level Goal Benzene Annual average 0.003ppm  8-year goal is to gather sufficient data nationally to facilitate development of a standard. Benzo(a)pyrene as a marker for Polycyclic Aromatic Hydrocarbons Annual average 0.3ng/m3 8-year goal is to gather sufficient data nationally to facilitate development of a standard. Formaldehyde 24 hours 0.04 ppm 8-year goal is to gather sufficient data nationally to facilitate development of a standard. Toluene 24 hours 1 ppm Annual average 0.1 ppm 8-year goal is to gather sufficient data nationally to facilitate development of a standard. 24 hours 0.25ppm Annual average 0.2 ppm Xylenes (as total of ortho, meta and para isomers) www.envirojustice.org.au 8-year goal is to gather sufficient data nationally to facilitate development of a standard. Clearing the air 31 Table 5: Summary of state laws that implement the Air NEPM Jurisdiction Summary of implementation frameworks for Air NEPM Commonwealth The Commonwealth implements the NEPM administratively. However, it is not required by the NEPM to undertake monitoring as it does not have authority over regions with a population of 25 000 or more. New South Wales The NEPM is implemented under the Protection of the Environment Operations Act 1997 and the Protection of the Environment Operations (Clean Air) Regulation 2010. Victoria The key legislative instruments are the State Environment Protection Policy (Ambient Air Quality) and the State Environment Protection Policy (Air Quality Management) made under the Environment Protection Act 1970. Queensland The NEPM is implemented under the Environmental Protection Act 1994, the Environmental Protection Regulation 1998, the Environmental Protection (Air) Policy 2008 and by programs under the South East Queensland Regional Plan 2009–2031. Western Australia The NEPM is implemented under the National Environment Protection Council (Western Australia) Act 1996, the Environmental Protection Act 1986 and by programs under the Perth Air Quality Management Plan. South Australia The transitional provisions in the Environment Protection (Miscellaneous) Amendment Act 2005 enable the NEPM to continue to operate as an environment protection policy. Tasmania The NEPM is a state policy under the State Policies and Projects Act 1993. The management of ambient air quality is an objective of the Tasmanian Air Quality Strategy 2006. Implementation is through the Environment Protection Policy (Air Quality) 2004 and the Environmental Management Pollution Control Act 1994. Australian Capital Territory The NEPM is implemented by the Environment Protection Regulation 1997 under the Environment Protection Act 1997. Northern Territory The key legislative instruments are the Northern Territory Environment Protection Authority Act 2012 and the National Environment Protection Council (Northern Territory) Act 2004. Source: National Environmental Protection Council 2012-13 Annual Report, p38. 32 Clearing the air www.envirojustice.org.au Sources for Infographics Number Crunch infographic Begg, Vos, Barker, Stevenson, Stanley & Lopez, The burden of disease and injury in Australia 2003, Australian Institute of Health and Welfare, Cat. no. PHE 82, Canberra (2007), p234, available at http://www.aihw.gov.au/publicationdetail/?id=6442467990. Bureau of Transport and Regional Economics, Health impacts of transport emissions in Australia: Economic Costs, Working Paper no. 63, Bureau of Transport and Regional Economics. Department of Transport and Regional Services, Canberra (2005), p100. Department of Environment and Conservation (NSW), Air Pollution Economics: Health Costs of Air Pollution in the Greater Sydney Metropolitan Region, Sydney (2005), p43. Australian Network of Environmental Defenders Officers, Submission no 85 to Senate Community Affairs References Committee, Parliament of Australia, Impacts on Health of Air Quality in Australia, 2013. World Health Organization, Health Aspects of Air Pollution with Particulate Matter, Ozone and Nitrogen Dioxide, Report on WHO Working Group (2003) pp5–6. Health Impacts infographic Doctors for the Environment Australia, Submission no 4 to Senate Community Affairs References Committee, Parliament of Australia, Impacts on Health of Air Quality in Australia, 2013 Australian Medical Association, Submission no 114 to Senate Community Affairs References Committee, Parliament of Australia, Impacts on Health of Air Quality in Australia, 2013 Centre for Air Quality & Health Research and Evaluation, submission no 29 to Senate Community Affairs References Committee, Parliament of Australia, Impacts on Health of Air Quality in Australia, 2013 Air pollution hot spots infographic Hunter Valley Hunter Community Environment Centre, Premier urged to control air pollution in 2014: 50% increase in air pollution breaches in Newcastle and the Hunter, Media Release (28 December 2013) available at http://www.hcec.org. au/20140119/premier-urged-control-air-pollution-2014-50-increase-air-pollution-breaches-newcastle-and Morwell National Pollutant Inventory data at www.npi.gov.au EPA Victoria, Morwell Air Monitoring Results http://www.epa.vic.gov.au/air-quality-latrobe-valley-mine-fire/sampling- results/air-monitoring-results Whyalla Government of South Australia Department of Health, Whyalla Health Impact Study Report (undated) http://www. health.sa.gov.au/pehs/whyalla/071203-Whyalla-report.pdf www.envirojustice.org.au Clearing the air 33 Port Pirie Mark Taylor, The Conversation Lead poisoning of Port Pirie children: a long history of looking the other way (19 July 2012) http://theconversation.com/lead-poisoning-of-port-pirie-children-a-long-history-of-looking-the-other-way-8296 Mt Isa Queensland Health. Health Indicators 2009 – Mount Isa Health Service District. Tropical Population Health Service. 2009 http://www.health.qld.gov.au/ph/documents/tphn/healthindicatorsmihsd.pdf Queensland Health, Mt Isa Community Lead Screening Program 2006-7 Tropical Population Health Service. 2008 http:// www.health.qld.gov.au/ph/documents/tphn/mtisa_leadrpt.pdf Port Hedland Mike Foley �Dust management keeps up with development at Port Hedland’, The Australian Journal of Mining, January/ February 2011 Joseph, D., Scott, K., Greene, R., Stelcer, E. (2011). Assessment of aeolian dust properties in the Port Hedland area and implications for future air quality management strategies. 20th International Clean Air and Environment Conference (CASANZ 2011), 31 July-2nd August 2011, Auckland, New Zealand Yarraville EPA Victoria, Francis Street Monitoring Program - Final report, Publication 1546.1, 10 December 2013. Brisbane Courier Mail, Boost in coal train movements through Brisbane reversed amid dust fears. (14 September 2014) http:// www.couriermail.com.au/news/queensland/boost-in-coal-train-movements-through-brisbane-reversed-amid-dustfears/story-fnihsrf2-1226718823757 Brooklyn (Melbourne) EPA Victoria, Year 3 of air monitoring at Brooklyn (November 2011 to October 2012) Publication 1552 October 2013 http://www.epa.vic.gov.au/~/media/Publications/1552.pdf Port Augusta Doctors for the Environment Australia, Illness and Pollution at Port Augusta. 2 May 2012 http://dea.org.au/news/article/ illness_and_pollution_at_port_augusta_dea_speaks_at_the_parliament_of_south Anglesea National Pollutant Inventory data at www.npi.gov.au Gladstone Queensland Health, Clean and Healthy Air for Gladstone Project - Human health risk assessment final public health report, 4 August 2010 34 Clearing the air www.envirojustice.org.au Political delay and preventable deaths infographic National Environment Protection (Ambient Air Quality) Measure Variation, 2003. National Environment Protection (Ambient Air Quality) Measure 2003; National Environmental Protection Council, Ambient Air Quality NEPM Review, Adelaide (2011). National Environment Protection Council, Review of the National Environment Protection (Ambient Air Quality) Measure, Discussion Paper (2007). National Environmental Protection Council, Ambient Air Quality NEPM Review, Adelaide (2011). COAG Standing Council on Environment and Water, Statement on National Plan for Clear Air (31 May 2012). COAG Standing Council on Environment and Water, Environment and Water Ministers focus on national priorities, Communique (16 September 2011). Agreed Statement - Environment Ministers meeting (29 April 2014) available at http://www.environment.gov.au/minister/ hunt/2014/mr20140429.html. www.envirojustice.org.au Clearing the air 35
© Copyright 2026 Paperzz