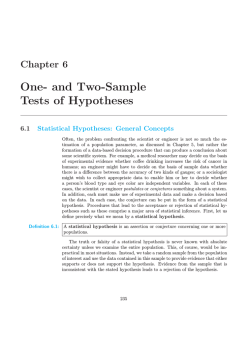
9 Tests of Hypotheses for a Single Sample CHAPTER OUTLINE 9-1 HYPOTHESIS TESTING 9-1.1 Statistical Hypotheses 9-1.2 Tests of Statistical Hypotheses 9-1.3 One-Sided and Two-Sided Hypotheses 9-1.4 General Procedure for Hypothesis Tests 9-2 TESTS ON THE MEAN OF A NORMAL DISTRIBUTION, VARIANCE KNOWN 9-2.1 Hypothesis Tests on the Mean 9-2.2 P-Values in Hypothesis Tests 9-2.3 Connection between Hypothesis Tests and Confidence Intervals 9-2.4 Type II Error and Choice of Sample Size 9-2.5 Large-Sample Test 9-2.6 Some Practical Comments on Hypothesis Tests 9-3 TESTS ON THE MEAN OF A NORMAL DISTRIBUTION, VARIANCE UNKNOWN 9-3.1 Hypothesis Tests on the Mean 9-3.3 Choice of Sample Size 9-3.4 Likelihood Ratio Approach to Development of Test Procedures (CD Only) 9-4 HYPOTHESIS TESTS ON THE VARIANCE AND STANDARD DEVIATION OF A NORMAL POPULATION 9-4.1 The Hypothesis Testing Procedures 9-4.2 вђ¤-Error and Choice of Sample Size 9-5 TESTS ON A POPULATION PROPORTION 9-5.1 Large-Sample Tests on a Proportion 9-5.2 Small-Sample Tests on a Proportion (CD Only) 9-5.3 Type II Error and Choice of Sample Size 9-6 SUMMARY TABLE OF INFERENCE PROCEDURES FOR A SINGLE SAMPLE 9-7 TESTING FOR GOODNESS OF FIT 9-8 CONTINGENCY TABLE TESTS 9-3.2 P-Value for a t-Test 277 278 CHAPTER 9 TESTS OF HYPOTHESES FOR A SINGLE SAMPLE LEARNING OBJECTIVES After careful study of this chapter, you should be able to do the following: 1. Structure engineering decision-making problems as hypothesis tests 2. Test hypotheses on the mean of a normal distribution using either a Z-test or a t-test procedure 3. Test hypotheses on the variance or standard deviation of a normal distribution 4. Test hypotheses on a population proportion 5. Use the P-value approach for making decisions in hypotheses tests 6. Compute power, type II error probability, and make sample size selection decisions for tests on means, variances, and proportions 7. Explain and use the relationship between confidence intervals and hypothesis tests 8. Use the chi-square goodness of fit test to check distributional assumptions 9. Use contingency table tests CD MATERIAL 10. Appreciate the likelihood ratio approach to construction of test statistics 11. Conduct small sample tests on a population proportion Answers for many odd numbered exercises are at the end of the book. Answers to exercises whose numbers are surrounded by a box can be accessed in the e-Text by clicking on the box. Complete worked solutions to certain exercises are also available in the e-Text. These are indicated in the Answers to Selected Exercises section by a box around the exercise number. Exercises are also available for some of the text sections that appear on CD only. These exercises may be found within the e-Text immediately following the section they accompany. 9-1 9-1.1 HYPOTHESIS TESTING Statistical Hypotheses In the previous chapter we illustrated how to construct a confidence interval estimate of a parameter from sample data. However, many problems in engineering require that we decide whether to accept or reject a statement about some parameter. The statement is called a hypothesis, and the decision-making procedure about the hypothesis is called hypothesis testing. This is one of the most useful aspects of statistical inference, since many types of decision-making problems, tests, or experiments in the engineering world can be formulated as hypothesis-testing problems. Furthermore, as we will see, there is a very close connection between hypothesis testing and confidence intervals. Statistical hypothesis testing and confidence interval estimation of parameters are the fundamental methods used at the data analysis stage of a comparative experiment, in which the engineer is interested, for example, in comparing the mean of a population to a specified value. These simple comparative experiments are frequently encountered in practice and provide a good foundation for the more complex experimental design problems that we will discuss in Chapters 13 and 14. In this chapter we discuss comparative experiments involving a single population, and our focus is on testing hypotheses concerning the parameters of the population. We now give a formal definition of a statistical hypothesis. Definition A statistical hypothesis is a statement about the parameters of one or more populations. 9-1 HYPOTHESIS TESTING 279 Since we use probability distributions to represent populations, a statistical hypothesis may also be thought of as a statement about the probability distribution of a random variable. The hypothesis will usually involve one or more parameters of this distribution. For example, suppose that we are interested in the burning rate of a solid propellant used to power aircrew escape systems. Now burning rate is a random variable that can be described by a probability distribution. Suppose that our interest focuses on the mean burning rate (a parameter of this distribution). Specifically, we are interested in deciding whether or not the mean burning rate is 50 centimeters per second. We may express this formally as H0: вђ® П 50 centimeters per second H1: вђ® 50 centimeters per second (9-1) The statement H0: вђ® П 50 centimeters per second in Equation 9-1 is called the null hypothesis, and the statement H1: вђ® 50 centimeters per second is called the alternative hypothesis. Since the alternative hypothesis specifies values of вђ® that could be either greater or less than 50 centimeters per second, it is called a two-sided alternative hypothesis. In some situations, we may wish to formulate a one-sided alternative hypothesis, as in H0: вђ® П 50 centimeters per second H0: вђ® П 50 centimeters per second or H1: вђ® ПЅ 50 centimeters per second (9-2) H1: вђ® Пѕ 50 centimeters per second It is important to remember that hypotheses are always statements about the population or distribution under study, not statements about the sample. The value of the population parameter specified in the null hypothesis (50 centimeters per second in the above example) is usually determined in one of three ways. First, it may result from past experience or knowledge of the process, or even from previous tests or experiments. The objective of hypothesis testing then is usually to determine whether the parameter value has changed. Second, this value may be determined from some theory or model regarding the process under study. Here the objective of hypothesis testing is to verify the theory or model. A third situation arises when the value of the population parameter results from external considerations, such as design or engineering specifications, or from contractual obligations. In this situation, the usual objective of hypothesis testing is conformance testing. A procedure leading to a decision about a particular hypothesis is called a test of a hypothesis. Hypothesis-testing procedures rely on using the information in a random sample from the population of interest. If this information is consistent with the hypothesis, we will conclude that the hypothesis is true; however, if this information is inconsistent with the hypothesis, we will conclude that the hypothesis is false. We emphasize that the truth or falsity of a particular hypothesis can never be known with certainty, unless we can examine the entire population. This is usually impossible in most practical situations. Therefore, a hypothesis-testing procedure should be developed with the probability of reaching a wrong conclusion in mind. The structure of hypothesis-testing problems is identical in all the applications that we will consider. The null hypothesis is the hypothesis we wish to test. Rejection of the null hypothesis always leads to accepting the alternative hypothesis. In our treatment of hypothesis testing, the null hypothesis will always be stated so that it specifies an exact value of the parameter (as in the statement H0: вђ® П 50 centimeters per second in Equation 9-1). The alternate hypothesis will allow the parameter to take on several values (as in the statement H1: вђ® 50 centimeters per second in Equation 9-1). Testing the hypothesis involves taking a random sample, computing a test statistic from the sample data, and then using the test statistic to make a decision about the null hypothesis. 280 CHAPTER 9 TESTS OF HYPOTHESES FOR A SINGLE SAMPLE 9-1.2 Tests of Statistical Hypotheses To illustrate the general concepts, consider the propellant burning rate problem introduced earlier. The null hypothesis is that the mean burning rate is 50 centimeters per second, and the alternate is that it is not equal to 50 centimeters per second. That is, we wish to test H0: вђ® П 50 centimeters per second H1: вђ® 50 centimeters per second Suppose that a sample of n П 10 specimens is tested and that the sample mean burning rate x is observed. The sample mean is an estimate of the true population mean вђ®. A value of the sample mean x that falls close to the hypothesized value of вђ® П 50 centimeters per second is evidence that the true mean вђ® is really 50 centimeters per second; that is, such evidence supports the null hypothesis H0. On the other hand, a sample mean that is considerably different from 50 centimeters per second is evidence in support of the alternative hypothesis H1. Thus, the sample mean is the test statistic in this case. The sample mean can take on many different values. Suppose that if 48.5 Х… x Х… 51.5, we will not reject the null hypothesis H0: вђ® П 50 , and if either x ПЅ 48.5 or x Пѕ 51.5, we will reject the null hypothesis in favor of the alternative hypothesis H1: вђ® 50 . This is illustrated in Fig. 9-1. The values of x that are less than 48.5 and greater than 51.5 constitute the critical region for the test, while all values that are in the interval 48.5 Х… x Х… 51.5 form a region for which we will fail to reject the null hypothesis. By convention, this is usually called the acceptance region. The boundaries between the critical regions and the acceptance region are called the critical values. In our example the critical values are 48.5 and 51.5. It is customary to state conclusions relative to the null hypothesis H0. Therefore, we reject H0 in favor of H1 if the test statistic falls in the critical region and fail to reject H0 otherwise. This decision procedure can lead to either of two wrong conclusions. For example, the true mean burning rate of the propellant could be equal to 50 centimeters per second. However, for the randomly selected propellant specimens that are tested, we could observe a value of the test statistic x that falls into the critical region. We would then reject the null hypothesis H0 in favor of the alternate H1 when, in fact, H0 is really true. This type of wrong conclusion is called a type I error. Definition Rejecting the null hypothesis H0 when it is true is defined as a type I error. Now suppose that the true mean burning rate is different from 50 centimeters per second, yet the sample mean x falls in the acceptance region. In this case we would fail to reject H0 when it is false. This type of wrong conclusion is called a type II error. Definition Failing to reject the null hypothesis when it is false is defined as a type II error. Thus, in testing any statistical hypothesis, four different situations determine whether the final decision is correct or in error. These situations are presented in Table 9-1. 9-1 HYPOTHESIS TESTING Reject H0 Fail to Reject H0 Reject H0 Вµ в‰ 50 cm/s Вµ = 50 cm/s Вµ в‰ 50 cm/s 48.5 50 Table 9-1 Decisions in Hypothesis Testing x 51.5 281 Figure 9-1 Decision criteria for testing H0: вђ® П 50 centimeters per second versus H1: вђ® 50 centimeters per second. Decision H0 Is True H0 Is False Fail to reject H0 Reject H0 no error type I error type II error no error Because our decision is based on random variables, probabilities can be associated with the type I and type II errors in Table 9-1. The probability of making a type I error is denoted by the Greek letter вђЈ. That is, вђЈ П P(type I error) П P(reject H0 when H0 is true) (9-3) Sometimes the type I error probability is called the significance level, or the вђЈ-error, or the size of the test. In the propellant burning rate example, a type I error will occur when either x Пѕ 51.5 or x ПЅ 48.5 when the true mean burning rate is вђ® П 50 centimeters per second. Suppose that the standard deviation of burning rate is вђґ П 2.5 centimeters per second and that the burning rate has a distribution for which the conditions of the central limit theorem apply, so the distribution of the sample mean is approximately normal with mean вђ® П 50 and standard deviation вђґЦЂ 1n П 2.5 ЦЂ 110 П 0.79. The probability of making a type I error (or the significance level of our test) is equal to the sum of the areas that have been shaded in the tails of the normal distribution in Fig. 9-2. We may find this probability as вђЈ П P1X ПЅ 48.5 when вђ® П 502 П© P1X Пѕ 51.5 when вђ® П 502 The z-values that correspond to the critical values 48.5 and 51.5 are z1 П 48.5 ПЄ 50 П ПЄ1.90 0.79 and z2 П 51.5 ПЄ 50 П 1.90 0.79 Therefore вђЈ П P1Z ПЅ ПЄ1.902 П© P1Z Пѕ 1.902 П 0.028717 П© 0.028717 П 0.057434 This implies that 5.76% of all random samples would lead to rejection of the hypothesis H0: вђ® П 50 centimeters per second when the true mean burning rate is really 50 centimeters per second. О± /2 = 0.0287 О± /2 = 0.0287 48.5 Вµ = 50 51.5 X Figure 9-2 The critical region for H0: вђ® П 50 versus H1: вђ® 50 and n П 10. 282 CHAPTER 9 TESTS OF HYPOTHESES FOR A SINGLE SAMPLE From inspection of Fig. 9-2, notice that we can reduce вђЈ by widening the acceptance region. For example, if we make the critical values 48 and 52, the value of вђЈ is 52 ПЄ 50 48 ПЄ 50 b П© P aZ Пѕ b П P1Z ПЅ ПЄ2.532 П© P1Z Пѕ 2.532 0.79 0.79 П 0.0057 П© 0.0057 П 0.0114 вђЈ П P aZ ПЅ We could also reduce вђЈ by increasing the sample size. If n П 16, вђґЦЂ 1n П 2.5 ЦЂ 116 П 0.625, and using the original critical region from Fig. 9-1, we find z1 П 48.5 ПЄ 50 П ПЄ2.40 0.625 and z2 П 51.5 ПЄ 50 П 2.40 0.625 Therefore вђЈ П P1Z ПЅ ПЄ2.402 П© P1Z Пѕ 2.402 П 0.0082 П© 0.0082 П 0.0164 In evaluating a hypothesis-testing procedure, it is also important to examine the probability of a type II error, which we will denote by вђ¤. That is, вђ¤ П P(type II error) П P(fail to reject H0 when H0 is false) (9-4) To calculate вђ¤ (sometimes called the вђ¤-error), we must have a specific alternative hypothesis; that is, we must have a particular value of вђ®. For example, suppose that it is important to reject the null hypothesis H0: вђ® П 50 whenever the mean burning rate вђ® is greater than 52 centimeters per second or less than 48 centimeters per second. We could calculate the probability of a type II error вђ¤ for the values вђ® П 52 and вђ® П 48 and use this result to tell us something about how the test procedure would perform. Specifically, how will the test procedure work if we wish to detect, that is, reject H0, for a mean value of вђ® П 52 or вђ® П 48? Because of symmetry, it is necessary only to evaluate one of the two cases—say, find the probability of accepting the null hypothesis H0: вђ® П 50 centimeters per second when the true mean is вђ® П 52 centimeters per second. Figure 9-3 will help us calculate the probability of type II error вђ¤. The normal distribution on the left in Fig. 9-3 is the distribution of the test statistic X when the null hypothesis H0: вђ® П 50 is true (this is what is meant by the expression “under H0: вђ® П 50”), and the normal distribution on the right is the distribution of X when the alternative hypothesis is true and the value of the mean is 52 (or “under H1: вђ® П 52”). Now a type II error will be committed if the sample mean X falls between 48.5 and 51.5 (the critical region boundaries) when вђ® П 52. As seen in Fig. 9-3, this is just the probability that 48.5 Х… X Х… 51.5 when the true mean is вђ® П 52, or the shaded area under the normal distribution on the right. Therefore, referring to Fig. 9-3, we find that вђ¤ П P148.5 Х… X Х… 51.5 when вђ® П 522 283 9-1 HYPOTHESIS TESTING 0.6 0.6 Under H1:Вµ = 52 Under H0: Вµ = 50 0.5 Probability density Probability density 0.5 0.4 0.3 0.2 Under H1: Вµ = 50.5 0.4 0.3 0.2 0.1 0.1 0 46 Under H0: Вµ = 50 48 50 52 54 0 46 56 48 50 – x Figure 9-3 The probability of type II error when вђ® П 52 and n П 10. 52 54 56 – x Figure 9-4 The probability of type II error when вђ® П 50.5 and n П 10. The z-values corresponding to 48.5 and 51.5 when вђ® П 52 are z1 П Therefore 48.5 ПЄ 52 П ПЄ4.43 0.79 and z2 П 51.5 ПЄ 52 П ПЄ0.63 0.79 вђ¤ П P 1ПЄ4.43 Х… Z Х… ПЄ0.632 П P 1Z Х… ПЄ0.632 ПЄ P 1Z Х… ПЄ4.432 П 0.2643 ПЄ 0.0000 П 0.2643 Thus, if we are testing H0: вђ® П 50 against H1: вђ® 50 with n П 10, and the true value of the mean is вђ® П 52, the probability that we will fail to reject the false null hypothesis is 0.2643. By symmetry, if the true value of the mean is вђ® П 48, the value of вђ¤ will also be 0.2643. The probability of making a type II error вђ¤ increases rapidly as the true value of вђ® approaches the hypothesized value. For example, see Fig. 9-4, where the true value of the mean is вђ® П 50.5 and the hypothesized value is H0: вђ® П 50. The true value of вђ® is very close to 50, and the value for вђ¤ is вђ¤ П P 148.5 Х… X Х… 51.5 when вђ® П 50.52 As shown in Fig. 9-4, the z-values corresponding to 48.5 and 51.5 when вђ® П 50.5 are z1 П 48.5 ПЄ 50.5 П ПЄ2.53 0.79 and z2 П 51.5 ПЄ 50.5 П 1.27 0.79 Therefore вђ¤ П P1ПЄ2.53 Х… Z Х… 1.272 П P1Z Х… 1.272 ПЄ P1Z Х… ПЄ2.532 П 0.8980 ПЄ 0.0057 П 0.8923 Thus, the type II error probability is much higher for the case where the true mean is 50.5 centimeters per second than for the case where the mean is 52 centimeters per second. Of course, 284 CHAPTER 9 TESTS OF HYPOTHESES FOR A SINGLE SAMPLE 0.8 Under H1: Вµ = 52 Probability density Under H0: Вµ = 50 0.6 0.4 0.2 Figure 9-5 The probability of type II error when вђ® П 52 and n П 16. 0 46 48 50 52 54 56 x– in many practical situations we would not be as concerned with making a type II error if the mean were “close” to the hypothesized value. We would be much more interested in detecting large differences between the true mean and the value specified in the null hypothesis. The type II error probability also depends on the sample size n. Suppose that the null hypothesis is H0: вђ® П 50 centimeters per second and that the true value of the mean is вђ® П 52. If the sample size is increased from n П 10 to n П 16, the situation of Fig. 9-5 results. The normal distribution on the left is the distribution of X when the mean вђ® П 50, and the normal distribution on the right is the distribution of X when вђ® П 52. As shown in Fig. 9-5, the type II error probability is вђ¤ П P 148.5 Х… X Х… 51.5 when вђ® П 522 When n П 16, the standard deviation of X is вђґЦЂ 1n П 2.5 ЦЂ 116 П 0.625, and the z-values corresponding to 48.5 and 51.5 when вђ® П 52 are z1 П 48.5 ПЄ 52 П ПЄ5.60 0.625 and z2 П 51.5 ПЄ 52 П ПЄ0.80 0.625 Therefore вђ¤ П P1ПЄ5.60 Х… Z Х… ПЄ0.802 П P1Z Х… ПЄ0.802 ПЄ P1Z Х… ПЄ5.602 П 0.2119 ПЄ 0.0000 П 0.2119 Recall that when n П 10 and вђ® П 52, we found that вђ¤ П 0.2643; therefore, increasing the sample size results in a decrease in the probability of type II error. The results from this section and a few other similar calculations are summarized in the following table: Acceptance Region Sample Size 48.5 ПЅ x ПЅ 51.5 10 0.0576 0.2643 0.8923 10 0.0114 0.5000 0.9705 16 0.0164 0.2119 0.9445 16 0.0014 0.5000 0.9918 48 ПЅ x ПЅ 52 48.5 ПЅ x ПЅ 51.5 48 ПЅ x ПЅ 52 вђЈ вђ¤ at вђ® П 52 вђ¤ at вђ® П 50.5 9-1 HYPOTHESIS TESTING 285 The results in boxes were not calculated in the text but can easily be verified by the reader. This display and the discussion above reveal four important points: The size of the critical region, and consequently the probability of a type I error вђЈ, can always be reduced by appropriate selection of the critical values. 2. Type I and type II errors are related. A decrease in the probability of one type of error always results in an increase in the probability of the other, provided that the sample size n does not change. 3. An increase in sample size will generally reduce both вђЈ and вђ¤, provided that the critical values are held constant. 4. When the null hypothesis is false, вђ¤ increases as the true value of the parameter approaches the value hypothesized in the null hypothesis. The value of вђ¤ decreases as the difference between the true mean and the hypothesized value increases. 1. Generally, the analyst controls the type I error probability вђЈ when he or she selects the critical values. Thus, it is usually easy for the analyst to set the type I error probability at (or near) any desired value. Since the analyst can directly control the probability of wrongly rejecting H0, we always think of rejection of the null hypothesis H0 as a strong conclusion. On the other hand, the probability of type II error вђ¤ is not a constant, but depends on the true value of the parameter. It also depends on the sample size that we have selected. Because the type II error probability вђ¤ is a function of both the sample size and the extent to which the null hypothesis H0 is false, it is customary to think of the decision to accept H0 as a weak conclusion, unless we know that вђ¤ is acceptably small. Therefore, rather than saying we “accept H0”, we prefer the terminology “fail to reject H0”. Failing to reject H0 implies that we have not found sufficient evidence to reject H0, that is, to make a strong statement. Failing to reject H0 does not necessarily mean that there is a high probability that H0 is true. It may simply mean that more data are required to reach a strong conclusion. This can have important implications for the formulation of hypotheses. An important concept that we will make use of is the power of a statistical test. Definition The power of a statistical test is the probability of rejecting the null hypothesis H0 when the alternative hypothesis is true. The power is computed as 1 ПЄ вђ¤, and power can be interpreted as the probability of correctly rejecting a false null hypothesis. We often compare statistical tests by comparing their power properties. For example, consider the propellant burning rate problem when we are testing H0: вђ® П 50 centimeters per second against H1: вђ® 50 centimeters per second. Suppose that the true value of the mean is вђ® П 52. When n П 10, we found that вђ¤ П 0.2643, so the power of this test is 1 ПЄ вђ¤ П 1 ПЄ 0.2643 П 0.7357 when вђ® П 52. Power is a very descriptive and concise measure of the sensitivity of a statistical test, where by sensitivity we mean the ability of the test to detect differences. In this case, the sensitivity of the test for detecting the difference between a mean burning rate of 50 centimeters per second and 52 centimeters per second is 0.7357. That is, if the true mean is really 52 centimeters per second, this test will correctly reject H0: вђ® П 50 and “detect” this difference 73.57% of the time. If this value of power is judged to be too low, the analyst can increase either вђЈ or the sample size n. 286 9-1.3 CHAPTER 9 TESTS OF HYPOTHESES FOR A SINGLE SAMPLE One-Sided and Two-Sided Hypotheses A test of any hypothesis such as H0: вђ® П вђ®0 H1: вђ® вђ®0 is called a two-sided test, because it is important to detect differences from the hypothesized value of the mean вђ®0 that lie on either side of вђ®0 . In such a test, the critical region is split into two parts, with (usually) equal probability placed in each tail of the distribution of the test statistic. Many hypothesis-testing problems naturally involve a one-sided alternative hypothesis, such as H0: вђ® П вђ®0 H1: вђ® Пѕ вђ®0 or H0: вђ® П вђ®0 H1: вђ® ПЅ вђ®0 If the alternative hypothesis is H1: вђ® Пѕ вђ®0 , the critical region should lie in the upper tail of the distribution of the test statistic, whereas if the alternative hypothesis is H1: вђ® ПЅ вђ®0, the critical region should lie in the lower tail of the distribution. Consequently, these tests are sometimes called one-tailed tests. The location of the critical region for one-sided tests is usually easy to determine. Simply visualize the behavior of the test statistic if the null hypothesis is true and place the critical region in the appropriate end or tail of the distribution. Generally, the inequality in the alternative hypothesis “points” in the direction of the critical region. In constructing hypotheses, we will always state the null hypothesis as an equality so that the probability of type I error вђЈ can be controlled at a specific value. The alternative hypothesis might be either one-sided or two-sided, depending on the conclusion to be drawn if H0 is rejected. If the objective is to make a claim involving statements such as greater than, less than, superior to, exceeds, at least, and so forth, a one-sided alternative is appropriate. If no direction is implied by the claim, or if the claim not equal to is to be made, a two-sided alternative should be used. EXAMPLE 9-1 Consider the propellant burning rate problem. Suppose that if the burning rate is less than 50 centimeters per second, we wish to show this with a strong conclusion. The hypotheses should be stated as H0: вђ® П 50 centimeters per second H1: вђ® ПЅ 50 centimeters per second Here the critical region lies in the lower tail of the distribution of X . Since the rejection of H0 is always a strong conclusion, this statement of the hypotheses will produce the desired outcome if H0 is rejected. Notice that, although the null hypothesis is stated with an equal sign, it is understood to include any value of вђ® not specified by the alternative hypothesis. Therefore, failing to reject H0 does not mean that вђ® П 50 centimeters per second exactly, but only that we do not have strong evidence in support of H1. In some real-world problems where one-sided test procedures are indicated, it is occasionally difficult to choose an appropriate formulation of the alternative hypothesis. For example, suppose that a soft-drink beverage bottler purchases 10-ounce bottles from a glass 9-1 HYPOTHESIS TESTING 287 company. The bottler wants to be sure that the bottles meet the specification on mean internal pressure or bursting strength, which for 10-ounce bottles is a minimum strength of 200 psi. The bottler has decided to formulate the decision procedure for a specific lot of bottles as a hypothesis testing problem. There are two possible formulations for this problem, either H0: вђ® П 200 psi H1: вђ® Пѕ 200 psi (9-5) or H0: вђ® П 200 psi H1: вђ® ПЅ 200 psi (9-6) Consider the formulation in Equation 9-5. If the null hypothesis is rejected, the bottles will be judged satisfactory; if H0 is not rejected, the implication is that the bottles do not conform to specifications and should not be used. Because rejecting H0 is a strong conclusion, this formulation forces the bottle manufacturer to “demonstrate” that the mean bursting strength of the bottles exceeds the specification. Now consider the formulation in Equation 9-6. In this situation, the bottles will be judged satisfactory unless H0 is rejected. That is, we conclude that the bottles are satisfactory unless there is strong evidence to the contrary. Which formulation is correct, the one of Equation 9-5 or Equation 9-6? The answer is it depends. For Equation 9-5, there is some probability that H0 will not be rejected (i.e., we would decide that the bottles are not satisfactory), even though the true mean is slightly greater than 200 psi. This formulation implies that we want the bottle manufacturer to demonstrate that the product meets or exceeds our specifications. Such a formulation could be appropriate if the manufacturer has experienced difficulty in meeting specifications in the past or if product safety considerations force us to hold tightly to the 200 psi specification. On the other hand, for the formulation of Equation 9-6 there is some probability that H0 will be accepted and the bottles judged satisfactory, even though the true mean is slightly less than 200 psi. We would conclude that the bottles are unsatisfactory only when there is strong evidence that the mean does not exceed 200 psi, that is, when H0: вђ® П 200 psi is rejected. This formulation assumes that we are relatively happy with the bottle manufacturer’s past performance and that small deviations from the specification of вђ® Х† 200 psi are not harmful. In formulating one-sided alternative hypotheses, we should remember that rejecting H0 is always a strong conclusion. Consequently, we should put the statement about which it is important to make a strong conclusion in the alternative hypothesis. In real-world problems, this will often depend on our point of view and experience with the situation. 9-1.4 General Procedure for Hypothesis Tests This chapter develops hypothesis-testing procedures for many practical problems. Use of the following sequence of steps in applying hypothesis-testing methodology is recommended. 1. From the problem context, identify the parameter of interest. 2. State the null hypothesis, H0. 3. 4. Specify an appropriate alternative hypothesis, H1. Choose a significance level вђЈ. 288 CHAPTER 9 TESTS OF HYPOTHESES FOR A SINGLE SAMPLE 5. 6. 7. 8. Determine an appropriate test statistic. State the rejection region for the statistic. Compute any necessary sample quantities, substitute these into the equation for the test statistic, and compute that value. Decide whether or not H0 should be rejected and report that in the problem context. Steps 1–4 should be completed prior to examination of the sample data. This sequence of steps will be illustrated in subsequent sections. EXERCISES FOR SECTION 9-1 9-1. In each of the following situations, state whether it is a correctly stated hypothesis testing problem and why. (a) H0: вђ® П 25, H1: вђ® 25 (b) H0: вђґ Пѕ 10, H1: вђґ П 10 (c) H0: x П 50, H1: x 50 (d) H0: p П 0.1, H1: p П 0.5 (e) H0: s П 30, H1: s Пѕ 30 9-2. A textile fiber manufacturer is investigating a new drapery yarn, which the company claims has a mean thread elongation of 12 kilograms with a standard deviation of 0.5 kilograms. The company wishes to test the hypothesis H0: вђ® П 12 against H1: вђ® ПЅ 12, using a random sample of four specimens. (a) What is the type I error probability if the critical region is defined as x ПЅ 11.5 kilograms? (b) Find вђ¤ for the case where the true mean elongation is 11.25 kilograms. 9-3. Repeat Exercise 9-2 using a sample size of n = 16 and the same critical region. 9-4. In Exercise 9-2, find the boundary of the critical region if the type I error probability is specified to be вђЈ П 0.01. 9-5. In Exercise 9-2, find the boundary of the critical region if the type I error probability is specified to be 0.05. 9-6. The heat evolved in calories per gram of a cement mixture is approximately normally distributed. The mean is thought to be 100 and the standard deviation is 2. We wish to test H0: вђ® П 100 versus H1: вђ® 100 with a sample of n = 9 specimens. (a) If the acceptance region is defined as 98.5 Х… x Х… 101.5 , find the type I error probability вђЈ. (b) Find вђ¤ for the case where the true mean heat evolved is 103. (c) Find вђ¤ for the case where the true mean heat evolved is 105. This value of вђ¤ is smaller than the one found in part (b) above. Why? 9-7. Repeat Exercise 9-6 using a sample size of n П 5 and the same acceptance region. 9-8. A consumer products company is formulating a new shampoo and is interested in foam height (in millimeters). Foam height is approximately normally distributed and has a standard deviation of 20 millimeters. The company wishes to test H0: вђ® П 175 millimeters versus H1: вђ® Пѕ 175 millimeters, using the results of n П 10 samples. (a) Find the type I error probability вђЈ if the critical region is x Пѕ 185 . (b) What is the probability of type II error if the true mean foam height is 195 millimeters? 9-9. In Exercise 9-8, suppose that the sample data result in x П 190 millimeters. (a) What conclusion would you reach? (b) How “unusual” is the sample value x П 190 millimeters if the true mean is really 175 millimeters? That is, what is the probability that you would observe a sample average as large as 190 millimeters (or larger), if the true mean foam height was really 175 millimeters? 9-10. Repeat Exercise 9-8 assuming that the sample size is n П 16 and the boundary of the critical region is the same. 9-11. Consider Exercise 9-8, and suppose that the sample size is increased to n П 16. (a) Where would the boundary of the critical region be placed if the type I error probability were to remain equal to the value that it took on when n П 10? (b) Using n П 16 and the new critical region found in part (a), find the type II error probability вђ¤ if the true mean foam height is 195 millimeters. (c) Compare the value of вђ¤ obtained in part (b) with the value from Exercise 9-8 (b). What conclusions can you draw? 9-12. A manufacturer is interested in the output voltage of a power supply used in a PC. Output voltage is assumed to be normally distributed, with standard deviation 0.25 Volts, and the manufacturer wishes to test H0: вђ® П 5 Volts against H1: вђ® 5 Volts, using n П 8 units. (a) The acceptance region is 4.85 Х… x Х… 5.15. Find the value of вђЈ. (b) Find the power of the test for detecting a true mean output voltage of 5.1 Volts. 9-13. Rework Exercise 9-12 when the sample size is 16 and the boundaries of the acceptance region do not change. 9-14. Consider Exercise 9-12, and suppose that the manufacturer wants the type I error probability for the test to be вђЈ П 0.05. Where should the acceptance region be located? 9-2 TESTS ON THE MEAN OF A NORMAL DISTRIBUTION, VARIANCE KNOWN 9-15. If we plot the probability of accepting H0: вђ® П вђ®0 versus various values of вђ® and connect the points with a smooth curve, we obtain the operating characteristic curve (or the OC curve) of the test procedure. These curves are used extensively in industrial applications of hypothesis testing to display the sensitivity and relative performance of the test. When the true mean is really equal to вђ®0, the probability of accepting H0 is 1 ПЄ вђЈ. Construct an OC curve for Exercise 9-8, using values of the true mean вђ® of 178, 181, 184, 187, 190, 193, 196, and 199. 9-16. Convert the OC curve in Exercise 9-15 into a plot of the power function of the test. 9-17. A random sample of 500 registered voters in Phoenix is asked if they favor the use of oxygenated fuels year-round to reduce air pollution. If more than 400 voters respond positively, we will conclude that at least 60% of the voters favor the use of these fuels. (a) Find the probability of type I error if exactly 60% of the voters favor the use of these fuels. (b) What is the type II error probability вђ¤ if 75% of the voters favor this action? Hint: use the normal approximation to the binomial. 289 9-18. The proportion of residents in Phoenix favoring the building of toll roads to complete the freeway system is believed to be p П 0.3. If a random sample of 10 residents shows that 1 or fewer favor this proposal, we will conclude that p ПЅ 0.3. (a) Find the probability of type I error if the true proportion is p П 0.3. (b) Find the probability of committing a type II error with this procedure if p П 0.2. (c) What is the power of this procedure if the true proportion is p П 0.2? 9-19. The proportion of adults living in Tempe, Arizona, who are college graduates is estimated to be p П 0.4. To test this hypothesis, a random sample of 15 Tempe adults is selected. If the number of college graduates is between 4 and 8, the hypothesis will be accepted; otherwise, we will conclude that p 0.4 . (a) Find the type I error probability for this procedure, assuming that p П 0.4. (b) Find the probability of committing a type II error if the true proportion is really p П 0.2. 9-2 TESTS ON THE MEAN OF A NORMAL DISTRIBUTION, VARIANCE KNOWN In this section, we consider hypothesis testing about the mean вђ® of a single, normal population where the variance of the population вђґ2 is known. We will assume that a random sample X1, X2, p , Xn has been taken from the population. Based on our previous discussion, the sample mean X is an unbiased point estimator of вђ® with variance вђґ2 ЦЂn. 9-2.1 Hypothesis Tests on the Mean Suppose that we wish to test the hypotheses H0: вђ® П вђ®0 H1: вђ® вђ®0 (9-7) where вђ®0 is a specified constant. We have a random sample X1, X2, p , Xn from a normal population. Since X has a normal distribution (i.e., the sampling distribution of X is normal) with mean вђ®0 and standard deviation вђґЦЂ 1n if the null hypothesis is true, we could construct a critical region based on the computed value of the sample mean X , as in Section 9-1.2. It is usually more convenient to standardize the sample mean and use a test statistic based on the standard normal distribution. That is, the test procedure for H0: вђ® П вђ®0 uses the test statistic Z0 П X ПЄ вђ®0 вђґЦЂ 1n (9-8) 290 CHAPTER 9 TESTS OF HYPOTHESES FOR A SINGLE SAMPLE N(0,1) Critical region N(0,1) N(0,1) Critical region О± /2 О± /2 Acceptance region –zО± /2 0 zО± /2 Critical region О± Acceptance region Z0 0 (a) zО± О± Z0 Acceptance region –zО± (b) Z0 0 (c) Figure 9-6 The distribution of Z0 when H0: вђ® П вђ®0 is true, with critical region for (a) the two-sided alternative H1 : вђ® (b) the one-sided alternative H1 : вђ® Пѕ вђ®0, and (c) the one-sided alternative H1 : вђ® ПЅ вђ®0. вђ®0, If the null hypothesis H0: вђ® П вђ®0 is true, E1X 2 П вђ®0 , and it follows that the distribution of Z0 is the standard normal distribution [denoted N(0, 1)]. Consequently, if H0: вђ® П вђ®0 is true, the probability is 1 ПЄ вђЈ that the test statistic Z0 falls between ПЄzвђЈЦЂ2 and zвђЈЦЂ2 , where zвђЈЦЂ2 is the 100вђЈЦЂ2 percentage point of the standard normal distribution. The regions associated with zвђЈЦЂ2 and ПЄzвђЈЦЂ2 are illustrated in Fig. 9-6(a). Note that the probability is вђЈ that the test statistic Z0 will fall in the region Z0 Пѕ zвђЈЦЂ2 or Z0 ПЅ ПЄzвђЈЦЂ2 when H0: вђ® П вђ®0 is true. Clearly, a sample producing a value of the test statistic that falls in the tails of the distribution of Z0 would be unusual if H0: вђ® П вђ®0 is true; therefore, it is an indication that H0 is false. Thus, we should reject H0 if the observed value of the test statistic z0 is either z0 Пѕ zвђЈЦЂ2 or z0 ПЅ ПЄzвђЈЦЂ2 (9-9) ПЄzвђЈЦЂ2 Х… z0 Х… zвђЈЦЂ2 (9-10) and we should fail to reject H0 if The inequalities in Equation 9-10 defines the acceptance region for H0, and the two inequalities in Equation 9-9 define the critical region or rejection region. The type I error probability for this test procedure is вђЈ. It is easier to understand the critical region and the test procedure, in general, when the test statistic is Z0 rather than X . However, the same critical region can always be written in terms of the computed value of the sample mean x. A procedure identical to the above is as follows: Reject H0: вђ® П вђ®0 if either x Пѕ a or x ПЅ b where a П вђ®0 П© zвђЈЦЂ2вђґЦЂ 1n EXAMPLE 9-2 and b П вђ®0 ПЄ zвђЈЦЂ2вђґЦЂ 1n Aircrew escape systems are powered by a solid propellant. The burning rate of this propellant is an important product characteristic. Specifications require that the mean burning rate must be 50 centimeters per second. We know that the standard deviation of burning rate is вђґ П 2 centimeters per second. The experimenter decides to specify a type I error probability or significance level of вђЈ П 0.05 and selects a random sample of n П 25 and obtains a sample average burning rate of x П 51.3 centimeters per second. What conclusions should be drawn? 9-2 TESTS ON THE MEAN OF A NORMAL DISTRIBUTION, VARIANCE KNOWN 291 We may solve this problem by following the eight-step procedure outlined in Section 9-1.4. This results in 1. The parameter of interest is вђ®, the mean burning rate. 2. H0: вђ® П 50 centimeters per second 3. H1: вђ® 50 centimeters per second 4. вђЈ П 0.05 5. The test statistic is z0 П x ПЄ вђ®0 вђґЦЂ 1n 6. Reject H0 if z0 Пѕ 1.96 or if z0 ПЅ ПЄ1.96. Note that this results from step 4, where we specified вђЈ П 0.05, and so the boundaries of the critical region are at z0.025 П 1.96 and ПЄz0.025 П ПЄ1.96. 7. Computations: Since x П 51.3 and вђґ П 2, z0 П 8. 51.3 ПЄ 50 2 ЦЂ 225 П 3.25 Conclusion: Since z0 П 3.25 Пѕ 1.96, we reject H0: вђ® П 50 at the 0.05 level of significance. Stated more completely, we conclude that the mean burning rate differs from 50 centimeters per second, based on a sample of 25 measurements. In fact, there is strong evidence that the mean burning rate exceeds 50 centimeters per second. We may also develop procedures for testing hypotheses on the mean вђ® where the alternative hypothesis is one-sided. Suppose that we specify the hypotheses as H0: вђ® П вђ®0 H1: вђ® Пѕ вђ®0 (9-11) In defining the critical region for this test, we observe that a negative value of the test statistic Z0 would never lead us to conclude that H0: вђ® П вђ®0 is false. Therefore, we would place the critical region in the upper tail of the standard normal distribution and reject H0 if the computed value of z0 is too large. That is, we would reject H0 if z0 Пѕ zвђЈ (9-12) as shown in Figure 9-6(b). Similarly, to test H0: вђ® П вђ®0 H1: вђ® ПЅ вђ®0 (9-13) we would calculate the test statistic Z0 and reject H0 if the value of z0 is too small. That is, the critical region is in the lower tail of the standard normal distribution as shown in Figure 9-6(c), and we reject H0 if z0 ПЅ ПЄzвђЈ (9-14) 292 9-2.2 CHAPTER 9 TESTS OF HYPOTHESES FOR A SINGLE SAMPLE P-Values in Hypothesis Tests One way to report the results of a hypothesis test is to state that the null hypothesis was or was not rejected at a specified вђЈ-value or level of significance. For example, in the propellant problem above, we can say that H0: вђ® П 50 was rejected at the 0.05 level of significance. This statement of conclusions is often inadequate because it gives the decision maker no idea about whether the computed value of the test statistic was just barely in the rejection region or whether it was very far into this region. Furthermore, stating the results this way imposes the predefined level of significance on other users of the information. This approach may be unsatisfactory because some decision makers might be uncomfortable with the risks implied by вђЈ П 0.05. To avoid these difficulties the P-value approach has been adopted widely in practice. The P-value is the probability that the test statistic will take on a value that is at least as extreme as the observed value of the statistic when the null hypothesis H0 is true. Thus, a P-value conveys much information about the weight of evidence against H0, and so a decision maker can draw a conclusion at any specified level of significance. We now give a formal definition of a P-value. Definition The P-value is the smallest level of significance that would lead to rejection of the null hypothesis H0 with the given data. It is customary to call the test statistic (and the data) significant when the null hypothesis H0 is rejected; therefore, we may think of the P-value as the smallest level вђЈ at which the data are significant. Once the P-value is known, the decision maker can determine how significant the data are without the data analyst formally imposing a preselected level of significance. For the foregoing normal distribution tests it is relatively easy to compute the P-value. If z0 is the computed value of the test statistic, the P-value is 2 31 ПЄ вЊЅ1|z0|2 4 P П вЂў 1 ПЄ вЊЅ1z0 2 вЊЅ1z0 2 for a two-tailed test: H0: вђ® П вђ®0 for a upper-tailed test: H0: вђ® П вђ®0 for a lower-tailed test: H0: вђ® П вђ®0 H1: вђ® вђ®0 H1: вђ® Пѕ вђ®0 H1: вђ® ПЅ вђ®0 (9-15) Here, вЊЅ1z2 is the standard normal cumulative distribution function defined in Chapter 4. Recall that вЊЅ1z2 П P1Z Х… z2 , where Z is N(0, 1). To illustrate this, consider the propellant problem in Example 9-2. The computed value of the test statistic is z0 П 3.25 and since the alternative hypothesis is two-tailed, the P-value is P-value П 2 31 ПЄ вЊЅ13.252 4 П 0.0012 Thus, H0: вђ® П 50 would be rejected at any level of significance вђЈ Х† P-value П 0.0012. For example, H0 would be rejected if вђЈ П 0.01, but it would not be rejected if вђЈ П 0.001. It is not always easy to compute the exact P-value for a test. However, most modern computer programs for statistical analysis report P-values, and they can be obtained on some hand-held calculators. We will also show how to approximate the P-value. Finally, if the 9-2 TESTS ON THE MEAN OF A NORMAL DISTRIBUTION, VARIANCE KNOWN 293 P-value approach is used, step 6 of the hypothesis-testing procedure can be modified. Specifically, it is not necessary to state explicitly the critical region. 9-2.3 Connection between Hypothesis Tests and Confidence Intervals There is a close relationship between the test of a hypothesis about any parameter, say вђЄ, and the confidence interval for вђЄ. If [l, u] is a 10011 ПЄ вђЈ2 % confidence interval for the parameter вђЄ, the test of size вђЈ of the hypothesis H0: вђЄ П вђЄ0 H1: вђЄ вђЄ0 will lead to rejection of H0 if and only if вђЄ0 is not in the 100 11 ПЄ вђЈ2 % CI [l, u]. As an illustration, consider the escape system propellant problem discussed above. The null hypothesis H0: вђ® П 50 was rejected, using вђЈ П 0.05. The 95% two-sided CI on вђ® can be calculated using Equation 8-7. This CI is 50.52 Х… вђ® Х… 52.08. Because the value вђ®0 П 50 is not included in this interval, the null hypothesis H0: вђ® П 50 is rejected. Although hypothesis tests and CIs are equivalent procedures insofar as decision making or inference about вђ® is concerned, each provides somewhat different insights. For instance, the confidence interval provides a range of likely values for вђ® at a stated confidence level, whereas hypothesis testing is an easy framework for displaying the risk levels such as the P-value associated with a specific decision. We will continue to illustrate the connection between the two procedures throughout the text. 9-2.4 Type II Error and Choice of Sample Size In testing hypotheses, the analyst directly selects the type I error probability. However, the probability of type II error вђ¤ depends on the choice of sample size. In this section, we will show how to calculate the probability of type II error вђ¤. We will also show how to select the sample size to obtain a specified value of вђ¤. Finding the Probability of Type II Error вђ¤ Consider the two-sided hypothesis H0: вђ® П вђ®0 H1: вђ® вђ®0 Suppose that the null hypothesis is false and that the true value of the mean is вђ® П вђ® 0 П© вђ¦, say, where вђ¦ Пѕ 0. The test statistic Z0 is Z0 П X ПЄ 1вђ®0 П© вђ¦2 X ПЄ вђ®0 вђ¦ 1n П П© вђґ вђґЦЂ 1n вђґЦЂ 1n Therefore, the distribution of Z0 when H1 is true is вђ¦ 1n Z0 Пі N a вђґ , 1b (9-16) 294 CHAPTER 9 TESTS OF HYPOTHESES FOR A SINGLE SAMPLE Under H0 : Вµ = Вµ 0 Under H1: Вµ в‰ Вµ 0 N(0,1) N (Оґ Пѓв€љn , 1( ОІ Figure 9-7 The distribution of Z0 under H0 and H1. –zО± /2 0 zО± /2 Оґ в€љn Пѓ Z0 The distribution of the test statistic Z0 under both the null hypothesis H0 and the alternate hypothesis H1 is shown in Fig. 9-7. From examining this figure, we note that if H1 is true, a type II error will be made only if ПЄzвђЈЦЂ2 Х… Z0 Х… zвђЈЦЂ2 where Z0 Пі N1вђ¦1n ЦЂвђґ, 12 . That is, the probability of the type II error вђ¤ is the probability that Z0 falls between ПЄzвђЈЦЂ2 and zвђЈЦЂ2 given that H1 is true. This probability is shown as the shaded portion of Fig. 9-7. Expressed mathematically, this probability is вђ¤ П вЊЅ azвђЈЦЂ2 ПЄ вђ¦1n вђ¦1n вђґ b ПЄ вЊЅ aПЄzвђЈЦЂ2 ПЄ вђґ b (9-17) where вЊЅ1z2 denotes the probability to the left of z in the standard normal distribution. Note that Equation 9-17 was obtained by evaluating the probability that Z0 falls in the interval 3 ПЄzвђЈЦЂ2, zвђЈЦЂ2 4 when H1 is true. Furthermore, note that Equation 9-17 also holds if вђ¦ ПЅ 0, due to the symmetry of the normal distribution. It is also possible to derive an equation similar to Equation 9-17 for a one-sided alternative hypothesis. Sample Size Formulas One may easily obtain formulas that determine the appropriate sample size to obtain a particular value of вђ¤ for a given вђ¦ and вђЈ. For the two-sided alternative hypothesis, we know from Equation 9-17 that вђ¤ П вЊЅ azвђЈЦЂ2 ПЄ вђ¦ 1n вђ¦1n вђґ b ПЄ вЊЅ aПЄzвђЈЦЂ2 ПЄ вђґ b or if вђ¦ Пѕ 0, вђ¤ УЌ вЊЅ azвђЈЦЂ2 ПЄ вђ¦ 1n вђґ b (9-18) since вЊЅ1ПЄzвђЈЦЂ2 ПЄ вђ¦ 1n ЦЂвђґ2 УЌ 0 when вђ¦ is positive. Let zвђ¤ be the 100вђ¤ upper percentile of the standard normal distribution. Then, вђ¤ П вЊЅ1ПЄzвђ¤ 2 . From Equation 9-18 ПЄzвђ¤ УЌ zвђЈЦЂ2 ПЄ or вђ¦1n вђґ 295 9-2 TESTS ON THE MEAN OF A NORMAL DISTRIBUTION, VARIANCE KNOWN 1zвђЈЦЂ2 П© zвђ¤ 2 2 вђґ2 nУЌ вђ¦2 (9-19) where вђ¦ П вђ® ПЄ вђ®0 This approximation is good when вЊЅ1ПЄzвђЈЦЂ2 ПЄ вђ¦ 1nЦЂвђґ2 is small compared to вђ¤. For either of the one-sided alternative hypotheses the sample size required to produce a specified type II error with probability вђ¤ given вђ¦ and вђЈ is nП 1zвђЈ П© zвђ¤ 2 2 вђґ2 вђ¦2 (9-20) where вђ¦ П вђ® ПЄ вђ®0 EXAMPLE 9-3 Consider the rocket propellant problem of Example 9-2. Suppose that the analyst wishes to design the test so that if the true mean burning rate differs from 50 centimeters per second by as much as 1 centimeter per second, the test will detect this (i.e., reject H0: вђ® П 50) with a high probability, say 0.90. Now, we note that вђґ П 2, вђ¦ П 51 ПЄ 50 П 1, вђЈ П 0.05, and вђ¤ П 0.10. Since zвђЈЦЂ2 П z0.025 П 1.96 and zвђ¤ П z0.10 П 1.28, the sample size required to detect this departure from H0: вђ® П 50 is found by Equation 9-19 as nУЌ 1zвђЈЦЂ2 П© zвђ¤ 2 2 вђґ2 вђ¦2 П 11.96 П© 1.282 2 22 УЌ 42 112 2 The approximation is good here, since вЊЅ 1ПЄzвђЈЦЂ2 ПЄ вђ¦ 1n ЦЂвђґ2 П вЊЅ 1ПЄ1.96 ПЄ 112 142 ЦЂ22 П вЊЅ1ПЄ5.202 УЌ 0, which is small relative to вђ¤. Using Operating Characteristic Curves When performing sample size or type II error calculations, it is sometimes more convenient to use the operating characteristic curves in Appendix Charts VIa and VIb. These curves plot вђ¤ as calculated from Equation 9-17 against a parameter d for various sample sizes n. Curves are provided for both вђЈ П 0.05 and вђЈ П 0.01. The parameter d is defined as dП 0вђ¦ 0 0 вђ® ПЄ вђ®0 0 П вђґ вђґ (9-21) 296 CHAPTER 9 TESTS OF HYPOTHESES FOR A SINGLE SAMPLE so one set of operating characteristic curves can be used for all problems regardless of the values of вђ®0 and вђґ. From examining the operating characteristic curves or Equation 9-17 and Fig. 9-7, we note that 1. The further the true value of the mean вђ® is from вђ®0, the smaller the probability of type II error вђ¤ for a given n and вђЈ. That is, we see that for a specified sample size and вђЈ, large differences in the mean are easier to detect than small ones. 2. For a given вђ¦ and вђЈ, the probability of type II error вђ¤ decreases as n increases. That is, to detect a specified difference вђ¦ in the mean, we may make the test more powerful by increasing the sample size. EXAMPLE 9-4 Consider the propellant problem in Example 9-2. Suppose that the analyst is concerned about the probability of type II error if the true mean burning rate is вђ® П 51 centimeters per second. We may use the operating characteristic curves to find вђ¤. Note that вђ¦ П 51 ПЄ 50 П 1, n П 25, вђґ П 2, and вђЈ П 0.05. Then using Equation 9-21 gives dП 0вђ® ПЄ вђ®0 0 0вђ¦0 1 П вђґ П вђґ 2 and from Appendix Chart VIa, with n П 25, we find that вђ¤ П 0.30. That is, if the true mean burning rate is вђ® П 51 centimeters per second, there is approximately a 30% chance that this will not be detected by the test with n П 25. EXAMPLE 9-5 Once again, consider the propellant problem in Example 9-2. Suppose that the analyst would like to design the test so that if the true mean burning rate differs from 50 centimeters per second by as much as 1 centimeter per second, the test will detect this (i.e., reject H0: вђ® П 50) with a high probability, say, 0.90. This is exactly the same requirement as in Example 9-3, where we used Equation 9-19 to find the required sample size to be n П 42. The operating characteristic curves can also be used to find the sample size for this test. Since d П 0вђ® ПЄ вђ®0 0 ЦЂвђґ П 1ЦЂ2, вђЈ П 0.05, and вђ¤ П 0.10, we find from Appendix Chart VIa that the required sample size is approximately n П 40. This closely agrees with the sample size calculated from Equation 9-19. In general, the operating characteristic curves involve three parameters: вђ¤, d, and n. Given any two of these parameters, the value of the third can be determined. There are two typical applications of these curves: 1. For a given n and d, find вђ¤ (as illustrated in Example 9-3). This kind of problem is often encountered when the analyst is concerned about the sensitivity of an experiment already performed, or when sample size is restricted by economic or other factors. 2. For a given вђ¤ and d, find n. This was illustrated in Example 9-4. This kind of problem is usually encountered when the analyst has the opportunity to select the sample size at the outset of the experiment. Operating characteristic curves are given in Appendix Charts VIc and VId for the onesided alternatives. If the alternative hypothesis is either H1: вђ® Пѕ вђ®0 or H1: вђ® ПЅ вђ®0, the abscissa scale on these charts is dП 0вђ® ПЄ вђ®0 0 вђґ (9-22) 9-2 TESTS ON THE MEAN OF A NORMAL DISTRIBUTION, VARIANCE KNOWN 297 Using the Computer Many statistics software packages will calculate sample sizes and type II error probabilities. To illustrate, here are some computations from Minitab for the propellant burning rate problem. Power and Sample Size 1-Sample Z Test Testing mean П null (versus not П null) Calculating power for mean П null + difference Alpha П 0.05 Sigma П 2 Sample Target Actual Difference Size Power Power 1 43 0.9000 0.9064 Power and Sample Size 1-Sample Z Test Testing mean П null (versus not П null) Calculating power for mean П null П© difference Alpha П 0.05 Sigma П 2 Sample Target Actual Difference Size Power Power 1 28 0.7500 0.7536 Power and Sample Size 1-Sample Z Test Testing mean П null (versus not П null) Calculating power for mean П null П© difference Alpha П 0.05 Sigma П 2 Sample Difference Size Power 1 25 0.7054 In the first part of the boxed display, we asked Minitab to work Example 9-3, that is, to find the sample size n that would allow detection of a difference from вђ®0 П 50 of 1 centimeter per second with power of 0.9 and вђЈ П 0.05. The answer, n П 43, agrees closely with the calculated value from Equation 9-19 in Example 9-3, which was n П 42. The difference is due to Minitab using a value of zвђ¤ that has more than two decimal places. The second part of the computer output relaxes the power requirement to 0.75. Note that the effect is to reduce the required sample size to n П 28. The third part of the output is the solution to Example 9-4, where we wish to determine the type II error probability of (вђ¤) or the power П 1 ПЄ вђ¤ for the sample size n П 25. Note that Minitab computes the power to be 0.7054, which agrees closely with the answer obtained from the O.C. curve in Example 9-4. Generally, however, the computer calculations will be more accurate than visually reading values from an O.C. curve. 9-2.5 Large-Sample Test We have developed the test procedure for the null hypothesis H0: вђ® П вђ®0 assuming that the population is normally distributed and that вђґ2 is known. In many if not most practical situations вђґ2 298 CHAPTER 9 TESTS OF HYPOTHESES FOR A SINGLE SAMPLE will be unknown. Furthermore, we may not be certain that the population is well modeled by a normal distribution. In these situations if n is large (say n Пѕ 40) the sample standard deviation s can be substituted for вђґ in the test procedures with little effect. Thus, while we have given a test for the mean of a normal distribution with known вђґ2, it can be easily converted into a largesample test procedure for unknown вђґ2 that is valid regardless of the form of the distribution of the population. This large-sample test relies on the central limit theorem just as the largesample confidence interval on вђ® that was presented in the previous chapter did. Exact treatment of the case where the population is normal, вђґ2 is unknown, and n is small involves use of the t distribution and will be deferred until Section 9-3. 9-2.6 Some Practical Comments on Hypothesis Tests The Eight-Step Procedure In Section 9-1.4 we described an eight-step procedure for statistical hypothesis testing. This procedure was illustrated in Example 9-2 and will be encountered many times in both this chapter and Chapter 10. In practice, such a formal and (seemingly) rigid procedure is not always necessary. Generally, once the experimenter (or decision maker) has decided on the question of interest and has determined the design of the experiment (that is, how the data are to be collected, how the measurements are to be made, and how many observations are required), only three steps are really required: 1. Specify the test statistic to be used (such as Z0). 2. Specify the location of the critical region (two-tailed, upper-tailed, or lower-tailed). 3. Specify the criteria for rejection (typically, the value of вђЈ, or the P-value at which rejection should occur). These steps are often completed almost simultaneously in solving real-world problems, although we emphasize that it is important to think carefully about each step. That is why we present and use the eight-step process: it seems to reinforce the essentials of the correct approach. While you may not use it every time in solving real problems, it is a helpful framework when you are first learning about hypothesis testing. Statistical versus Practical Significance We noted previously that reporting the results of a hypothesis test in terms of a P-value is very useful because it conveys more information than just the simple statement “reject H0” or “fail to reject H0”. That is, rejection of H0 at the 0.05 level of significance is much more meaningful if the value of the test statistic is well into the critical region, greatly exceeding the 5% critical value, than if it barely exceeds that value. Even a very small P-value can be difficult to interpret from a practical viewpoint when we are making decisions because, while a small P-value indicates statistical significance in the sense that H0 should be rejected in favor of H1, the actual departure from H0 that has been detected may have little (if any) practical significance (engineers like to say “engineering significance”). This is particularly true when the sample size n is large. For example, consider the propellant burning rate problem of Example 9-3 where we are testing H0: вђ® П 50 centimeters per second versus H1: вђ® П¶ 50 centimeters per second with вђґ П 2. If we suppose that the mean rate is really 50.5 centimeters per second, this is not a serious departure from H0: вђ® П 50 centimeters per second in the sense that if the mean really is 50.5 centimeters per second there is no practical observable effect on the performance of the aircrew escape system. In other words, concluding that вђ® П 50 centimeters per second when it is really 50.5 centimeters per second is an inexpensive error and has no practical significance. For a reasonably large sample size, a true value of вђ® П 50.5 will lead to a sample x that 9-2 TESTS ON THE MEAN OF A NORMAL DISTRIBUTION, VARIANCE KNOWN 299 is close to 50.5 centimeters per second, and we would not want this value of x from the sample to result in rejection of H0. The following display shows the P-value for testing H0: вђ® П 50 when we observe x П 50.5 centimeters per second and the power of the test at вђЈ П 0.05 when the true mean is 50.5 for various sample sizes n: Sample Size n P-value When x П 50.5 Power (at вђЈ П 0.05) When True вђ® П 50.5 10 25 50 100 400 1000 0.4295 0.2113 0.0767 0.0124 5.73 П« 10ПЄ7 2.57 П« 10ПЄ15 0.1241 0.2396 0.4239 0.7054 0.9988 1.0000 The P-value column in this display indicates that for large sample sizes the observed sample value of x П 50.5 would strongly suggest that H0: вђ® П 50 should be rejected, even though the observed sample results imply that from a practical viewpoint the true mean does not differ much at all from the hypothesized value вђ®0 П 50. The power column indicates that if we test a hypothesis at a fixed significance level вђЈ and even if there is little practical difference between the true mean and the hypothesized value, a large sample size will almost always lead to rejection of H0. The moral of this demonstration is clear: Be careful when interpreting the results from hypothesis testing when the sample size is large, because any small departure from the hypothesized value вђ®0 will probably be detected, even when the difference is of little or no practical significance. EXERCISES FOR SECTION 9-2 9-20. The mean water temperature downstream from a power plant cooling tower discharge pipe should be no more than 100В°F. Past experience has indicated that the standard deviation of temperature is 2В°F. The water temperature is measured on nine randomly chosen days, and the average temperature is found to be 98В°F. (a) Should the water temperature be judged acceptable with вђЈ П 0.05? (b) What is the P-value for this test? (c) What is the probability of accepting the null hypothesis at вђЈ П 0.05 if the water has a true mean temperature of 104 В°F? 9-21. Reconsider the chemical process yield data from Exercise 8-9. Recall that вђґ П 3, yield is normally distributed and that n П 5 observations on yield are 91.6%, 88.75%, 90.8%, 89.95%, and 91.3%. Use вђЈ П 0.05. (a) Is there evidence that the mean yield is not 90%? (b) What is the P-value for this test? (c) What sample size would be required to detect a true mean yield of 85% with probability 0.95? (d) What is the type II error probability if the true mean yield is 92%? (e) Compare the decision you made in part (c) with the 95% CI on mean yield that you constructed in Exercise 8-7. 9-22. A manufacturer produces crankshafts for an automobile engine. The wear of the crankshaft after 100,000 miles (0.0001 inch) is of interest because it is likely to have an impact on warranty claims. A random sample of n П 15 shafts is tested and x П 2.78. It is known that вђґ П 0.9 and that wear is normally distributed. (a) Test H0: вђ® П 3 versus H0: вђ® Z 3 using вђЈ П 0.05. (b) What is the power of this test if вђ® П 3.25? (c) What sample size would be required to detect a true mean of 3.75 if we wanted the power to be at least 0.9? 9-23. A melting point test of n П 10 samples of a binder used in manufacturing a rocket propellant resulted in x П 154.2РЉ F. Assume that melting point is normally distributed with вђґ П 1.5РЉ F. (a) Test H0: вђ® П 155 versus H0: вђ® 155 using вђЈ П 0.01. (b) What is the P-value for this test? 300 CHAPTER 9 TESTS OF HYPOTHESES FOR A SINGLE SAMPLE (c) What is the вђ¤-error if the true mean is вђ® П 150? (d) What value of n would be required if we want вђ¤ ПЅ 0.1 when вђ® П 150? Assume that вђЈ П 0.01. 9-24. The life in hours of a battery is known to be approximately normally distributed, with standard deviation вђґ П 1.25 hours. A random sample of 10 batteries has a mean life of x П 40.5 hours. (a) Is there evidence to support the claim that battery life exceeds 40 hours? Use вђЈ П 0.05. (b) What is the P-value for the test in part (a)? (c) What is the вђ¤-error for the test in part (a) if the true mean life is 42 hours? (d) What sample size would be required to ensure that вђ¤ does not exceed 0.10 if the true mean life is 44 hours? (e) Explain how you could answer the question in part (a) by calculating an appropriate confidence bound on life. 9-25. An engineer who is studying the tensile strength of a steel alloy intended for use in golf club shafts knows that tensile strength is approximately normally distributed with вђґ П 60 psi. A random sample of 12 specimens has a mean tensile strength of x П 3250 psi. (a) Test the hypothesis that mean strength is 3500 psi. Use вђЈ П 0.01. (b) What is the smallest level of significance at which you would be willing to reject the null hypothesis? (c) Explain how you could answer the question in part (a) with a two-sided confidence interval on mean tensile strength. 9-26. Suppose that in Exercise 9-25 we wanted to reject the null hypothesis with probability at least 0.8 if mean strength вђ® П 3500. What sample size should be used? 9-27. Supercavitation is a propulsion technology for undersea vehicles that can greatly increase their speed. It occurs above approximately 50 meters per second, when pressure drops sufficiently to allow the water to dissociate into water vapor, forming a gas bubble behind the vehicle. When the gas bubble completely encloses the vehicle, supercavitation is said to occur. Eight tests were conducted on a scale model of an undersea vehicle in a towing basin with the average observed speed x П 102.2 meters per second. Assume that speed is normally distributed with known standard deviation вђґ П 4 meters per second. (a) Test the hypotheses H0: вђ® П 100 versus H1: вђ® ПЅ 100 using вђЈ П 0.05. (b) Compute the power of the test if the true mean speed is as low as 95 meters per second. (c) What sample size would be required to detect a true mean speed as low as 95 meters per second if we wanted the power of the test to be at least 0.85? (d) Explain how the question in part (a) could be answered by constructing a one-sided confidence bound on the mean speed. 9-28. A bearing used in an automotive application is suppose to have a nominal inside diameter of 1.5 inches. A random sample of 25 bearings is selected and the average inside diameter of these bearings is 1.4975 inches. Bearing diameter is known to be normally distributed with standard deviation вђґ П 0.01 inch. (a) Test the hypotheses H0: вђ® П 1.5 versus H1: вђ® 1.5 using вђЈ П 0.01. (b) Compute the power of the test if the true mean diameter is 1.495 inches. (c) What sample size would be required to detect a true mean diameter as low as 1.495 inches if we wanted the power of the test to be at least 0.9? (d) Explain how the question in part (a) could be answered by constructing a two-sided confidence interval on the mean diameter. 9-29. Medical researchers have developed a new artificial heart constructed primarily of titanium and plastic. The heart will last and operate almost indefinitely once it is implanted in the patient’s body, but the battery pack needs to be recharged about every four hours. A random sample of 50 battery packs is selected and subjected to a life test. The average life of these batteries is 4.05 hours. Assume that battery life is normally distributed with standard deviation вђґ П 0.2 hour. (a) Is there evidence to support the claim that mean battery life exceeds 4 hours? Use вђЈ П 0.05. (b) Compute the power of the test if the true mean battery life is 4.5 hours. (c) What sample size would be required to detect a true mean battery life of 4.5 hours if we wanted the power of the test to be at least 0.9? (d) Explain how the question in part (a) could be answered by constructing a one-sided confidence bound on the mean life. 9-3 TESTS ON THE MEAN OF A NORMAL DISTRIBUTION, VARIANCE UNKNOWN 9-3.1 Hypothesis Tests on the Mean We now consider the case of hypothesis testing on the mean of a population with unknown variance вђґ2. The situation is analogous to Section 8-3, where we considered a confidence interval on the mean for the same situation. As in that section, the validity of the test procedure we will describe rests on the assumption that the population distribution is at least approximately 301 9-3 TESTS ON THE MEAN OF A NORMAL DISTRIBUTION, VARIANCE UNKNOWN normal. The important result upon which the test procedure relies is that if X1, X2, p , Xn is a random sample from a normal distribution with mean вђ® and variance вђґ2, the random variable TП XПЄвђ® SЦЂ 1n has a t distribution with n ПЄ 1 degrees of freedom. Recall that we used this result in Section 8-3 to devise the t-confidence interval for вђ®. Now consider testing the hypotheses H0: вђ® П вђ®0 H1: вђ® вђ®0 We will use the test statistic T0 П X ПЄ вђ®0 S ЦЂ 1n (9-23) If the null hypothesis is true, T0 has a t distribution with n ПЄ 1 degrees of freedom. When we know the distribution of the test statistic when H0 is true (this is often called the reference distribution or the null distribution), we can locate the critical region to control the type I error probability at the desired level. In this case we would use the t percentage points ПЄtвђЈНћ2,nПЄ1 and tвђЈЦЂ2,nПЄ1 as the boundaries of the critical region so that we would reject H0: вђ® П вђ®0 if or if t0 ПЅ ПЄtвђЈЦЂ2,nПЄ1 t0 Пѕ tвђЈЦЂ2,nПЄ1 where t0 is the observed value of the test statistic T0. The test procedure is very similar to the test on the mean with known variance described in Section 9-2, except that T0 is used as the test statistic instead of Z0 and the tnПЄ1 distribution is used to define the critical region instead of the standard normal distribution. A summary of the test procedures for both two- and onesided alternative hypotheses follows: The OneSample t-Test Null hypothesis: Test statistic: H0: вђ® П вђ®0 T0 П X ПЄ вђ®0 S ЦЂ 1n Alternative hypothesis Rejection criteria H1: вђ® Z вђ®0 H1: вђ® Пѕ вђ®0 H1: вђ® ПЅ вђ®0 t0 Пѕ tвђЈ/2,nПЄ1 or t0 ПЅ ПЄtвђЈ/2,nПЄ1 t0 Пѕ tвђЈ,nПЄ1 t0 ПЅ ПЄtвђЈ,nПЄ1 Figure 9-8 shows the location of the critical region for these situations. tn – 1 О± /2 О± /2 –tО± /2, n – 1 tn – 1 0 (a) tО± /2, n – 1 tn – 1 О± 0 (b) tО± , n – 1 О± –tО± , n – 1 0 (c) Figure 9-8 The reference distribution for H0: вђ® П вђ®0 with critical region for (a) H1: вђ® Z вђ®0, (b) H1: вђ® Пѕ вђ®0, and (c) H1: вђ® ПЅ вђ®0. T0 302 CHAPTER 9 TESTS OF HYPOTHESES FOR A SINGLE SAMPLE EXAMPLE 9-6 The increased availability of light materials with high strength has revolutionized the design and manufacture of golf clubs, particularly drivers. Clubs with hollow heads and very thin faces can result in much longer tee shots, especially for players of modest skills. This is due partly to the “spring-like effect” that the thin face imparts to the ball. Firing a golf ball at the head of the club and measuring the ratio of the outgoing velocity of the ball to the incoming velocity can quantify this spring-like effect. The ratio of velocities is called the coefficient of restitution of the club. An experiment was performed in which 15 drivers produced by a particular club maker were selected at random and their coefficients of restitution measured. In the experiment the golf balls were fired from an air cannon so that the incoming velocity and spin rate of the ball could be precisely controlled. It is of interest to determine if there is evidence (with вђЈ П 0.05) to support a claim that the mean coefficient of restitution exceeds 0.82. The observations follow: 0.8411 0.8580 0.8042 0.8191 0.8532 0.8730 0.8182 0.8483 0.8282 0.8125 0.8276 0.8359 0.8750 0.7983 0.8660 The sample mean and sample standard deviation are x П 0.83725 and s П 0.02456. The normal probability plot of the data in Fig. 9-9 supports the assumption that the coefficient of restitution is normally distributed. Since the objective of the experimenter is to demonstrate that the mean coefficient of restitution exceeds 0.82, a one-sided alternative hypothesis is appropriate. The solution using the eight-step procedure for hypothesis testing is as follows: 1. The parameter of interest is the mean coefficient of restitution, вђ®. 2. H0: вђ® П 0.82 3. H1: вђ® Пѕ 0.82 . We want to reject H0 if the mean coefficient of restitution exceeds 0.82. 4. вђЈ П 0.05 5. The test statistic is t0 П 6. x ПЄ вђ®0 sЦЂ 1n Reject H0 if t0 Пѕ t0.05,14 П 1.761 99 95 Percentage 90 80 70 60 50 40 30 20 10 Figure 9-9. Normal probability plot of the coefficient of restitution data from Example 9-6. 5 1 0.78 0.83 Coefficient of restitution 0.88 9-3 TESTS ON THE MEAN OF A NORMAL DISTRIBUTION, VARIANCE UNKNOWN 7. Computations: Since x П 0.83725, s П 0.02456, вђ®0 П 0.82, and n П 15, we have t0 П 8. 303 0.83725 ПЄ 0.82 П 2.72 0.02456ЦЂ 115 Conclusions: Since t0 П 2.72 Пѕ 1.761, we reject H0 and conclude at the 0.05 level of significance that the mean coefficient of restitution exceeds 0.82. Minitab will conduct the one-sample t-test. The output from this software package is in the following display: One-Sample T: COR Test of mu П 0.82 vs mu Пѕ 0.82 Variable COR N 15 Mean 0.83725 Variable COR 95.0% Lower Bound 0.82608 StDev 0.02456 T 2.72 SE Mean 0.00634 P 0.008 Notice that Minitab computes both the test statistic T0 and a 95% lower confidence bound for the coefficient of restitution. Because the 95% lower confidence bound exceeds 0.82, we would reject the hypothesis that H0: вђ® П 0.82 and conclude that the alternative hypothesis H1: вђ® Пѕ 0.82 is true. Minitab also calculates a P-value for the test statistic T0. In the next section we explain how this is done. 9-3.2 P-Value for a t-Test The P-value for a t-test is just the smallest level of significance at which the null hypothesis would be rejected. That is, it is the tail area beyond the value of the test statistic t0 for a onesided test or twice this area for a two-sided test. Because the t-table in Appendix Table IV contains only 10 critical values for each t distribution, computation of the exact P-value directly from the table is usually impossible. However, it is easy to find upper and lower bounds on the P-value from this table. To illustrate, consider the t-test based on 14 degrees of freedom in Example 9-6. The relevant critical values from Appendix Table IV are as follows: Critical Value: 0.258 0.692 1.345 1.761 2.145 2.624 2.977 3.326 3.787 4.140 Tail Area: 0.40 0.25 0.10 0.05 0.025 0.01 0.005 0.0025 0.001 0.0005 Notice that t0 П 2.72 in Example 9-6, and that this is between two tabulated values, 2.624 and 2.977. Therefore, the P-value must be between 0.01 and 0.005. These are effectively the upper and lower bounds on the P-value. Example 9-6 is an upper-tailed test. If the test is lower-tailed, just change the sign of t0 and proceed as above. Remember that for a two-tailed test the level of significance associated with a particular critical value is twice the corresponding tail area in the column heading. This consideration must be taken into account when we compute the bound on the P-value. For example, suppose that t0 П 2.72 for a two-tailed alternate based on 14 degrees of freedom. The value t0 Пѕ 2.624 (corresponding to вђЈ П 0.02) and t0 ПЅ 2.977 (corresponding to вђЈ П 0.01), so the lower and upper bounds on the P-value would be 0.01 ПЅ P ПЅ 0.02 for this case. 304 CHAPTER 9 TESTS OF HYPOTHESES FOR A SINGLE SAMPLE Finally, most computer programs report P-values along with the computed value of the test statistic. Some hand-held calculators also have this capability. In Example 9-6, Minitab gave the P-value for the value t0 П 2.72 in Example 9-6 as 0.008. 9-3.3 Choice of Sample Size The type II error probability for tests on the mean of a normal distribution with unknown variance depends on the distribution of the test statistic in Equation 9-23 when the null hypothesis H0: вђ® П вђ®0 is false. When the true value of the mean is вђ® П вђ®0 П© вђ¦, the distribution for T0 is called the noncentral t distribution with n ПЄ 1 degrees of freedom and noncentrality parameter вђ¦1nЦЂвђґ. Note that if вђ¦ П 0, the noncentral t distribution reduces to the usual central t distribution. Therefore, the type II error of the two-sided alternative (for example) would be вђ¤ П P5ПЄtвђЈЦЂ2,nПЄ1 Х… T0 Х… tвђЈЦЂ2,nПЄ1 0 вђ¦ П P5ПЄtвђЈЦЂ2,nПЄ1 Х… T 0Вї Х… tвђЈЦЂ2,nПЄ1 6 06 where TВї0 denotes the noncentral t random variable. Finding the type II error probability вђ¤ for the t-test involves finding the probability contained between two points of the noncentral t distribution. Because the noncentral t-random variable has a messy density function, this integration must be done numerically. Fortunately, this ugly task has already been done, and the results are summarized in a series of O.C. curves in Appendix Charts VIe, VIf, VIg, and VIh that plot вђ¤ for the t-test against a parameter d for various sample sizes n. Curves are provided for two-sided alternatives on Charts VIe and VIf. The abscissa scale factor d on these charts is defined as dП 0вђ¦0 0вђ® ПЄ вђ®0 0 П вђґ вђґ (9-24) For the one-sided alternative вђ® Пѕ вђ®0 or вђ® ПЅ вђ®0 , we use charts VIg and VIh with dП 0вђ® ПЄ вђ®0 0 0вђ¦0 П вђґ вђґ (9-25) We note that d depends on the unknown parameter вђґ2. We can avoid this difficulty in several ways. In some cases, we may use the results of a previous experiment or prior information to make a rough initial estimate of вђґ2. If we are interested in evaluating test performance after the data have been collected, we could use the sample variance s2 to estimate вђґ2. If there is no previous experience on which to draw in estimating вђґ2, we then define the difference in the mean d that we wish to detect relative to вђґ. For example, if we wish to detect a small difference in the mean, we might use a value of d П 0 вђ¦ 0 ЦЂвђґ Х… 1 (for example), whereas if we are interested in detecting only moderately large differences in the mean, we might select d П 0 вђ¦ 0 ЦЂвђґ П 2 (for example). That is, it is the value of the ratio 0 вђ¦ 0 ЦЂвђґ that is important in determining sample size, and if it is possible to specify the relative size of the difference in means that we are interested in detecting, then a proper value of d can usually be selected. EXAMPLE 9-7 Consider the golf club testing problem from Example 9-6. If the mean coefficient of restitution exceeds 0.82 by as much as 0.02, is the sample size n П 15 adequate to ensure that H0: вђ® П 0.82 will be rejected with probability at least 0.8? To solve this problem, we will use the sample standard deviation s П 0.02456 to estimate вђґ. Then d П 0 вђ¦ 0 ЦЂвђґ П 0.02 ЦЂ0.02456 П 0.81. By referring to the operating characteristic curves in Appendix Chart VIg (for вђЈ П 0.05) with d П 0.81 and n П 15, we find that вђ¤ П 0.10, 9-3 TESTS ON THE MEAN OF A NORMAL DISTRIBUTION, VARIANCE UNKNOWN 305 approximately. Thus, the probability of rejecting H0: вђ® П 0.82 if the true mean exceeds this by 0.02 is approximately 1 ПЄ вђ¤ П 1 ПЄ 0.10 П 0.90, and we conclude that a sample size of n П 15 is adequate to provide the desired sensitivity. Minitab will also perform power and sample size computations for the one-sample t-test. Below are several calculations based on the golf club testing problem: Power and Sample Size 1-Sample t Test Testing mean П null (versus Пѕ null) Calculating power for mean П null П© difference Alpha П 0.05 Sigma П 0.02456 Sample Difference Size Power 0.02 15 0.9117 Power and Sample Size 1-Sample t Test Testing mean П null (versus Пѕ null) Calculating power for mean П null П© difference Alpha П 0.05 Sigma П 0.02456 Sample Difference Size Power 0.01 15 0.4425 Power and Sample Size 1-Sample t Test Testing mean П null (versus Пѕ null) Calculating power for mean П null П© difference Alpha П 0.05 Sigma П 0.02456 Sample Target Actual Difference Size Power Power 0.01 39 0.8000 0.8029 In the first portion of the computer output, Minitab reproduces the solution to Example 9-7, verifying that a sample size of n П 15 is adequate to give power of at least 0.8 if the mean coefficient of restitution exceeds 0.82 by at least 0.02. In the middle section of the output, we asked Minitab to compute the power if the difference in вђ® and вђ®0 П 0.82 we wanted to detect was 0.01. Notice that with n П 15, the power drops considerably to 0.4425. The final portion of the output is the sample size required to give a power of at least 0.8 if the difference between вђ® and вђ®0 of interest is actually 0.01. A much larger n is required to detect this smaller difference. 9-3.4 Likelihood Ratio Approach to Development of Test Procedures (CD Only) EXERCISES FOR SECTION 9-3 9-30. An article in the ASCE Journal of Energy Engineering (1999, Vol. 125, pp. 59–75) describes a study of the thermal inertia properties of autoclaved aerated concrete used as a building material. Five samples of the material were tested in a structure, and the average interior temperature (В°C) reported was as follows: 23.01, 22.22, 22.04, 22.62, and 22.59. 306 CHAPTER 9 TESTS OF HYPOTHESES FOR A SINGLE SAMPLE (a) Test the hypotheses H0: вђ® П 22.5 versus H1: вђ® 22.5, using вђЈ П 0.05. Find the P-value. (b) Is there evidence to support the assumption that interior temperature is normally distributed? (c) Compute the power of the test if the true mean interior temperature is as high as 22.75. (d) What sample size would be required to detect a true mean interior temperature as high as 22.75 if we wanted the power of the test to be at least 0.9? (e) Explain how the question in part (a) could be answered by constructing a two-sided confidence interval on the mean interior temperature. 9-31. A 1992 article in the Journal of the American Medical Association (“A Critical Appraisal of 98.6 Degrees F, the Upper Limit of the Normal Body Temperature, and Other Legacies of Carl Reinhold August Wundrlich”) reported body temperature, gender, and heart rate for a number of subjects. The body temperatures for 25 female subjects follow: 97.8, 97.2, 97.4, 97.6, 97.8, 97.9, 98.0, 98.0, 98.0, 98.1, 98.2, 98.3, 98.3, 98.4, 98.4, 98.4, 98.5, 98.6, 98.6, 98.7, 98.8, 98.8, 98.9, 98.9, and 99.0. (a) Test the hypotheses H0: вђ® П 98.6 versus H1: вђ® 98.6, using вђЈ П 0.05. Find the P-value. (b) Compute the power of the test if the true mean female body temperature is as low as 98.0. (c) What sample size would be required to detect a true mean female body temperature as low as 98.2 if we wanted the power of the test to be at least 0.9? (d) Explain how the question in part (a) could be answered by constructing a two-sided confidence interval on the mean female body temperature. (e) Is there evidence to support the assumption that female body temperature is normally distributed? 9-32. Cloud seeding has been studied for many decades as a weather modification procedure (for an interesting study of this subject, see the article in Technometrics by Simpson, Alsen, and Eden, “A Bayesian Analysis of a Multiplicative Treatment Effect in Weather Modification”, Vol. 17, pp. 161– 166). The rainfall in acre-feet from 20 clouds that were selected at random and seeded with silver nitrate follows: 18.0, 30.7, 19.8, 27.1, 22.3, 18.8, 31.8, 23.4, 21.2, 27.9, 31.9, 27.1, 25.0, 24.7, 26.9, 21.8, 29.2, 34.8, 26.7, and 31.6. (a) Can you support a claim that mean rainfall from seeded clouds exceeds 25 acre-feet? Use вђЈ П 0.01. (b) Is there evidence that rainfall is normally distributed? (c) Compute the power of the test if the true mean rainfall is 27 acre-feet. (d) What sample size would be required to detect a true mean rainfall of 27.5 acre-feet if we wanted the power of the test to be at least 0.9? (e) Explain how the question in part (a) could be answered by constructing a one-sided confidence bound on the mean diameter. 9-33. The sodium content of thirty 300-gram boxes of organic corn flakes was determined. The data (in milligrams) are as follows: 131.15, 130.69, 130.91, 129.54, 129.64, 128.77, 130.72, 128.33, 128.24, 129.65, 130.14, 129.29, 128.71, 129.00, 129.39, 130.42, 129.53, 130.12, 129.78, 130.92, 131.15, 130.69, 130.91, 129.54, 129.64, 128.77, 130.72, 128.33, 128.24, and 129.65. (a) Can you support a claim that mean sodium content of this brand of cornflakes is 130 milligrams? Use вђЈ П 0.05. (b) Is there evidence that sodium content is normally distributed? (c) Compute the power of the test if the true mean sodium content is 130.5 miligrams. (d) What sample size would be required to detect a true mean sodium content of 130.1 milligrams if we wanted the power of the test to be at least 0.75? (e) Explain how the question in part (a) could be answered by constructing a two-sided confidence interval on the mean sodium content. 9-34. Reconsider the tire testing experiment described in Exercise 8-22. (a) The engineer would like to demonstrate that the mean life of this new tire is in excess of 60,000 kilometers. Formulate and test appropriate hypotheses, and draw conclusions using вђЈ П 0.05. (b) Suppose that if the mean life is as long as 61,000 kilometers, the engineer would like to detect this difference with probability at least 0.90. Was the sample size n П 16 used in part (a) adequate? Use the sample standard deviation s as an estimate of вђґ in reaching your decision. 9-35. Reconsider the Izod impact test on PVC pipe described in Exercise 8-23. Suppose that you want to use the data from this experiment to support a claim that the mean impact strength exceeds the ASTM standard (foot-pounds per inch). Formulate and test the appropriate hypotheses using вђЈ П 0.05. 9-36. Reconsider the television tube brightness experiment in Exercise 8-24. Suppose that the design engineer believes that this tube will require 300 microamps of current to produce the desired brightness level. Formulate and test an appropriate hypothesis using вђЈ П 0.05. Find the P-value for this test. State any necessary assumptions about the underlying distribution of the data. 9-37. Consider the baseball coefficient of restitution data first presented in Exercise 8-79. (a) Does the data support the claim that the mean coefficient of restitution of baseballs exceeds 0.635? Use вђЈ П 0.05. (b) What is the P-value of the test statistic computed in part (a)? (c) Compute the power of the test if the true mean coefficient of restitution is as high as 0.64. (d) What sample size would be required to detect a true mean coefficient of restitution as high as 0.64 if we wanted the power of the test to be at least 0.75? 9-38. Consider the dissolved oxygen concentration at TVA dams first presented in Exercise 8-81. (a) Test the hypotheses H0: вђ® П 4 versus H1: вђ® 4 . Use вђЈ П 0.01. 307 9-4 HYPOTHESIS TESTS ON THE VARIANCE AND STANDARD DEVIATION OF A NORMAL POPULATION (b) What is the P-value of the test statistic computed in part (a)? (c) Compute the power of the test if the true mean dissolved oxygen concentration is as low as 3. (d) What sample size would be required to detect a true mean dissolved oxygen concentration as low as 2.5 if we wanted the power of the test to be at least 0.9? 9-39. Consider the cigar tar content data first presented in Exercise 8-82. (a) Can you support a claim that mean tar content exceeds 1.5? Use вђЈ П 0.05 (b) What is the P-value of the test statistic computed in part (a)? (c) Compute the power of the test if the true mean tar content is 1.6. (d) What sample size would be required to detect a true mean tar content of 1.6 if we wanted the power of the test to be at least 0.8? 9-40. Exercise 6-22 gave data on the heights of female engineering students at ASU. (a) Can you support a claim that mean height of female engineering students at ASU is 65 inches? Use вђЈ П 0.05 (b) What is the P-value of the test statistic computed in part (a)? (c) Compute the power of the test if the true mean height is 62 inches. (d) What sample size would be required to detect a true mean height of 64 inches if we wanted the power of the test to be at least 0.8? 9-41. Exercise 6-24 presented data on the concentration of suspended solids in lake water. (a) Test the hypotheses H0: вђ® П 55 versus H1: вђ® 55, use вђЈ П 0.05. (b) What is the P-value of the test statistic computed in part (a)? (c) Compute the power of the test if the true mean concentration is as low as 50. (d) What sample size would be required to detect a true mean concentration as low as 50 if we wanted the power of the test to be at least 0.9? 9-42. Exercise 6-25 describes testing golf balls for an overall distance standard. (a) Can you support a claim that mean distance achieved by this particular golf ball exceeds 280 yards? Use вђЈ П 0.05. (b) What is the P-value of the test statistic computed in part (a)? (c) Compute the power of the test if the true mean distance is 290 yards. (e) What sample size would be required to detect a true mean distance of 290 yards if we wanted the power of the test to be at least 0.8? 9-4 HYPOTHESIS TESTS ON THE VARIANCE AND STANDARD DEVIATION OF A NORMAL POPULATION Sometimes hypothesis tests on the population variance or standard deviation are needed. When the population is modeled by a normal distribution, the tests and intervals described in this section are applicable. 9-4.1 The Hypothesis Testing Procedures Suppose that we wish to test the hypothesis that the variance of a normal population вђґ2 equals a specified value, say вђґ20, or equivalently, that the standard deviation вђґ is equal to вђґ0. Let X1, X2, p , Xn be a random sample of n observations from this population. To test H0: вђґ2 П вђґ20 H1: вђґ2 вђґ20 (9-26) we will use the test statistic: X 20 П 1n ПЄ 12S 2 вђґ02 (9-27) If the null hypothesis H0: вђґ2 П вђґ02 is true, the test statistic X 20 defined in Equation 9-27 follows the chi-square distribution with n ПЄ 1 degrees of freedom. This is the reference 308 CHAPTER 9 TESTS OF HYPOTHESES FOR A SINGLE SAMPLE f (x) f (x) f (x) вђ№ 2n – 1 вђ№ 2n – 1 вђ№ 2n – 1 О± /2 О± О± /2 0 вђ№ 21 – О± /2, n – 1 вђ№ 2О± /2, n – 1 x О± вђ№ 2О± , n – 1 0 (a) x 0 x вђ№ 21 – О± , n – 1 (c) (b) 2 Figure 9-10 Reference distribution for the test of H0: вђґ П (b) H1: вђґ 2 Пѕ вђґ 20 , and (c) H1: вђґ 2 ПЅ вђґ 20 . вђґ 20 with critical region values for (a) H1: вђґ 2 вђґ 20 , distribution for this test procedure. Therefore, we calculate вђ№20 , the value of the test statistic X 02, and the null hypothesis H0: вђґ2 П вђґ20 would be rejected if вђ№20 Пѕ вђ№2вђЈЦЂ2, nПЄ1 or if вђ№20 ПЅ вђ№21ПЄвђЈЦЂ2,nПЄ1 where вђ№2вђЈЦЂ2,nПЄ1 and вђ№21ПЄвђЈЦЂ2,nПЄ1 are the upper and lower 100вђЈНћ2 percentage points of the chisquare distribution with n ПЄ 1 degrees of freedom, respectively. Figure 9-10(a) shows the critical region. The same test statistic is used for one-sided alternative hypotheses. For the one-sided hypothesis H0: вђґ2 П вђґ20 H1: вђґ2 Пѕ вђґ20 (9-28) we would reject H0 if вђ№20 Пѕ вђ№2вђЈ,nПЄ1, whereas for the other one-sided hypothesis H0: вђґ2 П вђґ20 H1: вђґ2 ПЅ вђґ20 (9-29) we would reject H0 if вђ№20 ПЅ вђ№21ПЄвђЈ,nПЄ1. The one-sided critical regions are shown in Figure 9-10(b) and (c). EXAMPLE 9-8 An automatic filling machine is used to fill bottles with liquid detergent. A random sample of 20 bottles results in a sample variance of fill volume of s2 П 0.0153 (fluid ounces)2. If the variance of fill volume exceeds 0.01 (fluid ounces)2, an unacceptable proportion of bottles will be underfilled or overfilled. Is there evidence in the sample data to suggest that the manufacturer has a problem with underfilled or overfilled bottles? Use вђЈ П 0.05, and assume that fill volume has a normal distribution. Using the eight-step procedure results in the following: 1. 2. 3. 4. 5. The parameter of interest is the population variance вђґ2. H0: вђґ2 П 0.01 H1: вђґ2 Пѕ 0.01 вђЈ П 0.05 The test statistic is вђ№20 П 1n ПЄ 12s2 вђґ20 10-4 HYPOTHESIS TESTS ON THE VARIANCE AND STANDARD DEVIATION OF A NORMAL POPULATION 6. 7. Reject H0 if вђ№20 Пѕ вђ№20.05,19 П 30.14. Computations: вђ№20 П 8. 309 1910.01532 П 29.07 0.01 Conclusions: Since вђ№20 П 29.07 ПЅ вђ№20.05,19 П 30.14, we conclude that there is no strong evidence that the variance of fill volume exceeds 0.01 (fluid ounces)2. Using Appendix Table III, it is easy to place bounds on the P-value of a chi-square test. From inspection of the table, we find that вђ№20.10,19 П 27.20 and вђ№20.05,19 П 30.14. Since 27.20 ПЅ 29.07 ПЅ 30.14, we conclude that the P-value for the test in Example 9-8 is in the interval 0.05 ПЅ P ПЅ 0.10. The actual P-value is P П 0.0649. (This value was obtained from a calculator.) 9-4.2 вђ¤-Error and Choice of Sample Size Operating characteristic curves for the chi-square tests in Section 9-4.1 are provided in Appendix Charts VIi through VIn for вђЈ П 0.05 and вђЈ П 0.01. For the two-sided alternative hypothesis of Equation 9-26, Charts VIi and VIj plot вђ¤ against an abscissa parameter вђґ вђПвђґ 0 (9-30) for various sample sizes n, where вђґ denotes the true value of the standard deviation. Charts VIk and VIl are for the one-sided alternative H1: вђґ2 Пѕ вђґ20, while Charts VIm and VIn are for the other one-sided alternative H1: вђґ2 ПЅ вђґ20. In using these charts, we think of вђґ as the value of the standard deviation that we want to detect. These curves can be used to evaluate the вђ¤-error (or power) associated with a particular test. Alternatively, they can be used to design a test—that is, to determine what sample size is necessary to detect a particular value of вђґ that differs from the hypothesized value вђґ0. EXAMPLE 9-9 Consider the bottle-filling problem from Example 9-8. If the variance of the filling process exceeds 0.01 (fluid ounces)2, too many bottles will be underfilled. Thus, the hypothesized value of the standard deviation is вђґ0 П 0.10. Suppose that if the true standard deviation of the filling process exceeds this value by 25%, we would like to detect this with probability at least 0.8. Is the sample size of n П 20 adequate? To solve this problem, note that we require 0.125 вђґ П 1.25 вђПвђґ П 0 0.10 This is the abscissa parameter for Chart VIk. From this chart, with n П 20 and вђ П 1.25, we find that вђ¤ УЌ 0.6. Therefore, there is only about a 40% chance that the null hypothesis will be rejected if the true standard deviation is really as large as вђґ П 0.125 fluid ounce. To reduce the вђ¤-error, a larger sample size must be used. From the operating characteristic curve with вђ¤ П 0.20 and вђ П 1.25, we find that n П 75, approximately. Thus, if we want the test to perform as required above, the sample size must be at least 75 bottles.
© Copyright 2026 Paperzz