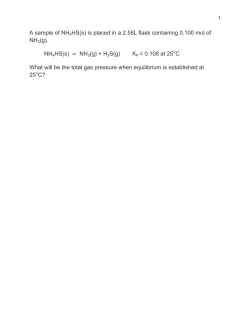
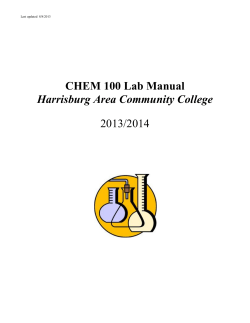
Chemistry 1215 Experiment #11 Spectrophotometric Analysis of an Unknown Brass Sample Objective In this experiment you will use spectrophotometric measurements to determine the copper concentration of a solution prepared from a sample of solid brass. Then, using the concentration of the copper you will determine the percent copper in the brass sample. Introduction Electromagnetic radiation, of which ultraviolet and visible light are but two examples, has properties of both waves and particles. When light acts as a particle, called a photon, each light particle possesses a discrete amount of energy called a quantum. When a molecule is exposed to electromagnetic energy it can absorb a photon, increasing its energy by an amount equal to the energy of the photon. The energy of the absorbed photon can be calculated if the frequency, ν, (the symbol, ν, is a Greek letter, pronounced nu) of the light is known according to Equation 1. E = hν Equation 1 Where h is a constant known as Planck’s constant after Max Planck, the German scientist who first proposed it. Planck’s constant has a value of 6.63 X 10⁻³⁴ J.s. Frequency is measured in units of 1/s or Hertz (Hz). The frequency of a light wave is inversely proportional to its wavelength, λ, (λ is also Greek and is pronounced lambda) which is typically measured in meters. The product of ν and λ is the speed of light, c as shown in Equation 2. c has a value of 2.998 X 10⁸ m/s. c = λν Equation 2 Molecules are highly selective in the wavelengths of light they can absorb. The photons absorbed depend on the on molecular structure and can be measured by instruments called spectrometers. The data obtained from a spectrometer are very sensitive indicators of molecular structure and concentration. UV-visible spectrophotometry (UV-VIS) uses only the ultraviolet and visible regions of the electromagnetic spectrum. UV light ranges from approximately 10 nm to about 400 nm. The visible region of the spectrum ranges from 400 nm to 700 nm. Red light lies at the low energy end of the visible spectrum and violet lies at the high energy end. UV-VIS spectroscopy depends on transitions of electrons in a molecule from one electronic energy level to another. It is used mostly in studying transition metal complexes and conjugated π systems in organic molecules. One of the principal uses of UV-VIS spectrometry is in determining the concentration of an absorbing (colored) molecule. The amount of light absorbed, and thus the intensity of the color of the solution, depends on the concentration of the absorbing species in the solution. UV-VIS absorption peaks are typically quite broad and are often spoken of as bands rather than as peaks. The wavelength at maximum absorption is referred to as λmax and is the optimal wavelength for a pure solution. For an impure solution, a “blank” solution can be prepared which contains all components of the solution except the one being analyzed. This solution is used to subtract out absorbance due to interfering species. When a beam of light with intensity, Io, passes through a solution, a colored species, or analyte, will absorb some of the light energy. The beam of light that passes through (or is transmitted through) the solution will have a lower intensity, I, than the incident light, Io because some of the light will be absorbed. Spectrometers typically measure either transmittance, T, which is the amount of transmitted light, or absorbance, A, which is a measure of the light absorbed. Both transmittance and absorbance are measures of the amount of light that is absorbed by the analyte. Transmittance is calculated by dividing the transmitted light by the incident light (Equation 3). Experimentally, however, transmittance is usually measured as the percent of the incident light or %T and is defined as shown in Equation 4. T = I/Io Equation 3 %T = (I/Io) X100% Equation 4 Absorbance is defined by Equation 5. A = -log(T) Equation 5 But since %T rather than T is actually measured, Equation 5 is changed to Equation 6. A = -log(%T/100) = log(100/%T) = log 100 – log(%T) = 2-log(%T) Equation 6 Each chemical species absorbs a different quantity of light at any given wavelength. The amount of light absorbed by a compound depends on the structure of the compound and the solvent. However, for any chemical species in a given solvent, the amount of light absorbed at a given wavelength will be a constant called the molar absorptivity, ε (also referred to as the molar extinction coefficient) (ε is the Greek letter episilon) The absorbance, A, is a function of the concentration, c, of the absorbing species and the distance the light travels through the solution, that is the pathlength, l. Absorbance can be calculated for any solution for which the molar absorptivity is known (Equation 7). A = ε.c . l Equation 7 Equation 7 is often referred to the Beers-Lambert Law or Beers’ Law for short. Since molar absorptivity and pathlength are both constants for a given instrument, one may safely assume that the absorbance is directly proportional only to the concentration of the analyte. The concentration of a solution can be determined from a Beers’ Law calibration plot prepared by measuring the %T (or A) for several solutions of known concentration (standard solutions). The Beers’ Law plot uses concentration as the independent variable (x-axis) and absorbance as the dependent variable (y-axis) as shown in Figure 1. When the absorbance of an unknown sample is determined, the concentration can then be determined by graphical interpolation from the prepared calibration graph as shown in Figure 1 for a solution with an absorbance of 0.500. Absorbance Beer's Law calibration graph 0.8 y = -0.001 + 0.055125x R= 0.99997 0.7 Absorbance = 0.50 Absorbance 0.6 0.5 0.4 Concentration = 9.0 mg/mL 0.3 0.2 0.1 0 5 10 15 Concentration (mg/mL) Figure 1. A Beers’ Law plot for an absorbing species with ε = 5.56 X 10⁻² and l = 1.0 cm. Figure 2 shows an overview of the Spectronic 20 (Spec 20) spectrometer that will be used in this experiment. Figure 3 provides an optical diagram for the instrument. Analysis of Brass Brass is an alloy composed of zinc and copper. In order to determine the copper content in a sample of brass we must first dissolve the sample. To achieve this we will use nitric acid, a strong oxidizing acid. The reaction can be described by the following equation. 3Cu(s) + 8H+(aq) + 2NO3-(aq) J 2NO(g) + 4H2O(l) + 3Cu+2(aq) Equation 8 The nitric oxide, NO, gas evolved in this reaction reacts immediately with oxygen to form brown NO2 and N2O4 gases. NO, NO2, and N2O4 are all toxic. The dissolution process therefore must be done in a working fume hood. Figure 2: An overview of the Spec 20 Spectrometer Figure 3. A schematic diagram of the optical diagram for a Spec 20. Zinc will also dissolve in nitric acid according to the following equation. Zn(s) + 2H+(aq) J Zn+2(aq) + H2(g) Equation 9 Once the sample has been dissolved in nitric acid we need a sensitive test for copper (II) ions in the presence of zinc (II) ions. A spectrophotometric test takes advantage of the fact that copper solutions are blue while zinc ions are colorless. However, aqueous copper (II) ions are light blue in color and the detection limit is quite low because the molar absorptivity of aqueous copper (II) is small. To compensate for the low ε of aqueous copper we will intensify the color by complexing it to ammonia according to Equation 10. Cu+2(light blue-green) + 4NH3 J [Cu(NH3)4]+2 (deep navy blue) Equation 10 Copper (II) ions readily form a tetraamine complex while zinc (II) does not. Consequently, copper becomes readily detectable in a UV-VIS spectrometer while zinc ions remain invisible. Standard Solutions In order to make a Beers’ law plot it is necessary to construct a standard curve. This is most easily done by preparing a single standard solution with a known concentration of copper then diluting the solution to several lesser concentrations. Equation 11 is used to calculate the amount of known solution needed to prepare a dilution of a known concentration. C1V1 = C2V2 Equation 11 In this equation C2 and V2 are the known values of concentration and volume of the desired solution respectively and C1 and V1 are the concentration and volume of the known solution. For example, if I have a known solution containing 10.0 mg/mL (C1) copper (II) and I want to make 50.0 mL (V2) of a solution containing 3.0 mg/mL (C2) copper (II), I would use equation 11 as follows (10.0 mg/mL)V1 = (3.0 mg/mL)(50.0 mL) Equation 12 Then V1 = [(3.0 mg/mL)(50.0 mL)/(10mg/mL)] = 15.0 mL Thus I need to dilute 15.0 mL of the 10.0 mg/mL solution to 50.0 mL to make the desired 3.0 mg/mL solution. Procedure Safety: Note that the gases produced during the dissolution of the brass sample are toxic. This step must be done in a fume hood. 1. Obtain a sample of brass. Record the actual mass of the sample which will be written on the container. 2. Place the sample directly into a 50 mL volumetric flask containing approximately 5-7 mL of concentrated nitric acid (Do this in the fume hood). Record your observations concerning the reaction. 3. While the sample is dissolving, prepare the assigned standard solution. The concentration of the standard will be assigned to each pair by the instructor. The standards should be in the range of 0.2 to 1.0 mg/mL. Each pair of students should prepare a different standard solution from the stock solution which will be approximately 10 mg/mL. The standards will be shared among all pairs of lab students. To prepare the standard solution: a. Calculate the volume of stock solution needed to prepare the standard with the assigned concentration as described above. Note that the volume of standard solution will depend on the volume of the volumetric flask that you will be using. b. Drain the calculated volume (measured to +/- 0.2 mL) of stock solution from a buret into a volumetric flask. Record the actual volume of the stock solution to the nearest 0.1 mL. Calculate the accurate concentration of the standard in mg/mL using the actual volume of stock solution drained. c. Add about 10 mL of water to the flask. In the fume hood add concentrated ammonia 1 mL at a time, swirling the flask after each addition. Continue the additions until you obtain the deep blue color of the copper (II) tetraamine complex. When the color doesn’t get any deeper, add an additional three mL of ammonia. Fill the volumetric flask to the mark with distilled water. Remember to read the meniscus at the bottom of the curve. Stopper the flask and mix the solution well. Label the flask with the concentration (calculated to the nearest 0.01 mg/mL). d. Place the standard solution that you prepared with those of other students in a place indicated by the instructor. Each pair of students should use at least six of the standard solutions as outlined below to construct their experimental Beer’s law calibration curve. 4. Next finish the preparation of the brass solution from step 2 above. Once the brass has dissolved, add 10 mL of water then ammonia as described in step 3c above. Fill the volumetric flask to the mark with distilled water. Stopper and mix well. 5. To perform the measurements using the spectrometer (see the appendix for additional instructions): a. Set the wavelength to 610 nm (this is λmax for the Cu(NH3)4+2 ion). b. Adjust the display to 0% by turning the power switch/Zero control knob on the front of the instrument. c. Fill a clean cuvette half-way with distilled water (this is the blank or reference solution). d. Wipe the outside of the cuvette with a paper towel to remove any fingerprints, water, or dust particles. After cleaning, handle the cuvette only by the upper rim. Place the filled cuvette into the sample compartment. Align the guide line on the cuvette with the guide mark on the sample compartment. e. Adjust the readout dial to 100%T with the Transmittance/Absorbance control knob. f. Remove the cuvette, empty it and rinse twice with a small amount of the first standard solution to be measured. Add standard solution to fill the cuvette at least half-way. g. Wipe the outside of the cuvette and place it into the sample compartment, aligning the guide line of the cuvette with the guide line of the sample compartment. h. Read the value of %T (or absorbance) from the scale. To read the scale, make sure to look at the dial in such a way that you see only a single line in the dual mirror. i. Repeat steps f-h using a new standard solution each time. Measure at least 6 standard solutions. Finally, measure your unknown brass solution. j. Remove and clean the cuvette. Turn off the spectrometer by turning the power switch knob counterclockwise until it clicks. Note: The lower concentration standards will require filtration if they contain a white precipitate. To perform filtration, use a clean, dry funnel with a pre- pleated filter paper. Filter the solution directly into the cuvette after prerinsing with a small amount of the solution. Use a separate clean and dry funnel and filter paper for each solution. 6. Dispose of all solutions in the waste container provided. Clean all glassware used for the experiment. Calculations and Report 1. Show all calculations for the standard solution that you made. 2. Calculate the absorbance for each standard and the unknown brass sample. 3. Create the Beers’ law calibration graph. Use graph paper. Draw the best fit (straight) line through the data points. If any of the data points appear to be far off the straight line you may exclude it from the graph but the exclusion requires an explanation in your discussion. You may use a computer to make your graph; however, a copy of the graph must be included in your report. A computer graph must include labeled axes (with appropriate scale marks) and the best fit line must be fitted through the points. 4. Use the created calibration graph (or the equation of the best fit line) to determine the concentration of copper in the solution. 5. Use the concentration of copper in the unknown brass solution and the volume of the solution to calculate the mass of copper in the original brass sample. 6. Calculate the weight percent of copper in the brass sample. %Cu = (mass of copper/mass of brass) X 100%. Discussion Write a brief discussion of your results in which you state your experimental results including the mass of copper in the sample and the % copper in the brass sample. Describe any errors made and state ways you could improve your experimental technique. Experiment 12 Data Table Mass of brass (samples are preweighed) ___________________________ Volume of sample created ________________________________ Sample (mg/mL) %Transmittance Absorbance Chemistry 1215, Experiment #12; Spectrophotometric Analysis of an Unknown Brass Sample, Pre-lab Name ____________________________________ 1. Explain why is it necessary to wipe the outside of the cuvette before performing a spectrophotometric measurement. 2. Use the graph in Figure 1 to determine the concentration of an unknown sample for which the measured %T is 20%. Show any calculations. 3. A student correctly prepared the standard solutions used to create a standard curve for copper analysis. However, in preparing his brass sample he forgot to add ammonia. Explain in detail what effect this error will have on his final result. Will the measured percent copper in the brass sample be high or low? 4. A student used a 10.54 mg/ml copper stock solution to prepare a set of standards to create a copper standard curve. If the standard solutions were made in 50.0 mL volumetric flasks, how much of the stock solution should be diluted to make a final concentration of 0.75 (mg Cu)/mL? Chemistry 1215, Experiment #12; Spectrophotometric Analysis of an Unknown Brass Sample, Post-lab Name ____________________________________ 1. When determining the Transmittance of the brass sample solution, a student rinsed the cuvette with water but not with sample solution before taking the measurement. Explain in detail what effect of this error will have on the final result. Will the final answer be high or low? 2. A 50 mg brass sample was placed in a 50.0 mL volumetric flask. The sample was prepared according the procedure outlined in this lab and its transmittance was measured to be 35%. Use the graph in Figure 1 to determine the mass percent of copper in the sample. Show all calculations. 3. In an experiment a student used a 50 mL volumetric flask to prepare her brass solution but in calculations she used 100 mL as the sample volume. What effect will this error have on the final result? Will the calculated result be high of low? 4. Methyl viologen (also called paraquat) is a redox active dye that is blue in the reduced state and colorless in the oxidized state. The reduced compound is capable of passing electrons to and from the active centers of redox active enzymes. The molar absorptivity of methyl viologen at a wavelength of 600 nm is 13,000 L/(cm.mol).Use Beer’s law to determine the concentration of a methyl viologen solution that has an absorbance of 1.600 in a 1.00 cm cuvette. Appendix 1: Using a Spectronic 20 (From the Dartmouth University website) Spectronic 20 A Spec 20 spectrometer measures the amount of visible light absorbed by a colored solution. This can be read as Absorbance or % Transmittance. Setting Up the Spectrometer Check that the instrument is turned on. The lefthand knob should be turned clockwise. Allow 10 minutes for warming up. Set the wavelength to the desired value using the knob on the top. Calibrating the Spectrometer With empty, closed sample compartment, turn the lefthand knob to obtain a reading of 0% T. Use the mirror behind the needle to avoid parallax error. Use the arrow button below the image to view more about parallax error. Having trouble viewing the slideshow? Help is here. Wipe the cuvette with a dry Kimwipe to remove drops of solution or finger prints. Line up the mark on the cuvette with the line on the sample compartment. Insert cuvette filled with solvent in the sample compartment. Close the cover. Turn the right-hand knob to obtain a reading of 100% T. Using the Spectrometer To analyze your sample, insert sample cuvette and read the Absorbance value on the scale. Use the mirror behind the needle to avoid parallax error.
© Copyright 2026 Paperzz