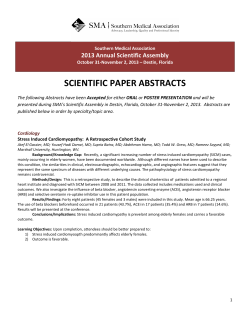
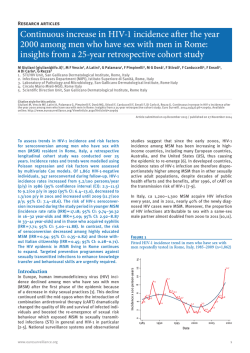
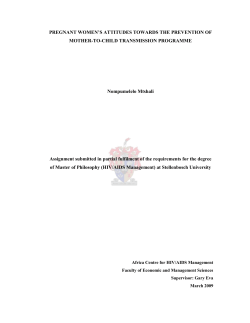
Mediterranean Journal of Medical Sciences Volume 1, Issue 1, October 2014: 21-30
Original Paper
Assessment Of Nutritionnal Status Of Hiv
Infected And Hiv Negative Pregnant Women In
Ngaoundere, Cameroon
M Dangwe 1, 2, C M Mbofung1
1
Laboratory of Biophysics, food biochemistry and Nutrition
Laboratory of Protestant hospital of Ngaoundere
2
Background & objectives: Malnutrition (underfeeding) can affect the treatment of AIDS in
that it reduces the ability of the intestine to absorb drugs, organic substances and
micronutrients. Underfeeding could also increase the chances of transmission of the disease
from an infected mother to the baby during pregnancy. The objective of this study is to
compare the energy intake, weigh rate and nutritional status between the HIV and non HIV
pregnant women attending two referrals hospitals in Ngaoundere (Cameroon).
Methods:A cross sectional study using 24-hour dietary recall was applied to a sample of 109
women, randomly selected from a population-based and anthropometric data were done.
Results: Result show that HIV negative pregnant women consumed less energy intake per
day than the HIV infected pregnant women at all age groups with no significant difference
(Fcal=1.19, p=0.317). Gain in weight between the HIV infected and HIV negative pregnant
women in relation to their various age groups was no significant (F= 1.23, p=0.27). There was
no significant influence of HIV status in pregnant women BMI (F=2 29, p=0.133).
Interpretation & conclusion:In this study, the higher consumption of energy by HIV infected
pregnant women than HIV negative women could be because HIV infected pregnant women
were at the beginning of the infection which has not yet affected the immune system. In the
two referral hospital of Ngaoundere besides HIV screening tests, should be also nutritional
services to advice these women on their nutritional habits.
Keywords: Malnutrition, Body mass Index, HIV/AIDS, energy consumption
1. Introduction
Acquired Immune Deficiency
Syndrome
(AIDS)
is
an
infectious disease caused by the
Human Immunodeficiency Virus
(HIV) which appeared for the
first time in the mid 1980 (BICE,
1993).
The
Human
Immunodeficiency Virus (HIV)
reproduces in certain blood cells
and more specifically in the white
blood cells (WBC). The HIV
thus attacks and weakens the
immune system rendering the
victim vulnerable to infections. It
Mediterranean Journal of Medical Sciences V1, I1 October 2014: 21-30
has ravaged sub-Sahara Africa for
decades and is still a major cause
of adult morbidity and mortality
(Masanjala,
2007).
Recent
estimates by the World Health
Organization (WHO) show that
about 33.3 million people are living
with HIV/AIDS worldwide with
22.5 million living in sub-Saharan
Africa (Global Report, 2010). The
prevalence in Cameroon stands at
5.5 % with the Adamawa region
occupying the 5th position with 6.9
% (Comité National de Lutte
contre le Sida, 2004).
Studies outlined that there
is
a
relationship
between
malnutrition and AIDS (AIDS
institute, 1995). Research shows
that, the chance of infection with
the HIV virus might be reduced
in individuals who have good
nutritional
status
with
micronutrients and especially,
vitamin A playing significant
roles (ACC, 1998). Malnutrition
(underfeeding) can affect the
treatment of AIDS in that it
reduces the ability of the
intestines to absorb drugs, organic
substances and micronutrients.
Underfeeding could also increase
the chances of transmission of the
disease from an infected mother
to the baby during pregnancy
(Semba, 1997).
This affirmation thus necessitates
certain
questions
on
the
increasing rate of HIV positives
in this region of the world, which
©2014 Mediterranean Center of Medical Sciences
22
is one of the most affected
(CNLS, 2004). One would
therefore be tempted to believe
that underfeeding plays an
important role in increasing the
damaging
effects
of
the
HIV/AIDS. In the town of
Ngaoundere, there is a dearth of
informations on the relationship
between
underfeeding
and
HIV/AIDS. Thus, this study was
undertaken to compare the energy
intake, weight rate and nutritional
status between the HIV and nonHIV pregnant women attending
two
referrals
hospitals
in
Ngaoundere, Cameroon.
2. Materials And Methods
Study Area
Ngaoundere is the capital city of
the Adamawa Region, Cameroon.
The city is located at latitude
70.19’N and longitude 13034’E. Its
population was estimated at
about 230,000 inhabitants in 2001
(Tchotsoua, 2006).The Adamaoua
region is high in altitude; its
whether is between 22 and 250.
This plateau contains 2 types of
climates: the Sudanese type of
tropical
climate
and
the
Cameroon type of equatorial
climate. The Sudanese type of
tropical climate has a dry season
covering the period of November
to March; then comes the moist
season with down falls ranging
from 900 mm to 1500mm. The
N. A. Qureshi et al
Cameroon type of equatorial
climate has a long dry season
followed by a long rainy season.
The down falls here range
1500mm to 2000mm per year
(Okouba and al., 2010).
Study population and Design
The study was cross-sectional in
design. Pregnant women that
attended antenatal services of the
two
referral
hospitals
in
Ngaoundere
(Protestant
and
Regional) were enrolled for the
study. The study was conducted
from May 2003 to January 2005. A
total of 109 pregnant women at
their
third
trimester
were
randomly selected and enrolled
for the study. They were grouped
into HIV infected (13) and nonHIV infected (96).
Four age groups were ranged for
the evaluation of age influence as
a factor studied (<19 years, 19-22
years, 23-26 years, > 27 years).
Questionnaire Administration
Questionnaires were administered
to the women to collect data on:
Age, level of education, number of
children, gravidity, preferred
meals, family inherited illnesses,
certain disease frequency in the
family and pre-natal treatments.
Nutritional feeding habits were
obtained through interviews on
the diets. A 24-hour dietary recall
was applied to a sample of
women, randomly selected from a
23
random population-based study
sample. Most of the women had
common feeding habits and their
common meals were reported to
be
cereals
(maize),
tubers
(cassava) and vegetables.
The
conversion of quantity consumed
into calories was done with the
help of a chart on food and
nutritive value (FAO, 1968;
Yadang, 2000).
Assessment of nutritional status
of the pregnant women
Anthropometry
is
the
measurement of human body. It is
a quantitative method and is
highly sensitive to nutritional
status (Amuta and Houmsou,
2009).
The
anthropometric
factors: Weight (Kg) and Height
(m) were used to calculate the
Body Mass Index (BMI) as:
BMI =
As the aforementioned formula
reflects the human body without
pregnancy, we subtracted the
foetal weight from the total
weight of the pregnant woman to
get the exact BMI.
We generally assume that a body
mass index less than 18.5 implies
that the woman is thin and
between 18.5 and 25, we say the
woman has a normal weight
meanwhile values superior than 25
indicates over weight (Gallagher
and al.,2000).
http://www.mcmscience.org
Mediterranean Journal of Medical Sciences V1, I1 October 2014: 21-30
Statistical analysis
Collected data were analyzed
using Statgraphics 3.0. The one
way ANOVA test was used to
find
significant
difference
between
the
means.
The
significance level was at p≤0.05
level.
3. Results
Comparison of energy intake
between HIV infected and HIV
negative pregnant
women
in
Ngaoundere,
Cameroon
The quantity of energy consumed
by HIV negative pregnant women
and HIV infected pregnant
women is shown in Figure 1. The
result shows that HIV negative
pregnant women consumed less
energy intake per day than the
HIV infected pregnant women at
all age groups with no significant
difference (Fcal=1.19, p=0.317).
Variation in weight gain of HIV
infected and HIV negative
pregnant women.
Studies and analysis of the weight
parameter of HIV infected and
HIV negative pregnant women
showed that the daily weight gain
by HIV negative pregnant women
is 0,041 ± 0,029 kg/day , 0.042 ±
0,033 kg/day; 0,054 ± 0,047 kg/day;
0,057 ±0.06 kg/day for group I, II,
III
and
IV
respectively,
©2014 Mediterranean Center of Medical Sciences
24
meanwhile for HIV infected
women it is 0.038 ± 0.023kg/day;
0.039 ± 0.014kg/day; 0,044 ±
0,012kg/day; 0,017 ± 0.037 kg/day
for group I, II, III and IV
respectively (Figure 2). No
significance
difference
was
observed in weight gain between
the HIV infected and HIV
negative pregnant women in
relation to their various age
groups (F= 1.23, p=0.27).
Body Mass Index (BMI) of HIV
infected and HIV negative
pregnant women
The body mass index of HIV
infected and HIV negative
pregnant women is shown in
Figure 3. It is observed that HIV
status does not influence pregnant
women BMI (F=2 29, p=0.133).
Pregnant women were grouped
into 3 depending on their Body
Mass Index (Table 1). Results
showed that 0,92% of the HIV
infected pregnant women are
underweight , 7,34%
are of
normal size, and
3,67% are
overweight, while 0.92% of the
negative were of underweight
46,79%are of normal size, and
40,36% are overweight. Although
according to the body mass index
of women at the start of
pregnancy, 18.34% are thin and
81.65% normal.
N. A. Qureshi et al
25
Table 1: Percentages on the Body Mass Index of HIV infected and HIV negative pregnant
women in relation to their age group.
Number
HIV positive (%)
HIV Negative (%)
BMI (Kg/m2)
Underweight (< 18.5)
1 (0,92)
1 (0,92)
Normal weight (18.5-25)
8 (7,34)
51 (46,79)
Overweight (˃ 25)
4 (3,67)
44 (40,36)
4000
3500
3000
Energy (Kcal/J)
2500
HIV negative pregnant women
2000
HIV infected pregnant women
1500
1000
500
(Years)
0
< 19
19-22
23-26
27-35
Fig1: Comparison of energy intake between HIV infected and HIV negative
pregnant women in relation to age.
http://www.mcmscience.org
Mediterranean Journal of Medical Sciences V1, I1 October 2014: 21-30
26
120
HIV negative pregnant women
HIV infected pregnant women
100
weight *10-3 (kg)
80
60
40
20
0
<19
19-22
23-26
27-35
Years
Fig 2: Variation in weight gain among HIV infected and HIV negative pregnant women
in relation to age groups
35
30
Body mass index (BMi) (kg /m2)
25
20
HIV negative pregnant women
HIV infected pregnant women
15
10
5
0
<19
19-22
23-26
27-35
(Years)
Fig 3: Variation in Body Mass Index among HIV infected and HIV negative pregnant
women in relation to age group
©2014 Mediterranean Center of Medical Sciences
N. A. Qureshi et al
4. Discussion
Generally, the energy intake by
HIV infected pregnant women
appears to be higher than that of
HIV negative pregnant women.
This could be because HIV
infected pregnant women were at
the beginning of the infection
which has not yet affected the
immune system. It could be also
due to the fact that there were not
aware of their HIV status which
could have affected their mind
therefore influencing them to lose
weight through their thoughts. A
study reported that the quantity
of energy necessary for pregnant
women of the third trimester is
2,250 kcal per day. However, a
comparison of the energy taken by
the HIV negative and HIV
infected pregnant women in this
study revealed that the energy
levels were higher than values
reported by Dupin and al
(1992).This could be justified by
the fact that these pregnant
women were in the third trimester
of pregnancy when they have the
tendency of eating a lot
irrespective of their HIV status.
In our study group, we noticed
that infected pregnant women and
non infected pregnant women
gain weight during pregnancy.
We observe that the biggest mean
rates of gain for 3rd trimester of
pregnancy in our population
27
group is 0,399kg/wk for HIV
negative pregnant women and
0,308 kg/wk for HIV infected
pregnant women. The presumably
gain weight from HIV-uninfected
adult women from the United
States and Europe are 0,30 to 0,54
kg/wk during the 3rd trimester.
However, people on whom we
worked have weight ranges these
values. This result is similar to
those reported by Strauss and al.
(1999) and Ladner and al (1998),
but contrasts that of Kim and al.
(1996) who observed
HIV
infected subjects to be suffering
from underfeeding and weight
lost at the onset of the infection.
The difference between our study
and that observed by Kim et al.
(1996) is that the subjects enrolled
in our study were found to have
more energy intake than the
recommended
energy
consumption. The energy surplus
consumed by these pregnant
women would have compensated
the expected weight. We did not
find further evidence in the
literature
that
suggested
differences in the pattern of
weight gain by HIV status. But
we know that lean body mass loss
can be improved when nutrition
counseling is combined with
nutritional interventions (Stack
and al.,1996). The body mass index
observed in our study show that
HIV status does not influence the
http://www.mcmscience.org
Mediterranean Journal of Medical Sciences V1, I1 October 2014: 21-30
weight gain by pregnant women.
This result is similar with studies
reported in Tanzania who find
that there is not significant
difference between body mass
index infected and HIV-negative
women (Villamor and al., 2004).
This could be justified by the fact
that these infected women are at
the beginning of their illness.
5. Conclusion
Our study report that, no
significant
difference
was
observed between HIV infected
and HIV negative pregnant
women with regards to energy
intake and weight gain. Our
results also showed that age
groups and HIV status had no
significant influence on the
pregnant women’s Body Mass
Index. Besides HIV screenings
test, were done to the women
attending their antenatal services
in there should be also nutritional
services to advice these women on
their nutritional habits.
Acknowledgements
The authors thank the
pregnant women that attended the
regional and protestant hospitals
of the Adamaoua region for their
kindness and collaboration which
allowed successful data collection.
The nurses of antenatal services
both
hospitals
are
also
acknowledged.
©2014 Mediterranean Center of Medical Sciences
22
References
1. ACC/SCN. 1998. Overview to feature:
Nutrition and HIV/AIDS.
SCN News, 17:3-4.
2. AIDS INSTITUTE.,1995. Nutrition in
HIV/AIDS
infections.
Available at Http://aidsinfonye.
Org/ai/nutrit.hlnl.
Accessed
April 12, 2001.
3. Amuta, E.U.and Houmsou, RS. (2009).
Assessment of Nutritionist
Status of school children in
Makurdi, Benue State. Pakistan
Journal of Nutrition, 8 (5):691694.
4. BICE
(Bureau
International
Catholique de l’enfance)., 1993.
SIDA
les
enfants
aussi.
L’enfance dans le Monde.vol.20,
N° 2-3/93.
5. CNLS (Comité National de Lutte
contre le SIDA au Cameroun) .,
2004. SIDA! Ce que vous devez
savoir Manuel destiné aux
professionnels de la santé.
6. Dupin H; Cuq jean louis; M-I
Malewiak,
C.leynaudRouaud,A-M.
(1992).
Alimentation
et
Nutrition
humaines. Berthier ESF Editeur
ISBN 2.7101.0892.5
7. FAO
(Food
and
Agriculture
Organization of the United
Nations).,
1968.
Food
composition table for use in
Africa. Department of Health,
Education and welfare public
health service, Rome, Italy.
8. Gallagher D, Heymsfield SB, Heo M
Jebb SA, Murgatroyyd PR,
Sakamoto Y. (2000). Healthy
percentage body fat ranges: an
approch
for
developing
guidelines based on body mass
index. American Journal of
clinical Nutrition; 72 (3): 694701.
N. A. Qureshi et al
9. Global Report (2010). UNAIDS report
on
the
global
AIDS
epidemic.364pp.ISBN:978-92 9173-871-7.
10. Kim J. H; Donna S; Eric R and
Sherwood L G ., 1996. Boston,
and the department of family
Medicine
and
community
Health, Tufts University School
of Medicine, Boston.
11. Ladner, J., Castetbon, K., Leroy, V.,
Nyiraziraje, M., Chauliac, M.,
Karita, E., De Clercq, A., Van de
Perre, P. & Dabis, F. (1998).
Pregnancy, body weight and human
immunodeficiency virus infection in
African women: a prospective
cohort study in Kigali (Rwanda),
1992–1994. Int. J. Epidemiol.
27:1072-1077.
12. Masanjala, W., 2007. The povertyHIV/AIDS nexus in Africa: A
livelihood approach. Social Science
et Medicine, 64 (5): 1032-1041.
13. Okouba Barnabe ; Ambroise Abanda ;
Tchomthe séverin ., 2010. Rapport
Régional des Progrès des objectifs
du
millénaire
pour
le
développement.
Région
de
l’Adamaoua. Sous la coordination
de l’Institut National de la
statistique du Cameroun avec
l’appui du PNUD. Ministère de
l’Economie de la Planification et de
l’Aménagement du Territoire.
14. Semba R D., 1997.Overview of the
potential role of vitamin A in
mother-to child transmission of
HIV-1. Acta paediatr suppl
421:107-112.
23
15. Sibetcheu, D; Nanka, P. M; Tatat , J;
Ngoh,G. M.M; Hakoua, A.,
2000. Enquêtes Nationales sur la
carence en vitamines A et
l’anémie au Cameroun.
16. Statgraphics
plus
3.0
(1994).
Statgraphics
for
windows
version release 3.0.
17. Strauss, R. S. & Dietz, W. H. (1999).
Low maternal weight gain in the
second or third trimester
increases
the
risk
for
intrauterine growth retardation.
J. Nutr. 129:988-993.
18. Tchotsoua
(2006).
Evolution
récente des territoires de
l’Adamawa central: de la
spatialisation à l’aide pour un
développement
maîtrisé.
Université d’Orléans. Ecole
doctorale sciences de l’homme
HDR.
et de la société.
(Géographie
Discipline
Aménagement-Environnement).
p 267.
19. Villamor Eduardo; Michele L.
Dreyfuss; Ana Baylín*; Gernard
Msamanga; Wafaie W. Fawzi*
(2004). Weight loss during
pregnancy is associated with
adverse pregnancy outcomes
among HIV-1 infected women
The American Society for
Nutritional Sciences.
20. Yadang, 2000. Etude de la valeur
nutritive de quelques mets de
l’Extrême-Nord
Cameroun.
Mémoire soutenue en vu de
l’obtention de la Maitrise en
Biologie
Appliquée.
Département
des
sciences
Biologiques.
Université
de
Ngaoundere.
http://www.mcmscience.org
Mediterranean Journal of Medical Sciences V1, I1 October 2014: 21-30
©2014 Mediterranean Center of Medical Sciences
24
Background objectives: Malnutrition (underfeeding) can affect the treatment of AIDS in that it reduces the ability of the intestine to absorb drugs, organic substances and micronutrients. Underfeeding could also increase the chances of transmission of the disease from an infected mother to the baby during pregnancy. The objective of this study is to compare the energy intake, weigh rate and nutritional status between the HIV and non HIV pregnant women attending two referrals hospitals in Ngaoundere (Cameroon). Methods: A cross sectional study using 24-hour dietary recall was applied to a sample of 109 women, randomly selected from a population-based and anthropometric data were done. Results: Result show that HIV negative pregnant women consumed less energy intake per day than the HIV infected pregnant women at all age groups with no significant difference (F cal =1.19, p=0.317). Gain in weight between the HIV infected and HIV negative pregnant women in relation to their various age groups was no significant (F= 1.23, p=0.27). There was no significant influence of HIV status in pregnant women BMI (F=2 29, p=0.133). Interpretation conclusion: In this study, the higher consumption of energy by HIV infected pregnant women than HIV negative women could be because HIV infected pregnant women were at the beginning of the infection which has not yet affected the immune system. In the two referral hospital of Ngaoundere besides HIV screening tests, should be also nutritional services to advice these women on their nutritional habits. Keywords : Malnutrition, Body mass Index, HIV/AIDS, energy consumption
© Copyright 2026 Paperzz