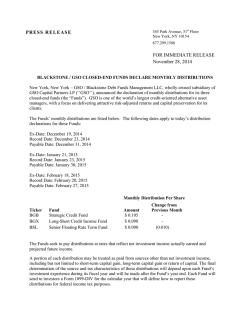
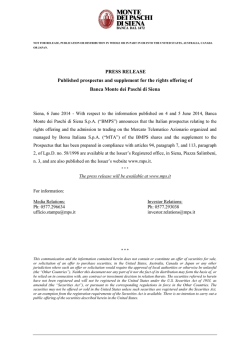
Carador Income Fund Plc (CIFU LN) December 2014 U.S. $ Share Total NAV Return Performance Data: (1, 3, 4) MONTH END SHARE PRICE DATA (2,5) Total Return Data -0.07% NAV per U.S. $ Share: $0.8993 U.S. $ Share Closing Price: $0.8963 Premium/Discount: -0.33% Market Capitalisation: Total Asset Value: $486.9m $488.6m Dividend: U.S. $ Shares Historic Yield: Q4 2014 Dividend per U.S. $ Share: Q3 2014 Dividend per U.S. $ Share: Q2 2014 Dividend per U.S. $ Share: Q1 2014 Dividend per U.S. $ Share: 11.16% $0.025 $0.025 $0.025 $0.025 KEY FACTS Manager: GSO / Blackstone Debt Funds Management LLC - Mark Moffat +44 20 7104 4668 - Poh Heng Tan +44 20 7451 4411 - Marisa Virseda +44 20 7451 4449 - Adam Hockley +44 20 7451 4273 Overview: Carador Income Fund Plc (‘Carador’, the ‘Company’ or the ‘Fund’) is an Irish closedend fund listed and traded on the London Stock Exchange. Investment Objective: To produce attractive and stable returns with low volatility compared to equity markets by investing in a diversified portfolio of Senior Notes of CLOs collateralised by senior secured Bank Loans and equity and mezzanine tranches of CLOs. Dividends: Carador operates a distribution policy which pays dividends quarterly from the net income received from investments save for CLO equity notes where an element of cash receipts can be treated as capital. Fees: Management 1.5% Performance 13% (Hurdle: NAV increased by the greater of: 12 month $LIBOR plus 2%; and 6%. Subject to a high watermark) Contact details: Carador Income Fund Plc Ciara Timon State Street Fund Services (Ireland) Limited Company Secretary Tel: +353 1 776 6483 [email protected] Annualised Vol (%) YTD (%) Carador Income $ Share NAV -0.07% 6.30% 6.30% 18.61% 23.94% 10.30% CS Leveraged Loan Index ($) -1.10% 2.06% 2.06% 5.84% 5.83% 5.71% CS High Yield Index ($) -1.72% 1.86% 1.86% 7.91% 8.68% 7.78% S&P 500 Index -0.26% 13.68% 13.68% 20.40% 15.45% 14.37% U.S. $ Share Class Cumulative NAV Performance: (1, 4) 320 300 Total Return (Base 100) U.S. $ Shares Monthly NAV: Annualised 1 Annualised 3 Annualised 5 year (%) years (%) years (%) 31-Dec-14 280 260 240 220 200 180 160 140 120 100 80 Carador Income Fund $ NAV Total Return CS HY Index CS Leveraged Loan Index Market Commentary: December was an uncertain month for many markets globally. The acceleration of the decline in oil prices, steep falls in the Russian rouble, and the failure of Greece to elect a President forcing imminent elections, each focussed attention on risk assets. With this background it was not surprising to see both leveraged loans and high yield bonds in the U.S. fall, with the respective Credit Suisse indices returning -1.10% and -1.72% in December, taking 2014 total returns to +2.06% and +1.86%, respectively. The Company outperformed both indices in the month and has outperformed both during 2014 by +4.24% and +4.44%, respectively. (4) The U.S. loan market ended 2014 with total new institutional issuance volume of $379 billion, down from the 2013 total of $455 billion. In part, the decline was due to the welcome fall in loan refinancings to $101 billion from $213 billion in 2013. Q4 2014 was a particularly light quarter with just $44 billion of new U.S. loans, a three year low, as loan spreads widened given volatility in the oil and gas sector and continued retail loan fund outflows. (8) There were no defaults in December so the S&P lagging 12 month default rate, by number, ended the year at 0.62%, a 21 month low. However, 2015 has started with the expected default of Caesars Entertainment ($5.4 billion of bank loans outstanding). As at 31 December 2014, Carador had a negligible look-through exposure to Caesars of 0.077%. (8) Secondary CLO volumes were light in December as a bid:offer gap emerged on how severely to treat oil and gas exposure. The new year has started with a gradual pick-up in secondary activity although CLO Income Note prices remain relatively soft which, given a growing primary CLO pipeline and continued declines in the oil price, we believe is likely to continue into February. Fund Commentary: The Company received an estimated $16,239,545 worth of net cash flows in Q4 2014 (Q3 2014; $13,650,265) or approximately $0.0299 per share. The annualised cash on cash payments on Income Notes received by the Company during Q4 2014 ranged from 9.36% to 38.57% (weighted average; 20.21%) based on original purchase price, or 9.10% to 50.01% (weighted average; 25.26%) based on the latest valuation. In total, an estimated 7.05% of the cash flow received by the Company from Income Notes during Q4 2014 was allocated to principal (Q3 2014; 5.49%). The Company added three positions in December at varying risk:return levels: firstly, in the secondary market, an Income Note from a 2013 vintage CLO managed by THL Credit Advisors for a target 14% IRR; secondly, a primary B rated investment from the same manager for a target 11.6% IRR; and lastly a BB investment from a primary CLO managed by Highbridge Capital for a target IRR of 9.8%. Prices for both the BB and B bonds were in the high 80s offering upside in the event of higher than forecast prepayments. Concurrent with the release of this report the Board has declared a dividend of $0.0250 per U.S. Dollar Share for Q4 2014 taking the total declared dividends in respect of 2014 to $0.100 per U.S. Dollar Share representing approximately 95% of the net income for the year. The dividend is payable on 4 February 2015 to shareholders on the register as at the close of business on 30 January 2015 and the corresponding Ex-Dividend Date will be 29 January 2015. The Directors also announced that for 2015 the Company will maintain a target annual dividend of $0.100 per U.S. Dollar Share distributed evenly in four quarterly payments. Based on the closing share price of $0.8988 on 21 January 2015 this would equate to a prospective dividend yield of 11.1%. For footnotes, please see final page. Your attention is drawn to the disclaimer on the final page of this document. Past performance is not necessarily indicative of future performance results and there can be no assurance that Carador will continue to achieve comparable results. Page 1 Carador Income Fund Plc (CIFU LN) December 2014 Portfolio Income Statement: (6) Distributions Received From Income Notes: - Diverted to Capital: - Allocated to Income: Income Accrued from Debt Investments: Total Gross Income: 4Q14 to 3Q14 to 31-Dec-14 30-Sep-14 16,168,899 13,814,128 (1,140,250) (758,663) 15,028,649 13,055,464 2,208,322 2,414,633 $17,236,971 $15,470,097 Change +17.05% +50.30% +15.11% -8.54% +11.42% Estimated Expenses during Period: Estimated Annualised Total Expense Ratio during Period: ($2,137,676) ($2,578,496) 1.74% 2.06% -17.10% -15.70% Net Income: Net Cash Flow / Net Income: Net Income per USD Share: $15,099,295 $12,891,602 1.08x 1.06x $0.0278 $0.0237 +17.13% Portfolio by Tranche: (7) Portfolio Look-Through Exposure by Industry: (7) Income Notes (Unrated), 64.9% 60.00% 50.00% 30.00% Cash, 0.8% 10.00% 0.00% -10.00% Aerospace and Defense 2% Containers and Glass Products 2% Food Products 2% Industrial Equipment Lodging and Casinos 2% 3% Broadcast Radio & Television Automotive 3% 3% Electronics / Electric 7% Chemicals / Plastics 4% Retailers (except food and drug) 4% Cable Television 4% Telecommunicatio Financial ns Intermediaries 3% 3% Utilities 3% Leisure Goods/Activities/ Movies 4% Oil and Gas 4% Portfolio by NAV of Securities: (5) Portfolio by Par Value of Securities: Mezzanine Notes (Original rating BBB/BB/B) Income Notes (Unrated) Business Equipment & Services 8% Other 27% Non-Ferrous Metals / Minerals 2% 40.00% 20.00% Healthcare 9% Building and Development 2% Mezzanine Notes (Original Rating A/BBB/BB/B), 34.3% 70.00% +17.28% $186,775,145 $440,950,017 Mezzanine Notes (Original rating BBB/BB/B) Income Notes (Unrated) $167,395,983 $317,314,344 Portfolio top 10 look-through exposures by individual issuers (7) Carador is currently exposed on a look-through basis to greater than 1,300 individual corporates. Issuer Rating Sector % 1 2 Calpine First Data Ba3/BB B1/BB- Utilities Financial Intermediaries 0.91% 0.83% 3 4 5 6 7 8 9 10 Community Health Systems Asurion Mediacom Freescale Semiconductor FMG Resources Charter Communications Valeant Pharmaceuticals Delta Airlines Ba2/BB Ba3/B Ba3/BB B1/B Ba1/BB+ Baa3/BB+ Ba1/BB Ba1/BBB- Healthcare Insurance Cable Television High Tech Industries Metals & Mining Cable Television Healthcare Air Transport 0.81% 0.72% 0.63% 0.61% 0.60% 0.60% 0.58% 0.57% For footnotes, please see final page. Your attention is drawn to the disclaimer on the final page of this document. Past performance is not necessarily indicative of future performance results and there can be no assurance that Carador will continue to achieve comparable results. Page 2 Carador Income Fund Plc (CIFU LN) December 2014 Portfolio Details: Investment (*) 1 ACASC 2013-1X F 2 ACASC 2013-2X E 3 ADPK 2013-1A E 4 APID 2013-14A E 5 APID 2013-14A F 6 APID 2013-14A INC 7 APID 2014-17X E 8 Ares 2007-3 RA E 9 Ares 2013-3X SUB 10 ARES 2014-32X E 11 BABSN 2013-IX SUB 12 BRCHW 2014-1X INC 13 BNPIP 2014-1X D 14 BNPIP 2014-1X E 15 BNPIP 2014-1X SUB 16 Callidus V-X INC 17 Callidus VI-A INC 18 Callidus VII-A INC 19 Carlyle Daytona CLO B2L 20 Carlyle Daytona CLO INCOME 21 CDAR 2013-1A SUBA 22 CLRLK 2006-1A D 23 DRSLF 2013-26I SUB 24 Eaton Vance CDO VIII SUBORD 25 EATON 2014-1X INC 26 ECP 2014-6X E 27 FLAT 2014-1X SUB 28 Gale Force 3 CLO E 29 Gale Force 3 CLO PREF 30 Gale Force 4 CLO INCOME 31 HLM 2015-5X E 32 Inwood Park CDO 2006-1 A E 33 Inwood Park CDO SUBORD 34 KEUKA 2013-1A E 35 Mountain View CLO II E 36 NACLO 2006-1 A E 37 NEUB 2013-14A E 38 NEUB 2013-14A SUB 39 NEUB 2013-15X SUB 40 NEUB 2014-16X F 41 NEUB 2014-17X SFN 42 NEUB 2014-17X SUB 43 NYLIM Flatiron CDO 2006-1 SUBORD 44 OHAPA 2007-1A SUB 45 PPARK 2014-1A SUB 46 Rampart CLO 2007-1A SUBORD 47 Saturn 2007-1 D 48 Sheridan Square 2013-1A F 49 Sheridan Square 2013-1A INC 50 Silverado CLO 2006-I SUBORD 51 SMORE 2014-1X BSUB 52 SPARK 2014-1X SUB 53 TPCLO 2013-1X E 54 TPCLO 2013-1A SUB 55 VOYA CLO II Pref 56 WINDR 2013-2A INC 57 WINDR 2014-3X F Cash Manager American Capital Leveraged Finance American Capital Leveraged Finance GSO / Blackstone Debt Funds Management LLC Apidos Capital Management Apidos Capital Management Apidos Capital Management Apidos Capital Management Ares Capital Management Ares Capital Management Ares Capital Management Babson Capital GSO / Blackstone Debt Funds Management LLC BNP Paribas Asset Management BNP Paribas Asset Management BNP Paribas Asset Management GSO / Blackstone Debt Funds Management LLC GSO / Blackstone Debt Funds Management LLC GSO / Blackstone Debt Funds Management LLC The Carlyle Group The Carlyle Group 40/86 Advisors Babson Capital Prudential Investment Management Eaton Vance Eaton Vance Silvermine Capital Management LLC New York Life GSO / Blackstone Debt Funds Management LLC GSO / Blackstone Debt Funds Management LLC GSO / Blackstone Debt Funds Management LLC Highbridge Principal Stategies GSO / Blackstone Debt Funds Management LLC GSO / Blackstone Debt Funds Management LLC GSO / Blackstone Debt Funds Management LLC Seix Advisors Fortis Investment Management Neuberger Berman Neuberger Berman Neuberger Berman Neuberger Berman Neuberger Berman Neuberger Berman New York Life Oak Hill Advisors GSO / Blackstone Debt Funds Management LLC Stone Tower Debt Advisors Pinebridge Investments GSO / Blackstone Debt Funds Management LLC GSO / Blackstone Debt Funds Management LLC Wells Capital Management Silvermine Capital Management LLC GSO / Blackstone Debt Funds Management LLC GSO / Blackstone Debt Funds Management LLC GSO / Blackstone Debt Funds Management LLC VOYA Alternative Asset Management THL Credit Advisors THL Credit Advisors Original Rating NR/B NR/B NR/BBNR/BB NR/B NR/NR B2/NR Ba2/BB NR/NR B2/NR NR/NR NR/NR NR/BB NR/B NR/NR NR/NR NR/NR NR/NR Ba2/BB NR/NR NR/NR Ba2/BB NR/NR NR/NR NR/NR B2/NR NR/NR Ba2/BB NR/NR NR/NR NR/BB Ba2/BB NR/NR Ba3/NR Ba2/BB Ba2/BB NR/BB NR/NR NR/NR NR/B NR/NR NR/NR NR/NR NR/NR NR/NR NR/NR Ba2/BB NR/B NR/NR NR/NR NR/NR NR/NR NR/B NR/NR NR/NR NR/NR B1/NR % NAV 0.91% 1.25% 1.01% 0.71% 0.87% 1.15% 2.05% 1.36% 2.39% 0.70% 3.98% 0.19% 3.01% 2.44% 4.04% 1.18% 1.75% 0.25% 2.38% 0.66% 1.69% 1.21% 1.05% 1.47% 1.52% 0.70% 5.77% 0.80% 1.07% 1.60% 0.90% 2.36% 2.59% 1.45% 1.60% 0.99% 1.27% 3.37% 0.61% 2.07% 0.31% 5.21% 0.18% 1.15% 4.89% 1.11% 0.81% 2.11% 6.81% 0.17% 1.46% 1.33% 0.84% 2.22% 2.96% 0.85% 0.45% 0.81% (*) Investment in Gale Force 3 Combination Note split into individual components For footnotes, please see final page. Your attention is drawn to the disclaimer on the final page of this document. Past performance is not necessarily indicative of future performance results and there can be no assurance that Carador will continue to achieve comparable results. Page 3 Carador Income Fund Plc (CIFU LN) December 2014 Footnotes 1. Past performance is not necessarily indicative of future results, and there can be no assurance that Carador will achieve comparable results, will meet its target returns, achieve its investment objectives or be able to implement its investment strategy. All returns are net of an accrued performance fee because the NAV and distributions to the end of the month for the U.S. $ Shares were in excess of their respective thresholds. 2. The 12 month Dividend Yield is based on last four quarterly dividends declared. Share price data is as at the end of the respective month. 3. YTD and Monthly performance are non-annualised. 1, 3 and 5 year performance figures are annualised using a geometric mean. Dividends are assumed to be reinvested in security at the NAV. Annualised volatility is measured since the launch of the US$ Shares in December 2008. 4. Source: Credit Suisse, Bloomberg as at the month end. The volatility of the indices reflected above and elsewhere in this report may be materially different from that of the performance of Carador. In particular, Carador does not have direct exposure to leveraged loans, but rather its exposure comes through its ownership of CLO securities. In addition, these indices employ different investment guidelines and criteria than Carador; as a result, Carador’s exposure to leveraged loans may differ significantly from the securities or other assets that comprise the indices. The performance of these indices has not been selected to represent an appropriate benchmark to compare to the performance of Carador, but rather is disclosed to allow for comparison of the performance of Carador to that of well known, relevant indices. A summary of the investment guidelines of these indices is available upon request. Annualised data for the indices use the geometric mean. 5. As calculated by Carador’s Administrator in accordance with the provisions of Carador’s Prospectus and Pricing Policy. Per share data based on final number of shares in the period. 6. Data based on general portfolio attributable to Carador. 7. Based on notional tranche weighted exposure to par portfolios of CLO investments as at the month end. Source: Intex, trustee reports and Bloomberg as at the month end. Excludes CLO’s that have been called or are yet to price. 8. S&P, LCD Quarterly Review, Q4 2014. Important Information Any reference herein to future returns or distributions is a target and not a forecast and there can be no guarantee or assurance that it will be achieved. The actual principal and income in any particular case will be determined by the cash flows received. This document has been issued by GSO / Blackstone Debt Funds Management LLC (the “Manager”), a wholly owned subsidiary of GSO Capital Partners LP, which is registered as an investment adviser with the U.S. Securities and Exchange Commission. It does not constitute an invitation and should not be taken as an inducement to engage in any investment activity and is for the purpose of providing information about the Manager and certain of the Manager’s affiliates, including without limitation, the Blackstone Group LP, GSO Capital Partners LP and GSO Capital Partners International LLP, collectively the “Manager’s Affiliates”. It may not be relied upon and should not be used for the purpose of making any investment decision. This document and the information contained herein is not for release, publication or distribution (directly or indirectly) in or into the United States, Canada, Australia or Japan or to any "U.S. person" as defined in Regulation S under the United States Securities Act of 1933, as amended (the "Securities Act") or into any other jurisdiction where applicable laws prohibit its release, distribution or publication. It does not constitute or contain an offer of, or the solicitation of an offer to buy or subscribe for, securities for sale anywhere in the world, including in or into the United States, Canada, Australia or Japan. This document is being furnished to you solely for your information and no recipient may forward, reproduce, distribute, or make available in whole or in part, this document (directly or indirectly) to any other person. The distribution of this document in certain jurisdictions may be restricted by law and recipients of this document should inform themselves about and observe any such restrictions and other applicable legal requirements in their jurisdictions. Accordingly, recipients represent that they are able to receive this document without contravention of any applicable legal or regulatory restrictions in the jurisdiction in which they reside or conduct business. By accepting this document, you agree to be bound by the foregoing limitations. This document has been prepared by Carador Income Fund Plc ("Carador") and is the sole responsibility of Carador. No liability whatsoever (whether in negligence or otherwise) arising directly or indirectly from the use of this document is accepted and no representation, warranty or undertaking, express or implied, is or will be made by Carador, the Manager or any of their respective directors, officers, employees, advisers, representatives or other agents ("Agents") for any information or any of the opinions contained herein or for any errors, omissions or misstatements. None of the Manager nor any of its respective Agents makes or has been authorised to make any representation or warranties (express or implied) in relation to Carador or as to the truth, accuracy or completeness of this document, or any other written or oral statement provided. In particular, no representation or warranty is given as to the achievement or reasonableness of, and no reliance should be placed on any projections, targets, estimates or forecasts contained in this document and nothing in this document is or should be relied on as a promise or representation as to the future. Although the portfolio reflected in this document (the “Portfolio”) is consistent with the investment strategy of Carador, there is no guarantee that, in the future, the portfolio acquired will remain identical to the make-up of the Portfolio. Moreover, future investments to be made by Carador may differ substantially from the investments included in the Portfolio. Therefore, the Portfolio parameters, industry concentration, rating concentration, spread distribution and other factors related to the Portfolio could all be materially different than those of the future portfolio acquired by Carador. Carador has not been and will not be registered under the U.S. Investment Company Act of 1940, as amended (the "Investment Company Act") and investors will not be entitled to the benefits of that Act. The securities described in this document have not been and will not be registered under the Securities Act, or the laws of any state of the United States. Consequently, such securities may not be offered, sold or otherwise transferred within the United States or to or for the account or benefit of U.S. persons (as such term is defined in Regulation S under the Securities Act) except pursuant to an exemption from, or in a transaction not subject to, the registration requirements of the Securities Act, applicable state laws and under circumstances which will not require Carador to register under the Investment Company Act. No public offering of the securities is being made in the United States. If you are in the United States and are not either (a) a "qualified institutional buyer" (as defined in Rule 144a under the Securities Act) who is also a "qualified purchaser" (as defined in Section 2(a)(51) of the Investment Company Act) for purposes of Section 3(c)(7) of the Investment Company Act; or (b) an "accredited investor" (as defined in Rule 501 of the Securities Act) who is either a qualified purchaser or an eligible Investment Company Act investor, you should not open this document and should destroy it. Certain information contained in this document constitutes “forward-looking statements,” which can be identified by the use of forward-looking terminology such as “may,” “will,” “should,” “expect,” “anticipate,” “target,” “intend,” “continue” or “believe,” or the negatives thereof, other variations thereon or comparable terminology. Due to various risks and uncertainties, actual events or results or the actual performance of Carador described herein may differ materially from the events, results or performance reflected or contemplated in such forward-looking statements. Any forecasts and estimates contained herein are based upon certain assumptions that Carador considers reasonable. Forecasts and estimates are necessarily speculative in nature, and it can be expected that some or all of the assumptions underlying the projections will not materialize and/or that actual events and consequences thereof will vary significantly from the assumptions upon which projections contained herein have been based. The inclusion of forecasts and estimates herein should not be regarded as a representation or guarantee regarding the reliability, accuracy or completeness of the information contained herein, Carador is under no obligation to update or keep current such information. Unless otherwise indicated, the information provided herein is based on matters as they exist as of the date of preparation and not as of any future date. Recipients of this document are encouraged to contact Carador’s representatives to discuss the procedures and methodologies used to make the projections and other information provided herein. Carador is an investment company with variable capital incorporated under the laws of Ireland and authorised by the Central Bank of Ireland as a professional investor fund. A copy of the Carador prospectus may be obtained from the website of the Company at www.carador.co.uk. For footnotes, please see final page. Your attention is drawn to the disclaimer on the final page of this document. Past performance is not necessarily indicative of future performance results and there can be no assurance that Carador will achieve comparable results. Page 4
© Copyright 2026 Paperzz