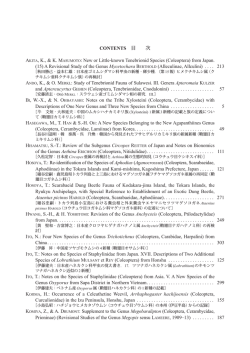
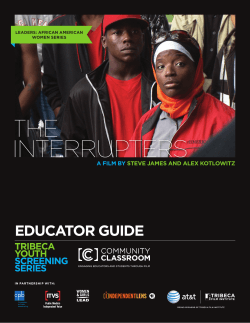
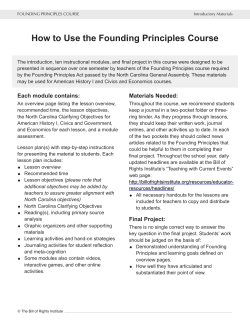
Virtual Lab Lizard Evolution Virtual Lab Student Handout LIZARD EVOLUTION VIRTUAL LAB Answer the following questions as you finish each module of the virtual lab or as a final assessment after completing the entire virtual lab. Module 1: Ecomorphs 1. At the beginning of the virtual lab, you were asked to sort eight lizards into categories. What criteria did you initially use to make your groups? Did you revise your criteria later? Why? 2. An adaptation is a structure or function that is common in a population because it enhances the ability to survive and reproduce in a particular environment. Provide one example and an explanation of one adaptation in the Anolis lizards. 3. Provide one evolutionary explanation for why lizards living in the same part of the habitat (i.e., grass) would have similar characteristics. 4. What is an ecomorph? Provide one example from the virtual lab. 5. How is an ecomorph different from a species? 6. Explain how a particular body feature of one of the lizard ecomorphs from the virtual lab is an adaptation to their particular niche. www.BioInteractive.org February 2015 Page 1 of 6 Virtual Lab Lizard Evolution Virtual Lab Student Handout Module 2: Phylogeny 1. In module 1, you identified which species of lizards were most similar to one another based on relative limb length and toe pad size. In this module, you determined which lizards are more similar to one another based on what type of information? 2. Are the species of lizard that are more similar to one another according to body type also more closely related based on the results obtained in this module? www.BioInteractive.org February 2015 Page 2 of 6 Virtual Lab Lizard Evolution Virtual Lab Student Handout 3. The figures below show two phylogenetic trees similar to the one you constructed in the virtual lab but with more lizards. The trees below show the evolutionary relationships among species from four ecomorphs from the four largest Caribbean islands. Figure 1. Phylogeny of anole lizards on four of the major Caribbean islands color-‐ coded according to geographical distribution. Light dotted line, Puerto Rico; small dashed line, Cuba; large dashed line, Hispaniola; and solid line, Jamaica. Figure 2. Phylogeny of anole lizards in the four major Caribbean islands colored in according to ecomorph. Light dotted line, twig; small dashed line, trunk-‐ground; large dashed line, trunk-‐crown; solid line, grass-‐bus. What conclusion can you draw about the evolution of the Anolis lizards based on these figures? www.BioInteractive.org February 2015 Page 3 of 6 Virtual Lab Lizard Evolution Virtual Lab Student Handout 4. What is convergent evolution? Use evidence from the trees to explain how the Anolis lizards are an example of this concept. Module 3: Experimental Data 1. In Dr. Losos’s experiment, why was it important that the experimental islands lacked lizards? 2. Dr. Losos’s data suggest that after only a few generations, the lizards on the experimental islands have shorter legs on average than the lizards on the larger island. Explain how the data you collected either support or do not support this claim. 3. Based on what you know about the experimental islands and the lizards that were placed on these islands, explain how and why the average leg length of the population might change over time. Include the concept of natural selection in your discussion. 4. If the population from one of the experimental islands was reintroduced on the original island, do you predict that lizards from the two populations would still mate and reproduce? Justify your answer with scientific arguments. www.BioInteractive.org February 2015 Page 4 of 6 Virtual Lab Lizard Evolution Virtual Lab Student Handout Module 4: Dewlap Colors 1. Anolis cristatellus and A. cooki are both trunk-‐ground anoles that live on Puerto Rico. A. cristatellus lives in a shady, forest environment, while A. cooki lives in an open, sunny environment. What is an adaptive explanation for why the dewlap of one species evolved to be brighter and that of another species darker? 2. From the bar graph generated in the virtual lab (see below), how do the dewlap colors of the two species compare? Use specific evidence from the graph to support your answer. Figure 3. Mean dewlap color for two species of anole lizards. Error bars represent standard error of the mean. 3. How would you determine whether the difference between the two populations is statistically significant? 4. If a species of anoles with dark dewlaps colonized a heavily forested island, predict what would happen over time to the color of the dewlap. Using your knowledge of natural selection and genetics, explain your prediction. www.BioInteractive.org February 2015 Page 5 of 6 Virtual Lab Lizard Evolution Virtual Lab Student Handout Extension Questions To minimize interspecific competition, organisms often divide the limited available resources in an area, a concept called “resource partitioning.” As an example of this concept, the figure below illustrates how different species of warblers utilize different portions of an individual tree. Figure 4. Different species of North American warblers live in different parts of the same trees. The shaded areas indicate the habitats each warbler species occupies. 1. Explain how the different species of anoles on an island demonstrate “resource partitioning” similar to the warblers in the figure. 2. Explain how resource partitioning can promote long-‐term coexistence of competing species, thus increasing biodiversity. www.BioInteractive.org February 2015 Page 6 of 6
© Copyright 2026 Paperzz