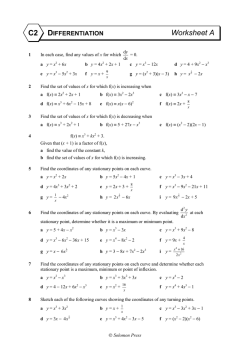
BASIC DIFFERENTIAL goodbye START BASIC DIFFERENTIAL - Pengertian teori LIMIT, bentuk turunannya merupakan dasar dari ‘diferensial - Diferensial, trunan, turunan pada interval, fungsi turunan Fungsi turunan memiliki bentuk axn find the gradient of the tangent to a curve y = f(x) the rate of change of f at a at x = a Find where the function f is strictly increasing, decreasing or stationary. sketch a curve with given equation determine the greatest/least values of a function on a given interval solve optimisation problems using calculus find the stationary point(s) (values) on a curve and determine their nature using differentiation Rule of thumb: Multiply by the power and reduce the power by 1. Examples 2 f (x) 3x x f ( x ) 5 3 x 2 f (x) 2 x 4 x 3x 4 x 3 2 1 0 2 1 0 1 f ( x ) 6 x 8 x 3 x 0 x dy dx 10 x 3 x dx dy y x x x x 1 1 2 5 1 x2 1 1 2 f (x) 4 x 5 x f ( x ) 2 x f ( x ) y x 2 5x 0 12 dy dx 2 x dy dx Test Yourself? 2 x5 y 2 3 10 x dx f ( x ) 6 x 8 x 3 x 5 dy f x 2 f (x) 4 y f x f (x) 2 x 4 x 3x 4 3 1 y 5x 3x 2 51 4 f ( x ) 15 x 3 y 5x 5 1 2 x 12 1 2 12 5 2 3 2 5 x x 2 x 3 A straight line has a gradient m AB yB yB xB xA The chord PQ has a gradient m PQ yQ y P xQ x P f (x h) f (x) f (x h) f (x) xhx h As h tends to zero, Q tends towards P and the chord PQ becomes the tangent at P. f x h f x h The gradient of the tangent at P = f x lim h 0 Example To find the gradient of the tangent to the curve y = f(x) at x = a we need to evaluate f ´(a). Find the gradient of the tangent to the curve y = 3x2 + 2x – 1 at the point P(1, 4) x 4 dy 6x 2 dx dy dx 6.4 2 26 x 4 Thus gradient at P is 26. Test Yourself? The Waverley can reach its top speed in 5 minutes. During that time its distance from the start can be calculated using the formula D = t + 50t2 where t is the time in minutes and D is measured in metres. What is the Waverley’s top speed? Speed, v m/min, is the rate of change of distance with time. D t 50 t v dD 2 1 100 t dt v = 1 + 100 5 = 501 m/sec How fast is it accelerating? v 1 100 t a dv dt 100 Acceleration, a m/min/min, is the rate of change of speed with time. Test Yourself? y The signs indicate where the gradient of the curve is: + 0 + positive … the function is increasing – – + negative … the function is decreasing + O zero … the function is stationary – 0 – – x A function is strictly increasing in a region where f´(x) > 0 A function is strictly increasing in a region where f´(x) < 0 A function is stationary where f´(x) = 0 Example f(x) = 2x3 – 3x2 – 12x + 1. Identify where it is (i) increasing (ii) decreasing (iii) stationery graph of derivative f x 6 x 6 x 12 15 2 10 A sketch of the derivative shows us that 5 f´(x) < 0 for 0 < x < 2 … f(x) decreasing f´(x) > 0 for x < 0 or x > 2 … f(x) increasing f´(x) = 0 for x = 0 or x = 2 … f(x) stationary 0 -2 -1 0 -5 -10 -15 1 2 3 Test Yourself? To sketch a curve, collect the following information: • where will it cut the y-axis? [x = 0] • where will it cut the x-axis? [f(x) = 0] • • where is it stationary? [f ´(x) = 0] where is f(x) increasing/decreasing [f ´(x) > 0/ f ´(x) < 0] especially in the neighbourhood of the stationary points. • how does f(x) behave as x ± Test Yourself? When a function is defined on a closed interval, a ≤ x ≤ b, then it must have a maximum and a minimum value in that interval. These values can be found either at • a stationary point [where f´(x) = 0] • an end-point of the closed interval. [f(a) and f(b)] All you need do is find these values and pick out the greatest and least values. Example A manufacturer is making a can to hold 250 ml of juice. The cost of the can is dependent on its radius, x cm. For practical reasons the radius must be between 2·5 cm and 4·5 cm. The cost can be calculated from the formula C = x3 –5x2 + 3x + 15, 2·5 ≤ x ≤ 4·5. Calculate the maximum and minimum values of the cost function. dC 3 x 10 x 3 2 dx … which equals zero at stationary points. 3x2 – 10x + 3 = 0 (3x– 1)(x – 3) = 0 x = 1/3 or x = 3 Working to 1 d.p. f(1/3) = 15·5 f(3) = 6 f(2·5) = 6·9 f(4·5) = 18·4 By inspection fmax = 18·4 (when x = 4·5) and fmin = 6 (when x = 3). Test Yourself? solving optimisation problems using calculus Example A box has a square base of side x cm and a height of h cm. It has a volume of 1 litre (1000 cm3) For what value of x will the surface area of the box be minimised? [… and hence the cost of production be optimised] h x x To use calculus we must express the surface area in terms of x alone … so we must find h in terms of x . For a cuboid, volume = lbh … so in this case 1000 = x2h. And so, h 1000 x 2 1000 x 2 The box is made from 6 rectangles, two of area x2 cm2 and four of area xh cm2 Total Surface Area, S = 2x2 + 4xh If x < 10, 4x < 40 and 4000x–2 > 40 So dS/dx < 0 … a decreasing function S = 2x2 + 4000x–1 dS 4 x 4000 x 2 dx If x > 10, 4x > 40 and 4000x–2 < 40 So dS/dx > 0 … an increasing function = 0 at stationary points 4x = 4000x–2 x3 = 1000 x = 10 x 10- 10 10+ ds/dx – 0 + Decreasing before x = 10 and increasing after it Gives us a minimum turning point. If x = 10 then h = 10. A cube of side 10 cm has a volume of 1000 cm3 and the smallest possible surface area. Test Yourself? Example Find the stationary points of the function f(x) = x5 + 5x4 – 35x3 + 1 and determine their nature. Differentiate: f´(x) = 5x4 + 20x3 – 105x2 Equate to zero: 5x4 + 20x3 – 105x2 = 0 at stationary points (factorise) 5x2(x2 + 4x – 21) = 0 5x2(x – 3)(x + 7) = 0 x = 0 (twice), x = 3 or x = –7 Make a table of signs: x 5x 2 -7 0 3 + + + 0 + + + x-3 – – – – – 0 + x+7 – 0 + + + + + dy/dx + 0 – 0 – 0 + profile / – \ – \ – / Nature max PI min … scan the critical x’s … examine each factor of dy/dx … conclusions based on sign of derivative Stationary points occur at x = –7 ( a maximum turning point); x = 0 (a horizontal point of inflexion); x = 3( a minimum turning point. The corresponding stationary values are f(–7) = 7204 f(0) = 1 f(3) = –296 The stationary points are: (–7, 7204) a max TP; (0, 1) a horizontal PI; (3, –296) a min TP Test Yourself? Differentiate (a) 3x5 + 4x3 – x – 3 (b) 3x2 + 2x (c) 4 3 x (d) 2x x x 2 reveal Differentiate (a) 3x5 + 4x3 – x – 3 (b) 3x2 + 2x (c) 4 (a) 15x4 + 12x2 –1 3 x (d) 2x x (b) 2 x 2 1 3x 2 x 3x 2 x 2 2 dy 6x x 12 6x 1 dx You must make each term take the shape axn x (c) 4 3 4 3x 1 x dy 3 x 2 dx (d) x 2 1 2x x 2 x dy dx 3 2x x 2 x 2 2 x2 x 2 3 2 x 2x 5 2 1 x 32 Gradient at a Point 3 2 1 0 0 1 2 3 -1 reveal Using convenient units and axes, the profile of a hill has been modelled by H = 0·1(x3 – 5x2 + 6x) where H is the height and x is the distance from the origin. What is the gradient of the curve when x = 2? Gradient at a Point 3 2 1 H = 0·1x3 – 0·5x2 + 0·6x 0 0 1 2 3 -1 dH 0 3x x 0 6 2 dx dH dx 032 2 06 2 x 2 1 2 2 0 6 0 2 Using convenient units and axes, the profile of a hill has been modelled by H = 0·1(x3 – 5x2 + 6x) where H is the height and x is the distance from the origin. What is the gradient of the curve when x = 2? Rates of change reveal The radius, r cm, of a particular circular ripple is related to the time, t, in seconds since the photo was taken. r = 4t + 3 How fast is the area of the circle growing when the radius is 10 cm? Rates of change Since r = 4t + 3 then r = 11 t = 2. and the area of the circular ripple, A cm2, is π(4t + 3)2 A = π(4t + 3)2 A = 16πt2 + 24πt + 9π dA 32 t 24 dt dA dt 32 2 24 88 t 2 The radius, r cm, of a particular circular ripple is related to the time, t, in seconds since the photo was taken. r = 4t + 3 How fast is the area of the circle growing when the radius is 11 cm? When the radius is 11 cm, the area is increasing at the rate of 276·5 cm2 per second correct to 1 d.p. Increasing/decreasing functions reveal During one study of red squirrels the number in one area was modelled by the function N(x) = x3 – 15x2 + 63x – 10, 1 < x < 12 Where x is the number of years since the study started. During what years was this a decreasing function? Increasing/decreasing functions N(x) = x3 – 15x2 + 63x – 10, 1 < x < 12 N´(x) = 3x2 – 30x + 63 N´(x) = 0 at stationary points 3x2 – 30x + 63 = 0 x = 3 or 7 N´(x) During one study of red squirrels the number in one area was modelled by the function N(x) = x3 – 15x2 + 63x – 10, 1 < x < 12 Where x is the number of years since the study started. During what years was this a decreasing function? 3 7 x The sketch shows that N´(x) < 0 for 3 < x < 7. The population was on the decrease between the 3rd and 7th years of the survey. Curve sketching Sketch the curve with equation y = x3 – 5x2 – 8x + 12 Identifying (i) where will it cut the y-axis? (ii) where will it cut the x-axis? (iii) where is it stationary? (iv) where it is increasing/decreasing especially in the neighbourhood of the stationary points. (v) how it behave as x ± reveal Curve sketching Sketch the curve with equation y= x3 – 5x2 – 8x + 12 Identifying (i) where will it cut the y-axis? (ii) where will it cut the x-axis? (iii) where is it stationary? (iv) where it is increasing/decreasing especially in the neighbourhood of the stationary points. (v) how it behave as x ± x = 0 y = 12 … (0, 12) y = 0 x3 – 5x2 – 8x + 12 = 0 (i) (ii) (x – 1)(x + 2)(x – 6) = 0 x = 1 or x = –2 or x = 6 … (1, 0), (–2,0),(6, 0) dy/ = 3x2 – 10x – 8 dx = 0 at S.P.s 3x2 – 10x – 8 = 0 (3x + 2)(x – 4) = 0 x = –2/3 or x = 4 … a max TP at (–2/3 , 400/27 ) y = 400/27 or y = –36 … a min at (4 , –36 ) (iii) (iv) - /3 2 4 3x + 2 – 0 + + + x–4 – – – 0 + dy/dx + 0 – 0 + inc/dec / - \ - / x nature max min (v) When x is large and positive, y is large and positive (1st quad) When x is large and negative, y is large and negative (3rd quad) y=x 3 - 5x 2 - 8x + 2 3 30 20 10 0 -3 -2 -1 0 -10 -20 -30 -40 1 4 5 6 7 A shop takes x deliveries a year of cereal. The suppliers are willing to make between 20 and 200 deliveries a year. The annual cost of these deliveries can be calculated from the formula: C x 4 x 10 000 x 1000 ; 20 ≤ x ≤ 200 Calculate the number of deliveries that will minimise the costs. reveal Find stationary point(s) C x 4 x 10 000 1000 x C x 4 10 000 x 2 At stationary points C´(x) = 0 4 10 000 x A shop takes x deliveries a year of cereal. x 2 The suppliers are willing to make between 20 and 200 deliveries a year. The annual cost of these deliveries can be calculated from the formula: C x 4 x 10 000 x 1000 ; 20 ≤ x ≤ 200 What is the manager’s best strategy to minimise the costs. 2 0 10 000 2500 4 x 50 Examine end-points and stationary point(s) C 20 4 20 10 000 C 200 4 200 C 50 4 50 580 20 10 000 850 200 10 000 400 50 Optimum strategy: Order 50 times a year. This will minimise costs at £400. Optimisation 30 cm 20 cm x 20 – 2x x 30 – 2x An A4 sheet of paper, roughly 20 by 30 cm has its edges folded up to create a tray. Each crease is x cm from the edge. What size should x be in order to maximise the volume of the tray? reveal Optimisation 30 cm Express volume in terms of x: V = x(20 –2x)(30 –2x) 20 cm = 4x3 – 100x2 + 600x x Differentiate dV 12 x 200 x 600 2 dx 20 – 2x = 0 at S.P.s x 30 – 2x 12 x 200 x 600 0 2 x 200 40000 4.12 .600 24 x 12 7 or 3 9 (to 1 d.p.) An A4 sheet of paper, roughly 20 by 30 cm has its edges folded up to create a tray. Each crease is x cm from the edge. What size should x be in order to maximise the volume of the tray? Check nature x 3·9 12·7 dV/dx – 0 + 0 – inc/dec \ Nature / mim \ max Conclusion When x = 3·9, the volume is at a maximum of 1056 cm3. Stationary points and nature A function is defined by f (x) x 5 5 x 4 4 x 3 3 x 2 2 (a) Show that its derivative has factors x, (x + 1) and (x – 1) (b) Find the stationary points of the function and determine their nature. reveal Stationary points and nature differentiate 4 3 2 f x x x x x A function is defined by x ( x x x 1) 3 2 x[ x ( x 1) ( x 1)] 2 f (x) x 5 5 x 4 4 x 3 3 x x ( x 1)( x 1) 2 2 2 x ( x 1)( x 1)( x 1) Equate to zero At S.Ps f´(x) = 0 i.e. x = 0 or x = –1 or x = 1 Make nature table x -1 0 1 + 0 + + + + + – – – 0 + + + (x-1) – – – – – 0 + f'(x) + 0 + 0 – 0 + inc/dec / - / - \ - / (x+1) (a) (b) Show that its derivative has factors x, (x + 1) and (x – 1) Find the stationary points of the function and determine their nature. x 2 nature PI max min Find corresponding y-values. f 1 15 1 4 1 3 f 1 1 3 1 2 1 5 1 4 1 2 7 60 23 60 f 0 0 Summarise findings (–1,–7/60) point of inflexion (1,–23/60) minimum turning point (0, 0) minimum turning point
© Copyright 2026 Paperzz