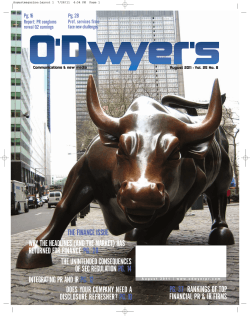
COOPERATION AMONG METU TECHNOPOLIS FIRMS WITH REGARD TO THEIR SECTORAL DISTRIBUTION A THESIS SUBMITTED TO THE GRADUATE SCHOOL OF SOCIAL SCIENCES OF MIDDLE EAST TECHNICAL UNIVERSITY BY EMRE DEMİREZEN IN PARTIAL FULFILLMENT OF THE REQUIREMENTS FOR THE DEGREE OF MASTER OF SCIENCE IN SCIENCE AND TECHNOLOGY POLICY STUDIES FEBRUARY 2014 Approval of the Graduate School of Social Sciences Prof. Dr. Meliha Altunışık Director I certify that this thesis satisfies all the requirements as a thesis for the degree of Master of Science. Prof. Dr. Erkan Erdil Head of Department This is to certify that we have read this thesis and that in our opinion it is fully adequate, in scope and quality, as a thesis for the degree of Master of Science. Assist. Prof. Dr. Seven Ağır Supervisor Examining Committee Members Prof. Dr. Erkan Erdil (METU, STPS) Assist. Prof. Dr. Seven Ağır (METU, ECON) Prof. Dr. Onur Yıldırım (METU, ECON) I hereby declare that all information in this document has been obtained and presented in accordance with academic rules and ethical conduct. I also declare that, as required by these rules and conduct, I have fully cited and referenced all material and results that are not original to this work. Name, Last name : EMRE DEMİREZEN Signature iii : ABSTRACT COOPERATION AMONG METU TECHNOPOLIS FIRMS WITH REGARD TO THEIR SECTORAL DISTRIBUTION Demirezen, Emre M.S., Science and Technology Policy Studies Supervisor: Assist. Prof. Dr. Seven Ağır February 2014, 107 pages The main aim of this thesis is to evaluate the firms of METUTECH Technopolis in terms of cooperation among themselves with regard to their sectoral distribution from their own perspective. Accordingly, the thesis implicates some significant constituents of METUTECH in shaping the willingness and ability of its firms to cooperate. The sample placed in the center of the study is “METU Technopolis (METUTECH)”, which is regarded as the pioneer and one of the first “Science and Technology Parks (STPs)” in Turkey, and its firms. With regard to their sectoral place within METUTECH, the general perspective of the firms are related to four constituents of an STP, which also play a major role in its sustainability and development: “R&D and Innovation, Support, Sectoral Diversification ve METUTECH Infrastructure”. I will investigate how each of these factors relate to firms’ willingness to cooperate from their own perspective. The thesis is shaped by deep and detailed iv “semi-structured interviews” with the a large sample of firms in METUTECH and in this sense is the first study explores such questions in the Turkish context. The main finding of the study is that there are no meaningful associatons between “four constituents” and “inter-firm cooperation”. To both METUTECH and its firms have a sustainable and efficient functionality, the requirement ensues from the main finding is that: Both METUTECH Management and the firms should approach four constituents and inter-firm cooperation as a whole and consider it in determining their vision and mission. Keywords: Cooperation, Sectoral Analysis, METU Technopolis, Science and Technology Parks, Firm-level v ÖZ ODTÜ TEKNOKENT FİRMALARI ARASINDA SEKTÖREL DAĞILIM VE İŞBİRLİĞİ Demirezen, Emre Yüksek Lisans, Bilim ve Teknoloji Politikası Çalışmaları Tez Yöneticisi: Assist. Prof. Dr. Seven Ağır Şubat 2014, 107 pages Bu tezin ana hedefi, ODTÜ Teknokent firmaları arasında, bu firmaların teknokentteki genel sektörel dağılımı yönünden işbirliğini, yine bu firmaların kendi perspektifinden değerlendirmektir. Bu doğrultuda tez, bu firmaların işbirliği yapma eğilimini ve kabiliyetini şekillendiren, ODTÜ Teknokent’in bazı önemli yapıtaşlarını çalışmaya dahil etmektedir. Çalışmanın merkezine koyulan örnek, Türkiye’nin ilk BTP’lerinden biri olan ve bu konuda öncü niteliğindeki “ODTÜ Teknokent” ve firmalarıdır. ODTÜ Teknokent bünyesindeki sektörel konumu doğrultusunda firmaların genel perspektifi, aynı zamanda bir BTP’nin sürdürülebilirliği ve gelişiminde büyük bir rol oynayan dört yapıtaşı ile ilişkilendirilmiştir: “AR&GE ve İnovasyon, Destek, Sektörel Zenginleşme ve ODTÜ Teknokent Altyapısı”. Ben, firmaların kendi perspektifinden bu faktörlerin her birinin, firmaların işbirliği yapma eğilimi ile nasıl ilişkili olduğunu inceleyeceğim. Bu tez, ODTÜ Teknokent’teki firmaların büyük bir kısmı ile yapılan derin ve detaylı “yarı-yapılandırılmış vi görüşmeler” ile şekillenmiştir ve bu yönden, Türkiye bağlamında bu soruları irdeleyen ilk çalışmadır. Çalışmanın temel sonucu ise, ODTÜ Teknokent’teki firmalar perspektifinden, dört yapıtaşı ile firmalar arası işbirliği için anlamlı ilişkilendirmelerin olmadığıdır. Buna bağlı olarak, hem ODTÜ Teknokent genelinin hem de firmalarının verimli ve sürdürülebilir bir işleyişe sahip olabilmeleri için şu gereklilik ortaya çıkmaktadır: Hem ODTÜ Teknokent yönetimi hem de firmalar, dört yapıtaşı ile firmalar arası işbirliği konusunu bir bütün olarak ele almalı ve bunu gelecek “vizyon ve misyon”larını belirlerken göz önünde bulundurmalıdır. Anahtar kelimeler: İşbirliği, Sektörel Analiz, ODTÜ Teknokent, Bilim ve Teknoloji Parkları, Firma Düzeyi vii To My Family viii ACKNOWLEDGMENTS I would like to express my gratitude to my supervisor, Assist. Prof. Dr. Seven AĞIR for her kind and valuable guidance, advise, constructive criticism, and encouragement throughout the study. I am grateful to Prof. Dr. Erkan ERDİL and Prof. Dr. Onur YILDIRIM, for their friendly, constructive guidance and support through my studies. I would like to thank to Prof. Dr. Canan ÇİLİNGİR, Prof. Dr. Volkan ATALAY and Assist. Prof. Dr. Semih AKÇOMAK for their advice and beneficial remarks. My special thanks goes to Meryem MUDARA GÖKYAR. Her invaluable help and understanding played an important role throughout this thesis. I would like to express my sincere gratitude to METU Technopolis management and the general manager, Mustafa İhsan Kızıltaş, for their all support, permissions, technical assistance and valuable knowledge about my study and its semi-structured interviews with METUTECH firms. Last but not least, The idea and most of the application part of this thesis had been completed with 43 METUTECH firms. Therefore, I am grateful to those firms and their administrative executives for their willingness to answer questions and give a great deal of information about my semi-structured interviews: ix 3K BİLİŞİM ARÇELİK ARF B İLGİ TEKNOLOJİLERİ ASYA TRAFİK SİNYALİZASYON BAMA TEKNOLOJİ BİLGİ GIS BİLİŞİM AKTÖRLERİ BTT BİLGİ TEKNOLOJİ TASARIM CYBERSOFT DESİSTEK ES PROJE ESEN SİSTEM ENTEGRASYON FIBERLAST FOODLIFE GENFORMATİK HG MEKANİK INFOTRON İNOVA KARDİOSİS KARTEK KOÇSİSTEM LİKYA MANUS MERCADOS MEZZO STÜDYO MİKROSİM MİL OYUN MOBİLUS OYAK TEKNOLOJİ x PORTAKAL PROJE ENERJİ REFGEN REO-TEK RTB SIEMENS SİMSOFT SOBEE S.P.A.C. TERRALAB TUSAŞ (TAI) UDEA ZİBUMİ xi TABLE OF CONTENTS PLAGIARISM .......................................................................................................ǯ.... ABSTRACT………………………………………………………………………………………………………͘͘͘͘͘͘͘……ŝǀ ÖZ…………………………………………………………………………………………………………………………..͘͘͘͘͘͘͘͘ǀŝ DEDICATION ....................................................................................................ǯ.... ACKNOWLEDGMENTS ........................................................................................ ix TABLE OF CONTENTS..........................................................................................xii LIST OF TABLES ....................................................................................................xiv LIST OF FIGURES……………………………………………………ǯǯǯ………...xvi LIST OF ABBREVIATIONS ǯǯǯǯǯǯǯǯǯǯǯǯǯǯǯǯǯǯǯǯǯǯǯǯǯǯǯǯǯǯǯǯǯǯǯǯǯǯǯǯǯǯǯǯǯǯǯǯǯǯǯǯǯǯǯǯǯǯǯǯǯǯǯǯǯǯǯǯǯǯǯǯǯǯǯǯǯǯǯǯ¡ CHAPTER 1. INTRODUCTION............................................................................................... ŗ 2. THE CONCEPT OF “SCIENCE AND TECHNOLOGY PARK (STP)” ...... Ŝ 2.1 The Definition of “Science and Technology Park (STP)” ...................... Ŝ 2.2 Emergence of STPs in the World .............................................................. Ş 2.3 Emergence of STPs in Turkey and Their Development ...................... 1Ś 2.4 Role of Cooperation within STPs ........................................................... 2Ŗ 3. METHODOLOGY AND DATA COLLECTION ......................................... 2ś 3.1 The Focus of Research Study: METU Technopolis .............................. 2Ŝ 3.2 General Profile of METUTECH .............................................................. 3ŗ 3.3 Data Selection and Sampling Methodology ......................................... 4ŗ 3.4 Methodology and Tools ........................................................................... 4Ś xii 3.5 Analysis Techniques and Statistical Tools ............................................ 4Ŝ 4. ANALYSIS AND RESULTS ............................................................................ 4Ş 4.1 General Profiles of the Firms Interviewed ............................................ 4Ş 4.2 Analysis of Qualitative Data taken from Firm Evaluation Forms..... 5Ş 4.2.1 Node Families and Firm Answers: ................................................. 5Ş 4.2.2 Degree of Association between Node Families ............................ 6Ŗ 5. CONCLUSION ................................................................................................. 6Ś 5.1 Summary .................................................................................................... 6Ś 5.2 Discussions ................................................................................................ 6Ş 5.3 Policy Implications ................................................................................... 7Ŗ REFERENCES .......................................................................................................... 7Ś APPENDICES A. FIRM EVALUATION FORM ......................................................................... 81 Part 1: Based on Quantitative Information .................................................... 81 Part 2: Based on Qualitative Information ...................................................... 82 B. DEGREE OF ASSOCIATION ......................................................................... 82 Part 1: Direct and Inverse Relationships between Node Families ............. 82 Part 2: Contingency Tables & Chi-square Tests and Rules ......................... 83 C. TURKISH SUMMARY .................................................................................... 93 D. TEZ FOTOKOPİSİ İZİN FORMU ............................................................... 107 xiii LIST OF TABLES TABLES Table 1. Relationship with Universities ............................................................... 12 Table 2. Firm Number in Sectors (Source: METUTECH Management – March 2013)........................................................................................................................... 36 Table 3. Numerical Distribution of Firms in Sectors by METU Technopolis Buildings (Main Campus) ...................................................................................... 38 Table 4. Sectoral Clusters ....................................................................................... 43 Table 5. Node Families ........................................................................................... 59 Table 6. Degree of Association between Node Families .................................... 63 Table 7. Cooperation Factors for SMEs ................................................................ 71 Table 8. Numbers of Direct and Inverse Relationships between Node Families ..................................................................................................................... 82 Table 9. “R&D and Innovation vs. Coop.” Results for Soft. & ICT Cluster .. 83 Table 10. “Support vs. Coop.” Results for Soft. & ICT Cluster ................. 83 Table 11. “Sectoral Diversification vs. Coop.” Results for Soft. & ICT Cluster .................................................................................................................................... 84 Table 12. “METUTECH Inf. vs. Coop.” Results for Soft. & ICT Cluster ......... 84 Table 13. “R&D and Innovation vs. Coop.” Results for Electronics Cluster .. 85 Table 14. “Support vs. Coop.” Results for Electronics Cluster ......................... 85 Table 15. “Sectoral Diversification vs. Coop.” Results for Electronics Cluster .................................................................................................................................... 86 Table 16. “METUTECH Inf. vs. Cooperation” Results for Electronics Cluster .................................................................................................................................... 86 Table 17. “R&D and Innovation vs. Coop.” Results for Design Cluster ......... 87 Table 18. “Support vs. Coop.” Results for Design Cluster ................................ 87 xiv Table 19. “Sectoral Diversification vs. Coop.” Results for Design Cluster ..... 88 Table 20. “METUTECH Inf. vs. Coop.” Results for Design Cluster ................ 88 Table 21. “R&D and Innovation vs. Coop.” Results for Other Cluster ........... 89 Table 22. “Support vs. Coop.” Results for Other Cluster .................................. 89 Table 23. “Sectoral Diversification vs. Coop.” Results for Other Cluster ....... 90 Table 24. “METUTECH Inf. vs. Cooperation” Results for Other Cluster ....... 90 xv LIST OF FIGURES FIGURES Figure 1. Cooperation and Four Constituents .......................................................3 Figure 2. Relationship with Universities .............................................................. 11 Figure 3. Age and Location Percentages of STPs by Survey Responses ......... 13 Figure 4. Sectors in STPs ......................................................................................... 14 Figure 5. Total Firm Number in Technology Development Regions by Years .................................................................................................................................... 27 Figure 6. Sectoral Distribution of the Whole Technology Development Regions ...................................................................................................................... 28 Figure 7. Firm Cooperation Percentages by TDRs ............................................. 31 Figure 8. METU Technopolis Settlement Plan and Buildings (Main Campus) .................................................................................................................................... 33 Figure 9. Firm Percentage in Sectors (Sectoral Distribution) ............................ 36 Figure 10. Distribution of Firms in Sectors by METU Technopolis Buildings (Main Campus) ........................................................................................................ 39 Figure 11. Distribution of Firms in Sectors by METU Technopolis Sub-Zones .................................................................................................................................... 40 Figure 12. Percentages of the Firms Interviewed related to Their Sec. Dist. .. 49 Figure 13. Percentages of SMEs vs Large-scaled Firms in Each Cluster (Interviewed) ............................................................................................................ 51 Figure 14. Ranges of Annual Income Values for Each Cluster (2013) ............. 53 Figure 15. Ranges of Project/Product Number for Each Cluster ...................... 54 Figure 16. Ranges of IPR (Patent + Utility Model) number for Each Cluster . 56 Figure 17. Ranges of Trademark Number for Each Cluster .............................. 57 xvi LIST OF ABBREVIATIONS ATOM Animation Technologies and Game Development Centre HEI Higher Education Institution HP Hewlett-Packard IASP International Association of Science Parks and Areas of Innovation ICT Information and Communications Technologies IPR Intellectual Property Rights MEMS Micro-Electro-Mechanical Systems METU Middle East Technical University METUTECH METU Technopolis OSTİM Middle East Industry and Trade Center R&D Research and Development SANTEZ Industrial Thesis Supporting Program SME Small and Medium Enterprises SMEDO/KOBİ Small and Medium Enterprises Development Organization STP Science and Technology Park SV Silicon Valley TDR Technology Developmetn Region TTGV Technology Development Foundation of Turkey TÜBİTAK The Scientific and Technological Research Council of Turkey UNESCO United Nations Educational, Scientific and Cultural Organization WWII World War II xvii CHAPTER 1 INTRODUCTION “Science and Technology” studies have been developed and shaped within the context of wider-economic and political trends during the last two centuries. With the rapid advance of the research and application of new technologies and techniques in centers of capitalist development since the Industrial Revolution, research and innovation have become a locus of competition and competence. Accordingly, in both developed and developing countries, “Science and Technology Policy” referring to the public sector measures for promoting and mobilizing scientific and technological resources has become a significant component of development strategy. No doubt the spectrum of possible domains of such intervention is wide. The management and support of extended techno-economic networks is one of the many elements within this spectrum where “Science and Technology Parks (STPs)” stand out as the most popular instruments for enabling such networks. This study takes as its subject Science and Technology Parks in Turkey with a particular focus on how effective they are to further cooperation through a case study based on use of both quantitative and qualitative methods. STPs are physical and social organizations, where the social actors such as the universities and academicians, state/public and private institutions, firms from various sectors and disciplines, investors and financiers gathered together for scientific and technological knowledge production, valuation, 1 industrialization and commercialization activities. They have significant impact on income creation, employment, growth, and innovative capacities in their territories.The STP in the focus of this study is “METU Technopolis (METUTECH)”, which is situated within the borders of the capital city, Ankara. METUTECH, in the 20-year period since it was first established, is the Turkey’s largest and most active STP, in other words “technology development region (TDR)” according to the common definition in Turkey. The pioneer position which METUTECH has protected for years becomes more striking when it is considered that the Turkish laws regulating science and technology regions were put into practice all around the country long after METUTECH was established. Furthermore, these laws also helped the establishment of the country’s other technology development regions and R&D development centers. The fact that METUTECH stands out as a leading positing among STPs in Turkey makes it appropriate to a case study for research on the peculiar shortcomings and strengths of technology parks (especially with respect to cooperation) in Turkey. In this thesis, we aim to understand the general perception and perspective of cooperation among METUTECH firms with regard to their sectoral distribution. An analysis of firms’ expectations and evaluation of the level of cooperation in METUTECH will pave the ground for further studies examining their effect on the performance of METUTECH firms, as well as their implications for economic growth and competitiveness at both regional (Ankara) and country (Turkey) level. This study analyzes the consequences of today’s sectoral distribution of METUTECH firms, as well as cooperation among them according to the four important constituents of an STP’s structure as seen in Figure 1. 2 R&D and Innovation Support Cooperation Sectors STP's Inf. Figure 1. Cooperation and Four Constituents These four constituents demonstrate the potential links between the process of firm development and strengthening the cooperation between the firms which constitutes the life-veins of STPs including the METUTECH. These constituents are the four that I wanted to emphasize among the internal and external factors which is important for the development of cooperation among firms in an STP, which already have the advantage of geographical proximity: Under the heading “Sectors”, I am emphasizing the general distribution of the firms within each sectors in STPs. In defining this distribution, the trends of an STP’s firms, along with their aim to gain advantage of prestige, and trade by adopting themselves to the sectoral trends in the world, country or region. 3 “R&D and innovation”, is one of the must activities of firms and academic branches connected within an STP; in terms of finding innovative ideas, applying new inventions and projects to real life and to industrial applications and transmitting it to commercialization process. “Support” (especially from governmental institutions, investors and STP managements/organization), plays an important role in providing the technical support and financial/non-financial resources that is required for research-related activities of the firm in STP, and the university. “STP Infrastructure” refers to the non-financial support provided to the firms within the STP especially by the STP management (i.e., organizational support, publicity, mentorship, consultancy, information service, technology fairs, collaboration and cooperation platforms etc.), and physical and social conditions of the STP. The infrastructure has great importance in providing the coordination between the general management of STPs and actors effectively and sufficiently. In my thesis study, I aim to explain how these four constituents are related to the willingness and ability of METUTECH’s firms for their development of cooperation with a view to the sectors in which they are categorized. More specifically, the thesis will clarify how much the firms in METUTECH in the specific sectors perceive these four constituents as important / sufficient / effective / beneficial qualities in an STP and how these constituents might be effective in enabling cooperation among them. 4 To answer this question, I grouped the firms in terms of sectors that they are in. The focus on sectors is based on the presumption that the sectors in which firms operate might affect their being open/close to cooperation as well as their predominance (having more firms in the same sector) in METUTECH and their impact on the firms’ preferences regarding cooperation. I believe that METUTECH firms’ being open to cooperation with other firms in METUTECH is related to the importance/dominance of the sectors that they belong to. In addition to that, as a part of my study, I aim to explore the firms’ preferences regarding whether METUTECH should follow a “sectoral diversification” policy. Thus, I raise the question as to whether METUTECH firms prefer a policy supporting sectoral concentration or a policy supporting sectoral diversification in order to develop the cooperation between the sectors they are active in. 5 CHAPTER 2 THE CONCEPT OF “SCIENCE AND TECHNOLOGY PARK (STP)” 2.1 The Definition of “Science and Technology Park (STP)” In terms of design and establishment of Science and Technology Parks, which are being shaped by the effect of many internal and external factors ranging from their reason of establishment, to the duties they serve; from working conditions to the characteristics of the region they are being designed and established in, and the types of the institutions and organizations they take support from; I can talk about various formations, the names of which are similar to Science and Technology Park. Recognizing this diversity is important in terms of making an appropriate definition of STPs. International Association of Science Parks (IASP) as being an international agency which is one of the most strongly established network of today that connects current STPs (with their firms, entrepreneurs, managerial structure and other services) to other actors of this network such as universities, professional science managers, government agents, policy-makers and more. IASP interprets contextual structure of STPs as follows: A Science Park is an organization managed by specialized professionals, whose main aim is to increase the wealth of its community by promoting the culture of innovation and the competitiveness of its associated businesses and knowledge-based institutions. To enable these goals to be 6 met, a Science Park stimulates and manages the flow of knowledge and technology amongst universities, R&D institutions, companies and markets; facilitates the creation and growth of innovation-based companies through incubation and spin-off processes; provides other value-added services together with high quality space and facilities. By evolving out of this interpretation, it is highlighted that STP regions have particular features and advantages. Especially, a very large structure is based upon a network of various social actors’ under the same roof. The diversified advantages of STPs extend over a wide spectrum involving knowledge and technology flow among this network members/social actors; qualified R&D efforts and innovative projects/products for industrial and economical returns; collaborative business development between universities and firms (from Small and Medium Enterprises (SMEs) to large companies, incentive atmosphere for entrepreneurship and IPR success, and so on. In addition, STPs’ internal structure broadens in parallel to a cooperative operation system among their network members. United Nations Educational, Scientific and Cultural Organization (UNESCO) describes STP concept from a different viewpoint: The term "science and technology park" encompasses any kind of hightech cluster such as: Technopolis, science park, science city, cyber park, hi tech (industrial) park, innovation centre, R&D park, university research park, research and technology park, science and technology park, science city, science town, technology park, technology incubator, technology park, technopark, technopole and technology business incubator. However, it is worth noting that there are slight differences 7 between some of these terms. For example, experience suggests that there is difference between a technology business incubator, science park or research park, science city, technopolis and regional innovation system. The description above remarks the different subtypes of these parks. The countries evaluate contribution of these parks for their national development plans and arrange their organizational structure in this direction since these places go into operation. As a result of this; even though these parks’ general visions and missions aim at parallel purposes, minor but distinctive differences can be seen between them when some of their characteristics are considered. So, it is also possible that STPs are being referred with different names in terms of their visions and missions and the policies that the countries defined both functionally and organizationally such as: In the USA, “Research Park”; in England, “Science Park”; in France “Technopole”; in Japan, “Technopolis”; in Germany, “Grunderzentrum (Technology Center)” and so on. Other than these special namings for the countries there are also the names like “Enterprise Center”, “Innovation Center”, “Industrial Park”, “Business Park/Center” which is used under STP roof or as other naming derivatives of STPs (Çilingir et al., 2011). 2.2 Emergence of STPs in the World Generally in the world, the establishment of STPs go back to WWII era and they rapidly developed just after the war and up until now. Today, Silicon Valley (SV) is one of the STPs which have been keeping its prestige, popularity and scientific and technologic infrastructure and economic power that it 8 reached at a peak point for more than 50 years. Establishment of SV was the most important attempt which seeds STPs first in the USA then in the whole world. At this point, making a little introduction to SV’s history is important for understanding some critical factors for introduction to STPs’ contents. In the Web site of Stanford University, which had taken the most important role in the establishment of this important STP in South California, gives the following information about SV under its “History of Stanford” title and “The Rise of Silicon Valley” subtitle as such: In 1939, with the encouragement of their professor and mentor, Frederick Terman, Stanford alumni David Packard and William Hewlett established a little electronics company in a Palo Alto garage. That garage would later be dubbed "the Birthplace of Silicon Valley. This main explanation continues in a way to emphasize the importance of Silicon Valley’s place as such: Over the following years, Stanford would be a wellspring of innovation, producing advances in research and the formation of many companies that have made Silicon Valley one of the most innovative and productive high-tech regions in the world. It is interesting that the names both in the founding team of today’s one of the most famous large companies with its variety and economic power, “HewlettPackard (HP)” and in the team preparing the founding base for SV. Thus, STPs, in fact, are the mechanisms being carried out with the entrepreneurial spirit and work of two alumni who initiated SV first. Here, it is beneficial to know that such an “entrepreneurship” mentality, which is so crucial for STPs, goes back to the very beginning. From firm founders to academicians, from managers to investors, no matter which network member they are, it has been 9 important to have a success to integrate the concept of “entrepreneurship” to the life cycle of STPs, for the success of these organizations in the STP history. Another important point is the foundation and development of the SV in a way to benefit from Stanford University’s scientific and academic infrastructure seriously. Before SV, “Stanford Industrial Park” (1951) founded as a part of Stanford University, (today known as “Stanford Research Park”), is one of the most important steps in the process of SV’s being into action. This situation, in fact shows how important the academic world and its members’ (universities, higher education institutions (HEIs), academicians, students etc.) are in the emergence of STPs. Stanford University, in the website about the history of SV refers to this situation as such: Under the leadership of Terman, a professor of electrical engineering who served as provost from 1955 to 1965, the university embarked upon a campaign to build “steeples of excellence,” clusters of outstanding science and engineering researchers who would attract the best students. His role in fostering close ties between Stanford students and the emerging technology industries has led some to consider him the father of Silicon Valley. He created an entrepreneurial spirit that today extends to every academic discipline at Stanford. 10 Figure 2. Relationship with Universities (Source: IASP General Survey 2012) In the Figure 2, taking the responses of the worldwide STPs answering to a survey conducted by IASP as the base, the ratios of STPs’ collaboration or relations to different institutions, organizations, universities and other academic institutions are shown. When the graph is seen in the figure, more than 90% of the STP’s are in relation/collaboration with the organizations mentioned above in one way or the other. Moreover in Table 1, it can be seen that STPs filling the IASP survey, rank universities/HEIs in the second rank in being in relation/collaboration. From the tables it can be understood that these ratios are important for STPs. In summary, I can conclude that from the day SV was founded to today, in the life-cycle of STPs; they never lost the importance of their relationship with the universities, research centers and other academic institutions and organizations. 11 Table 1. Relationship with Universities (Source: IASP General Survey 2012) The foundation and establishment of Silicon Valley has been the subject of many various studies. Here in its short narrative of history, what is tried to be emphasized is “entrepreneurship” and “academic collaboration” concepts that I also consider in terms of this thesis is a must for a region which is an STP pioneer like SV. Both concepts are crucial in SV’s establishment and its success in reaching sustainable productivity. Other than Silicon Valley which I introduced as a separate case above, in Figure 3, the ratios of the STPs responding to IASP survey and the ratio of age and locations in the world in the process of STPs’ emergence can be seen. 12 Survey Responses Location Age Figure 3. Age and Location Percentages of STPs by Survey Responses (IASP General Survey 2012) In Figure 3; it can be seen that more than 80% of the STPs are established and became active after 1980s. It can be argued that the rapid growing and developing Information and Communication Technologies (ICT), Computer Technologies and Internet Technologies are very effective in fastening and facilitating the networking process. In terms of many other features of STPs, (capacity, firm number, financial support, ownership type and more), the IASP General Survey 2012 document 13 covering many current and a large variety of quantitative data can be examined. For another example, it can be seen in Figure 4, the ratios of sectors in STPs which were analyzed in IASP 2012 data which is also important to consider the general sectoral distribution of the worldwide STPs today. Figure 4. Sectors in STPs (Source: IASP General Survey 2012) 2.3 Emergence of STPs in Turkey and Their Development A very long time after the emergence and spread of the STPs in the world, STPs and STP culture started to arise in Turkey. STPs are called with different names in Turkey: “Technopark”, “research center”, “incubation center” etc. Nevertheless, despite different names and adjectives they had taken, the general heading that combines all these names under is “Technology Development Region (TDR)”. Another interesting point here is long before this heading started to be used, STP constitution started to emerge in Turkey. 14 Here, the focus of the thesis is METU Technopolis, which is the first STPs in Turkey along with TÜBİTAK Marmara Research Center. Today, official policy definitions and the studies for legal orders about Turkey’s STPs, i.e. TDRs, started at the beginning of 2000s. However, the active steps were taken by Middle East Technical University’s METU Technopolis, which was established in late 80s and TÜBİTAK Marmara Research Center which became active in the early 70s. In other words, long before official and legal regulations, initiatives started to help STPs to come into life in Turkey. These initiatives were not formally referred as “technopark” or “STP” due to the inadequate legal regulations. Nonetheless, both of them, in terms of operation are first serious organizations which turn the scientific knowledge they received with the help of HEIs into industrial, economic and commercial profits and benefits, by processing it with R&D processes. In 1998, with the acceptance of both organizations as legally the first “STP”s in Turkey (i.e. “technoparks” as they were named in the country), important steps about recognizing them legally and making policies about them started to be taken. In 1990, in terms of supporting the SMEs which were important in defining the economic trends and scientific and technologic developments in the world, in many different ways; under the roof of Turkish Republic’s Ministry of Science, Industry and Technology, an organization entitled “Small and Medium Enterprises Development Organization (SMEDO / KOSGEB)” is founded. The fundamental supports that the organization aimed to provide to the SMEs were: To help SMEs to keep up with the technological innovations rapidly. To increase the competitiveness powers and levels of SMEs. To carry out integration in industry, in accordance with economic developments. 15 SMEs being supported by SMEDO as such and TDR’s being recognized legally became an important step for SMEs’ production of clustering and networking processes. It is possible to perceive the indicators of this initiative as such: From the establishment of SMEDO to 10 years after its establishment, TDRs became well-known and recognized officially in the country and SMEDO started to establish their own “Technology Development Center (TDC)”. These TDCs had the characteristics to be an incubation center for the SMEs taking support from SMEDO. SMEDO, via these TDCs, supported these SMEs in many ways (especially financial, equipment, laboratory, consulting services, participation in the conferences, and publicity of the products/projects and so on.) These supports, provided contributions both for SMEs and their clustering and also for the TDRs they were in. When 1991 is reached, Technology Development Foundation of Turkey was founded in order to provide support for R&D and technological innovation projects. The foundation has summarized its aim of establishment and the success it brought as such: Technology Development Foundation of Turkey (TTGV) has proven to be a successful example to all of Europe as an innovative and dynamic intermediary. Intermediaries were mentioned in the EU Lisbon Communiqué as being necessary for conveying public support for R&D in the private sector. Development Plans of the Turkish State which has newly shaped in Turkey, after the establishment of Republic, started to include science and technology policy plans long after it was established. When it was examined by splitting it to different time periods from the beginning of 21 st cc. (from early 1920s to 16 early 2000s)1, it can be seen that STPs or “technology development regions (TDRs)” do not have a well-established place within these Development Plans. As late as 1996, Turkish Republic Ministry of Industry and Trade of that time (now it is Turkish Republic Ministry of Science, Industry and Technology) published a regulation on technoparks. However, the main steps were taken in the early 2000s. In 2001, with the beginning of 21st cc, these two needs started to be perceived highly: The need to keep up with the world’s STP trends, most importantly the university-industry collaboration which has developed all around the world The need to find a solution to the problem for Turkey’s two technoparks which had already been established without having a full legal status (for METU Technopolis and TÜBİTAK Marmara Research Center) and pave the way for newer establishments that will be founded. As a result, in 2011 “Law of the Technology Development Regions (No. 4691)” was enacted. With this legislation, the organizations and establishments related to various types of STPs in the world, was gathered together under the heading “technology development regions” in Turkey. In this law, different Yıldız, B., Ilgaz, H., & Seferoğlu, S. (2010). Türkiye’de Bilim ve Teknoloji Politikaları: 1963'ten 2013'e Kalkınma Planlarına Genel Bir Bakış. Academic Computing Conferences, (458-461). Muğla. 1 17 regulations/changes has been made or with the other laws etc. (such as “Technology Development Zones Application Regulation (2002)”, “Law on Supporting Research and Development Activities (No. 5746 / 2008)”, “Research and Analysis Report (Presidency of the Republic of Turkey State Supervisory Council, 2009/1)”and so on) the process of supporting them started to be made. However, at the beginning, Law No. 4691 became the first serious effort in Turkey to provide full legality to STPs, and paving way for their establishment. By January 2013; when taking the rapidly growing numbers of the STPs especially after the establishment of Law No. 4691, there are 49 technology development regions2 in Turkey, 34 of which is already active and 15 of which is at the process of establishment. With the law’s being effectuated, TDRs started to take place also as a part of strategy documents and action plans of the country. Today, for instance the Strategic Plan for 2013-2017 of Turkish Republic Ministry of Science, Industry and Technology is as the following: Increasing the number of technology development regions in Turkey, and strengthening their infrastructures. Establishing “Technology Transfer Office”s within TDRs and providing support for increasing level of awareness for them Transfering the knowledge and experience provided by international institutions to the country Encouraging TDRs to be specialized in especially the primarily important fields Informing and supporting these regions with various institutional support programs. 2 T.R. Ministry of Development website http://www.sanayi.gov.tr, 2013. 18 As another example, the concept of “technoparks” is cited within the institutions that will be cooperated in terms of Turkish Republic National Science, Technology and Innovation Strategy (2011-2016) – 2013 Action Plan’s following items: Examining and developing the models related to finance of technology transfer process Making and implementing patent education programs for R&D personnel, academicians and researchers. Developing pre-incubation models for encouraging the marketing of research results. Establishment of Technology Development Centers with public/private institutions and organizations such as “Small and Medium Enterprises Development Organization (SMEDO), Universities, Industry/Commerce and/or Chambers Of Commerce And Industry, Technoparks, Research Institutes, Institutions or cooperating in R&D and innovation fields with them. In Turkey, in defining the success criteria of universities and HEIs the contribution TDRs make to “university-industry collaboration” and “relations and linkages with TDRs” are very important. “Entrepreneurial and Innovative University Index”, created with the guidance of TÜBİTAK is a concrete result of this case. Universities and HEIs, in order to be successful enough to take high values in terms of this index, 65% of the success criteria is related to university-industry collaboration and linkages with TDRs. Three subheadings related to these “collaboration and linkage” titles are as such: 25% ratio belongs to “Collaboration and Interaction”, 15% ratio is for 19 “Entrepreneurship and Innovativeness Culture” and 25% ratio is for “Economic Contribution and Commercialization”. 3 2.4 Role of Cooperation within STPs Social networks are important in defining the social relations that are shaped by trust, information, action and cooperation factors (Castilla, 2003: p. 131) and these networks are also important for dynamic social relations of STPs which are also a network by itself. In local economic development strategies, in which many other factors were also included, the importance of “cooperation” and “synergy” factors (Copus, Skuras and Tsegenidi, 2008: p. 74) are also the same for STPs which these strategies are in. The subject that I will consider in this thesis’ focus, is “cooperation” as it is also mentioned in these expressions. STPs are foundations which gather the firms socially, organizationally as well as geographically and locationally under the same roof, under the heading of “Cooperation”. These establishments have a specific importance with the contributions of the advantages inter-firm linkages within STPs’ internal structures. As an example for these advantages inter-firm linkages provide, Sternberg and Arndt (2001: p. 367) say the following from the point of SMEs: In “Marshallian” terms, these linkages generate external economies and reduce transaction costs owing to the geographical, organizational, and social proximity of innovative agents. Under geographical advantages, “spatial proximity” which has an important place in STP’s advantages is one of the factors that can facilitate cooperation. The Scientific and Technological Research Council of Turkey, The Entrepreneurial and Innovative University Index, 2013. 3 20 Spatial proximity has benefits such as lowering the wages, facilitating information interchange and increasing interpersonal contacts and inter-firm cooperation (Vucic, 2009: p. 29). As a result of this, an actively working local area and STP mechanism start to emerge within a region. STPs which take important roles in providing these linkages, has interaction processes between social actors which has to continue during they are operational. A networking infrastructure which intake all of these process and which should be active all the time, is a fundamental constituent of STPs. This networking brings a need for “cooperation” between the STP’s social actors and also a large cooperation network generally in STPs. As a result, a university-industry, public-private sector, institution-firm and an infrastructure success of many other strong relationships deriving from them are the characteristics in a healthy functioning STP. Supplier–customer, information exchange, technological cooperation, labor mobility relations can be added to cooperation types of STPs, too (Schwartz and Hornych, 2010: p. 489). The quality and adequacy of the relationships of STP actors between each other and cooperation types are directly affected from many factors as the following examples are given: The effective functioning of the knowledge cycles and transfer processes between the actors of STP managements Continuity of financial and qualitative support processes as parts of STP input-output life cycle. Success of the firms within STPs in terms of finalization of R&D projects and capability of being innovative. For instance, knowledge sharing, which developes out of cooperation among local actors, decreases the costs for each actor in terms of knowledge creation 21 and utilization (Yaşar, 2010: p. 40), and this can be shown as an example for these factors. As another example; localized cooperation between SMEs’ and its strengthening innovative capacity of the region in relation to knowledge transfer, skills and ideas can be given (Sungu, 2006: p. 216). Thus, it can be said that STPs, which are a kind of cooperation roof for SMEs in their own structure are the mediators strengthening this capacity. It should be looked at “Cooperation” concept in terms of STPs from another perspective. Innovation processes for the firms, which forms the physical infrastructure of today’s successful STP models as much as their qualitative aspects, are important steps in development of these models. These processes are also important for the general operating mechanisms of STPs and getting creative outcomes by them. Today, for both firms and STPs, technical change and innovation are concepts which are crucial for STPs. Alm and McKelvey (2000), especially for making innovation, firms’ external relationships being tended to many cooperation attitudes, and the researches on this share the following: Firms’ cooperation and external linkages within themselves and other organizations, play a central role in innovative process. The sectors, which are shaped by firms’ activity fields and take a crucial role in determining the future of STPs, are also able to be related to “cooperation” mechanisms. One of the approaches towards this is as such: “New competition” mentality brings a perspective to “industrial sector” concept involving inter-firm relations and cooperation. In understanding of this sector, it is also aimed to encourage inter-firm cooperation with the contribution of extra-firm agencies (trade associations, training programmes etc.) and 22 facilitate that (Pitelis and Pseiridis, 2007). In the same study Pitelis and Pseiridis, puts that these firms besides competing, can affect “the rules of the game” all together and at the same time, this situation might be in a way that all firms will be affected, too. (for instance effecting the strategy of a sector). As another approach, STPs can be thought as a sectoral system. Cooperation for the firms within the sectors that it can be seen in the definition of Malerba (2009) on sectoral system perspective: A sectoral system perspective focuses on firms, capabilities and learning processes as major drivers of innovation and growth. But also pays a lot of attention to “the knowledge base of sectors; other actors relevant for innovation, such as individuals, suppliers, users, universities, the government, financial organizations; links and networks among actors, institutions, processes of competition, cooperation and co-evolution.”4 Many social system actors mentioned in the definition above, in fact have significant roles in STPs’ emergence and sustainability. A conclusion that could be derived from these definitions is that cooperation among the firms, one of these actors, have an important place in the functioning mechanisms of the firms in a sectoral system. I would like to define the four important constituents that I relate to cooperation as part of my thesis study, as borrowed from Malerba’s definition. For the sectors that the firms are parts of within these STPs: Malerba, F. (2009). Sectoral systems, Economic Development and Catching-up. Crecimiento Económico y Desarrollo En America Latina. Mexico City. 4 23 “The production and use of the knowledge for each sector” emerging with the concept of “the knowledge base of sectors” (Sectors and Sectoral Diversification / Concentration) The importance of innovation in capabilities and learning processes of the firms which are the main actors of the STP (R&D and Innovation) The “supporter” characteristics which many actors in STPs carry (suppliers, universities, government, financial organizations etc.) (Support) An STP roof and its functionality mechanisms that makes the actors within its borders strong and efficient by linking them to each other (STP Infrastructure) The place and importance of all these concepts, in the growth and development processes of STPs which I define as a sectoral system in terms of the roles that I mentioned above, can be easily understood. Nevertheless, since cooperation concept which is as important as these four constituents is included in the definition, I conclude as such: Especially, the cooperation among the firms and these four constituents have crucial connections that can affect both each other in STPs’ life-circle. I, on the other hand, put “cooperation among METUTECH” as the focus of my research study, and aim to define how these four constituents affect it, from the perspective of the METUTECH firms in the technopolis. 24 CHAPTER 3 METHODOLOGY AND DATA COLLECTION This thesis differs from other/similar studies in terms of certain features in its methodology and data collection structure. To draw an overall picture of today’s METUTECH (i.e. the population of the study), I requested statistical data from the METUTECH management. After informing the METUTECH management and completing the necessary paperwork between METU Science and Technology Policy Studies Department and the METUTECH management, I received the data that constitutes the basis of this study. During face-to-face interviews with the METUTECH management, it became clear that this data was one of the most comprehensive and detailed compilation they have edited up until now.5 This data is used along with the semistructured firm interviews (i.e. Firm Evaluation Form) I designed, to create the framework of this study. Before elaborating on the semi-structured interviews, it will be useful to draw a general and current profile for METU Technopolis with reference to METUTECH data mentioned above. It is important to emphasize that through such data collection, I established my research on the most recent and firsthand data on METUTECH. In other words, I gathered this data together from the current statistics (dated March 2013) I obtained as a result of my direct 5 The data is dated as March, 2013. 25 formal and semiformal contracts with the METUTECH management. However, before presenting the statistics that I gathered from the data, I think it is important to tell the reader why I had chosen METUTECH as the focus of this research study. 3.1 The Focus of Research Study: METU Technopolis METU Technopolis (METUTECH), is the first STP/technopark of Turkey which was established in a university campus directly and active for mediation vision and mission for university-industry cooperation. Even though the establishment steps had been taken de facto in 1980s, it was legally recognized with Law. No. 4691, Law of Technology Development Regions. At this point, the official establishment year of METUTECH is accepted as 2001, the year this law was enacted. METUTECH with its more than 20 year history in terms of being at idea stage and de facto functioning, and legal process more than 10 years; is accepted as the pioneer of all technology development regions in Turkey. Including METUTECH, with the enactment of Law no. 4691, from 2001 to today, the increase in the number of all the firms active within all the Turkish TDRs are shown in Figure 5. 26 2500 2.114 2000 1.800 1.515 1500 1.154 1000 1.254 802 500 0 0 169 318 500 604 0 2001 2002 2003 2004 2005 2006 2007 2008 2009 2010 2011 2012 Figure 5. Total Firm Number in Technology Development Regions by Years (Source: METUTECH Management – March 2013) In Figure 5 it can be seen that by 2012, total number of firms in TDRs reach 2114. Today, the number of firms in per STP that I had mentioned under the heading “Emergence of STPs in Turkey and Their Development” is 43-44, regarding that in total 49 TDRs had been cited. In Table 2, with March 2013 statistics, the number of total firms are 283. While taking into consideration that the time interval, when these results were taken, is too close; I can conclude that METUTECH has the 10% of the total active firms of all TDRs in Turkey. This result indicates a point: METUTECH, in its long history within the STPs in Turkey, has a high ratio and importance in terms of the number of firms it provided at TDR level in Turkey. Figure 6, on the other hand, shows the general sectoral distribution of the firms which are active in the Turkish TDRs. 27 AUTOMOTIVE 2% BIOTECH. ADV. MAT. 1% 2% MACHINE ENV. 2% TELECOM. 1% ENERGY 2% 3% CHEMISTRY FOOD 1% 1% AGRICULTURE 1% NANOTECHNOLOGY 1% MEDICAL 3% MEDICAL & BIOMEDICAL 3% SOFTWARE & ICT 55% DESIGN 4% OTHER 5% ELEKTRONİK 8% DEFENCE 5% Figure 6. Sectoral Distribution of the Whole Technology Development Regions (Source: METUTECH Management, 2013) In Figure 6, it can be seen that the sectoral distribution ratios of all the firms which are active in the Turkish TDRs in 2013, is similar to the METUTECH results (Figure 9). The sectoral distribution of METUTECH shows close results by analogy with Figure 6 and especially, there are big similarities in terms of maximum ratio (Software & ICT and Electronics) and minimum ratio (such as Food, Chemistry, Agriculture, Nanotechnology) sectors. Of course, there are significant roles of the sectoral tendencies of the TDRs established in Turkey, in terms of the sectoral concentrations of the region or the disciplines which research institutions and centers or universities near/in the campus focused on. Furthermore, country policies or the areas that 28 national and regional supports are high, the visions and missions of the investments and many other factors have an effect on the sectoral tendencies. In addition to many examples beside this one, the sectoral distribution of METUTECH shows similarities with the general distribution of Figure 6 and reveals that the TDRs established after METUTECH, can see METUTECH as a role model for themselves and take lessons from the sectoral trends of METUTECH. Moreover, one of the life veins is the success of Middle East Technical University (METU) in the establishment of METUTECH which is a part of this university and located in its campus today. Especially in university-industry cooperation, METU is one of the most important social actors which had taken METUTECH to today’s pioneer position within the TDRs in Turkey. METU, in Entrepreneurial and Innovative University Index which was prepared under the leadership of TUBİTAK, in 2013, became the first one of the top 50 universities in Turkey with 86 points. In 2012, it was ranked as the second in the top 50 list, and had taken many top ranks like these results in this index up to now. In the index there are five headings as “Scientific and Technological Research Competency”, “IPR pool”, “Collaboration and Interaction”, “Entrepreneurship and Innovativeness Culture” and “Economic Contribution and Commercialization”; and within 5 headings there are success percentages for each heading. For the universities in the index, evaluating generally the universities over these five headings, METU gives high points and ranks. The success of METU within this index can be seen as an important determinant for keeping METUTECH’s leadership position which has continued for years. The relationship between METU and METUTECH also takes place in METU’s Strategic Plan document. In the 2011-2016 version of the plan, which is the 29 most current one, one of the 7 Strategic Programs is directly on “METU Technopolis”. The three scopes each having its subtopics are as such: “Turning knowledge to economic benefit and the effective use of METUTECH and its potential, in terms of university-industry collaboration” “Encouragement of METUTECH’s internationalization” “Increasing and extending the contribution of METU, METUTECH and university-industry collaboration to the society and country” In the Strategic Plan of METU, a reciprocal interest relation is shown in terms of METUTECH’s official place and importance: As METUTECH needs METU’s qualitative and quantitative resources and infrastructure; METU also needs METUTECH in terms of its vision and mission aims. All these points indicate that METUTECH is different from the TDRs in Turkey specifically in many ways. However, beyond METUTECH, I thought that it will also be a source which all TDRs in Turkey may use. In fact, what I emphasized above as the point differentiating METUTECH from other Turkish TDRs: METUTECH is a specific and significant model for the other TDRs in Turkey. Therefore, this point strengthens the probability that this thesis study will be taken as a reference by them. My department (Science and Technology Policy Studies) has close relationships with METUTECH both in terms of its subjects/research areas and in terms of my studies, which helped me examine METUTECH, which facilitated my having a deep and current information-exchange. In Figure 7, in 2011, the percentages for the categories of Turkey’s TDRs’ firm cooperation’s being local or foreign are given. Both in inside and outside of 30 their locations, firms take the biggest percentage in terms of firm cooperation from METUTECH. Also, in terms of the cooperation ratio with the foreign firms outside its borders, it is ranked as 2nd. Within the other three TDRs having important successes, METUTECH’s success as being ranked 1st in local firm cooperations can be observed as a remarkable result. However, whether these ratios are indicators of a qualitative success or a quantitative success which comes with a critical difference in firm cooperation within TDRs is a question that will be discussed in the next sections and chapters. Figure 7. Firm Cooperation Percentages by TDRs6 3.2 General Profile of METUTECH There are different buildings with different characteristics in METUTECH. Today also buildings with similar or different architectural designs or plans added to these buildings, and the old ones are being restored. Table 3 shows the sectoral distribution and their percentages in all buildings within the main Pekol, Ö., & Erbaş, B. Ç. (2011). Technoparks in Turkey: Patent System Perspective. Ege Academic Review, Vol. 11, No. 1, p. 48. 6 31 campus of METUTECH and Figure 11 shows sectoral distribution and percentages in the technopolis’ sub-zones. It can be said that the sectoral distribution in the sub-zones are not much different than the main campus. By putting these two tables to the starting point; I can say there are two sectors which dominate the subzones and the main campus and main campus blocks in METUTECH: First one is Software & ICT and the second one is Electronics. These two sectors are categorized as the first two clusters in my research. Based on the data in Table 3 and Figure 11, I argue that my third cluster Design firms compose the half of the firms despite not having offices in every building. Figure 8 shows a general settlement plan for METUTECH Main Campus with its oldest and newest business buildings (e.g. Turk Telecom R&D Building and Incubation Center - still under construction). I could not use any map figures on the settlements for the sub-zones since there was not a large settlement map for the sub-zones, similar to the one I have for METUTECH main campus. Instead, I tried to define the sub-zones with the table and statistics (especially by giving their firm numbers etc). In Figure 8, yellow line designates the borders of the whole area on which METUTECH Main Campus is situated, i.e. today’s broadest borders of the main campus. Red line indicates the borders of a sub-region within the main campus and hosts the R&D centers/buildings of three defense industry giants of Turkey as noted below. The yellow numbers represents the METUTECH business buildings, R&D facilities and incubation centers of the main campus. 32 33 Technology Development Subregion) (Yellow Region: METU Technopolis / Red Region: Defence Industry Research and (Source: Google Earth - 2013) Figure 8. METU Technopolis Settlement Plan and Buildings (Main Campus) Apart from the main campus on Figure 8, METUTECH has two external subzones: First one is a technology development campus in OSTİM (Middle East Industry and Trade Center) Organized Industrial Region, which is located to the north of the main campus; nearly 15 km away from the main campus. The second one is METU-MEMS (Micro-Electro-Mechanical Systems) Research and Application Center, also situated in the north, at 3 km distance to the main campus. OSTİM campus was established to sustain a strong relation between METUTECH and the largest and the most dynamic industry region of Ankara, OSTİM. This region also incorporates many suppliers (especially subcontractors) which could help METUTECH firms managing their supply chain. METU-MEMS, which was established almost concurrently and independently from METUTECH, has been producing and developing microelectronic materials within its well-equipped laboratories. To take advantage of its advanced facilities, METUTECH aimed to establish a substantial connection with METU-MEMS. As a result, the technopolis management oriented and gathered together some of METUTECH’s microelectronic technology-focused firms for creating an efficient R&D activity network in this research field. To put it simply, today’s METU Technopolis consists of three zones strategically as well as geographically. This thesis sets the main campus as a starting point and formulates its research question by focusing on the main campus through qualitative analysis. In addition, it makes use of quantitative analysis for exploring the characteristics of the firms in the whole region of 34 METUTECH (i.e. Main Campus, OSTİM Campus and METU-MEMS). However, the emphasis will be on the main campus because of its hosting; The large number of METUTECH firms, METUTECH management as well as its characteristics of having consisted: A large sectoral diversity of firms (from young entrepreneurs’ SMEs to R&D departments of well-known and prestigious trademarks being active in different sectors) Locational proximity advantage between the main campus firms A master coordinator position of those three zones. Although I interviewed with some firms of METUTECH sub-zones (i.e. OSTİM campus and METU-MEMS) and presented their feedback in the general evaluation; the interview results of the main campus firms made up the core material of the thesis. When the characteristics of METUTECH main campus above are considered, the main campus seems more advantageous in comparison to the sub-zones. This would lead the study to be more comprehensive, and help future researchers to adapt it for the sub-zones of METUTECH. The contribution here is made by examining the “cooperation” aspect of METUTECH’s main campus, and this will also be a guide for the future researchers for exploring METUTECH’s sub-zones. Figure 9 and Table 2 indicates most basic sectoral distribution of whole METUTECH (including the sub-zones): 35 Table 2. Firm Number in Sectors (Source: METUTECH Management – March 2013) Figure 9. Firm Percentage in Sectors (Sectoral Distribution) (Source: METUTECH Management – March 2013) 36 Figure 10 and Table 3 more specifically, shows the general sectoral distribution of the firms in METUTECH Main Campus buildings, the names of which were listed above. These figures and table are significant in terms of presenting a detailed view of the sectoral distribution of firms in METUTECH. It is obvious that the Software & ICT firms rank highest, as they correspond to almost half of the total number of firms. In the second place, the firms of Electronics sector come to the fore with a ratio at around 1/5 of the whole firms of the main campus. The third sector is the Design firms, corresponding 10% of the whole main campus firms. As it can be seen in the figure, the rest of the firms are small in quantity, each corresponding less than 10% of the whole firms. 37 38 (*The data colored with same color in each sectoral line indicates that there is one common firm in both buildings: e.g. The blue data in the Software & ICT line, indicates that there are 29 firms in Silicon building one of which also has building in Silver-Main Building, and other 20 firms in the latter have no other office outside their host building.) (Source: METUTECH Management – March 2013) Table 3. Numerical Distribution of Firms in Sectors by METU Technopolis Buildings (Main Campus) 39 (Source: METUTECH Management – March 2013) Figure 10. Distribution of Firms in Sectors by METU Technopolis Buildings (Main Campus) In addition to these figures related to METUTECH Main Campus which were explained above, Figure 11 presents the sectoral distribution in OSTİM campus and METU-MEMS sub-zones. The top sectors are Electronics (50%) and Software & ICT (20%) for METU-MEMS and Electronics (50%), Design (25.5%) and Software & ICT (23.4%) for OSTIM campus. Figure 11. Distribution of Firms in Sectors by METU Technopolis Sub-Zones (Source: METUTECH Management – March 2013) (*“Other” cluster indicates the sectoral distribution of the firms having no office in any of the METU-Tech campuses, despite being a part of METUTECH) 40 3.3 Data Selection and Sampling Methodology In the first place, I would like to explain my preparations for the design of this study under this title. I categorized all the firms in METUTECH under 4 different clusters, taking their percentages in terms of sectoral distribution into account: Software & ICT, Electronics, Design and Other (Below 10%). First 3 clusters consist of firms the sectoral distribution percentage of which is above 10%, whereas the Other (Below 10%) cluster represents all the other firms whose percentage is way below this 10% threshold. Keeping the sectoral distribution of the clusters I draw my sample and conducted the semi-structured interviews which I mentioned above. The interview questionnaire that I prepared involves questions related to firms’ scales (large vs. SMEs) financial situation and other success criteria like IPR success, as well as evaluating the firms’ opinions regarding my four important constituent (as explained in the “Introduction” part of the thesis) and their sub-titles: Concerning their senses of R&D and innovation, sectoral diversification/concentration, internal and external support mechanisms of METUTECH and the infrastructural characteristics of METUTECH. Thus, first the physical profiles (scale, project numbers, IPR success etc) are drawn from the quantitative data taken from the firms. After that, firm’s views on four main constituent is taken as qualitative data from the firms themselves. Lastly, the views of the firms on their positive-negative perspectives of cooperation among themselves are taken. Here the aim is, after taking the physical profiles of the METUTECH firms, there are result sets emerging based on the relations between the firms’ sectors perspectives to cooperation and other four constituents. 41 Due to time constraints, I set the number of firms I would like interview as 15% of the whole population: 43 firms were interviewed over 283 firms of METUTECH. The second criterion is related to sectoral distribution. I decided to set a 10% threshold for each sector to get a “representative” sample of the firms. At this point, to figure out which sectors has expanded more in METUTECH up to this day; the data provided by METUTECH management is used. The sectors over 10% threshold (i.e. the number of firms belonging to that particular sector is more than 10% of the all firms of METUTECH) are Software & ICT, Electronics and Design. Other sectors had a lower number of firms, below 10% of the whole population of METUTECH firms. Therefore, I paid attention to get a representative number of the first three sectors (above 10% threshold) and a “Other” cluster (combining the ones below 10% threshold) for the interviews. In other words, the main sampling methodology is “stratified sampling”7 with an intention to fulfill the necessary number of interviews for each cluster. However, some of the firms did not respond back due to different reasons such as their confidentiality policies, time constraints, security reasons and so forth, resulting in a smaller number of firms interviewed than the number I intended. Still, as it can be seen in the following table, the percentages are close enough to lead us to conclude that I had a representative sample for METUTECH (see Table 4): 7 Westfall, L. (2010). The Certified Software Quality Engineer Handbook. Wisconsin: Quality Press, p. 361. 42 Table 4. Sectoral Clusters (Source: METUTECH Management – March 2013) 43 3.4 Methodology and Tools The main methodology of the study is based on semi-structured interviews with 43 firms. It was aimed to understand their general profiles (size, project number, IPR data etc.) and their opinions, which is about support mechanisms, sectoral diversification, METUTECH infrastructure, and their R&D and innovation policies. Despite no recorders were used during the interviews, I took notes transcribing almost all of their answers simultaneously during the interview. There were 7 firms which responded the interview via e-mail and with other 36 firms face to face interviews were conducted. For evaluating the firms, I designed “Firm Evaluation Form” (Appendix A) in Turkish, containing demographic (e.g. number of employee, number of projects) and basic informative questions (e.g. date of establishment, financial/institutional support they receive, IPR details and so forth) in the first part. The second part of the form is designed to receive qualitative data related to their opinions of METUTECH infrastructure, whether they perceive METUTECH’s sectoral diversification positive or not, either the firms themselves have an R&D and innovation policy or not. I would like to introduce semi-structured interviews in general and the advantages of using this type of interview method in this particular study. It offers a flexible and multi-dimensional evaluation for research objects in comparison with some other methodologies which require quantitative analysis such as structured survey questionnaires, “likert scale” 44 questionnaires are more advantageous than close ended surveys. This is a significant benefit since the focus of my study is how these firms perceive cooperation related to R&D and innovation, support, sectoral diversification and METUTECH infrastructure; as well as whether they cooperate or not. At this juncture, to emphasize METUTECH’s specific problems, to address its specific characteristics and to generalize over its social actors’ opinions on the given subject, cooperation, I set the questionnaire in the following form: First part was formed to get quantitative data, including the questions on: Date of establishment of the firm, the department and the building. Their current number of employees in each department. Whether the firm had taken any support from any specific institution. Amount of financial support it received from any source. Any type of support received from METUTECH. Turnover of the firm and the ratio of METUTECH department in it. Number of projects, IPR success, their current situation and statistics. Statistics about their firm and project partners. The second part was consisted of open ended questions requiring qualitative answers. The questions can be gathered under the following titles: The reasons to establish firm offices in METUTECH. Whether the firms are satisfied with METUTECH, its pros and cons. Whether the firm has a R&D and innovation policy/aim/vision-mission or not. The sectoral diversification of METUTECH, and its pros and cons from the firm’s perspective. 45 In summary, in addition to gathering tangible statistics from the chosen interviewees (i.e. responses given to Part 1), open-ended but subject-oriented questions of this thesis’ semi-structured interviews (i.e. Firm Evaluation Form) offer the firms and social actors to opine their ideas from a broader sense (closely associated with “cooperation” matter). Thereby, a content-rich criticism collection can be comprised from the qualitative assessments of the chosen private firms. Here, “content-rich” statement refers to have a framework consisted of “having current feedbacks, being considerable from different angles, including one-on-one interview with firm executives’ answers of different sectors; and also collecting quantitative data and statistics about the firms’ general profile as much as interpretive questions in this thesis’ interview methodology and data collection. 3.5 Analysis Techniques and Statistical Tools In order to present a picture about the general and physical profiles of the 43 firms interviewed, the quantitative data gathered from the first part of the interviews, is analyzed graphically with the Microsoft Office-Excel 2013 program. These graphs show the general distribution of the interviewed firms of the 4 sector clusters that I defined before, for the following: Scale (SME vs. large) Annual income Number of patents/utility models Number of trademarks Number of total finished project/product numbers In order to analyze the qualitative data provided by the firms (firm opinions), “NVivo 10 Qualitative Analysis Program” is used. In order to analyze the 46 qualitative data provided by the firms (firm opinions), “NVivo 10 Qualitative Analysis Program” is used. All of the semi-structured interviews conducted with 43 firms, is coded one by one in the Nvivo 10 Analysis Program as a “source” with regard to their sector clusters. With the help of the program, the qualitative data (firm opinions) in each and every source is related to the nodes that I defined as “references”, i.e. as positive or negative opinions. With these relations I can reach to the information that which firm makes positive or negative references to the nodes in its interview (one or more than one reference). After that for each node, the total number of the firms making positive or negative references (source) is collected under “node family couples” including the “cooperation”. All of these node family couples and their analysis will be explained in detail in Chapter 4 (Analysis and Results). As a result of the calculations/analysis mentioned above, a report is prepared by the NVivo 10 program. These node family couples (positive/negative) for each sector cluster are analyzed in terms of degree of association with each other in “SPSS 20 Statistical Analysis Program”. In the program, the relations between the nodes couples are analyzed as the results of “contingency tables” created after “chi-square tests”. The values I got from these tables are used in making the node family couples more meaningful. In other words, whether the degree of association between the node family couples are “meaningful (H-alternative)” or “not meaningful (H-zero)” is figured out. Related to this, for each sector cluster, from the firms’ general perspective and perception, each of the four constituents of the METUTECH (R&D and Innovation, Support, Sectoral Diversification, Support), are studied to figure out whether these are meaningfully related or not to the matter of “Cooperation among METUTECH firms”. 47 CHAPTER 4 ANALYSIS AND RESULTS 4.1 General Profiles of the Firms Interviewed In the previous chapter I had illustrated the general profile of METUTECH, in terms of its firms and sectors. It was also explained that the data selection process was managed carefully, with cluster sampling, in order to get the most representative sample feasible (Chapter 3 - Table 4). Therefore, parallel to the real distribution of sectors in the METUTECH, the sectoral diversification of the firms interviewed is as in Figure 12. As it can be seen in that figure, 48.84% of the firms interviewed are “Software & ICT” firms, it is followed by “Other” cluster which I formed to include all other sectors such as telecommunication, nanotechnology and so on, where firms compose a less-than-10% percentage by themselves, with totally a 27.91% percentage and the second most important sector by itself, which corresponds to 13,95% percent of the firms interviewed, “Electronics”. The rest is the “Design” cluster, which is just around 10% (9,30%). This distribution of the sectors seemed to be important both in terms of having a representative sample in getting the general overview of METUTECH, and also in terms of looking deep into each cluster to figure out whether these sectors which have large number of firms in the technopolis have different attitudes towards of cooperation and other related subjects (four constituents: R&D and Innovation, Support, Sectoral Diversification, METUTECH Infrastructure). 48 Figure 12. Percentages of the Firms Interviewed related to Their Sectoral Distribution First, I want to present some quantitative statistics related to all firms that I interviewed. I believe that these statistics will be beneficial, before I examine the relationship between opinions and perspectives of every sector cluster firms related to four constituents and cooperation for giving me the information about the general profile. I obtained these statistics from the quantitative questions from the “Firm Evaluation Form” Part 1. In other words, I prepared the “physical profile and statistics of the firms interviewed” based on their own answers. The general distribution graphics of these statistical is prepared with Microsoft Office - Excel 2013 program. Only 6 of the 43 firms which is interviewed in terms of trust anxieties and time constraints (the reasons explained “Chapter 3 - Methodology and Data Collection”), are in “large-scaled” group. I think in making this situation, especially, sub-departments (such as R&D departments) of Turkey’s biggest 49 Defense Industry, Software & ICT and Electronics sectors’ firms in METUTECH are effective. As I had defined in the previous chapters, these sub-departments did not respond positively to my appointment request due to their time constraints and the security concerns of the main firm managements. Due to this reason in terms of my thesis, especially in the large scale firms that I interviewed I could not reach to an adequate number, and thus I could not take them into categorization in terms of firm scales. Nevertheless, I had taken these large firms, with the SMEs, except from the main campuses they belong to, as a part of METUTECH and included them into this chapter with the degree of association and contingency tables. Except from this, all the firms that I interviewed are presented above in terms of their being large and SMEs, their general profiles and statistics. Figure 13 shows the size of my firms interviewed. In Figure 13, it can be seen that in every cluster the percentage of large firms are lower than the SMEs. Only in the Electronics cluster, the percentage of large firms is 33.33%, corresponding to 1/3 of the firms in that sector. On the other hand, none of the Design firms interviewed were large firms. In the Other cluster, 83.33% of the firms were SMEs and the rest were large firms. The Software & ICT cluster, which consists half of the firms that were interviewed has 9.52% of their firms as large firms and the rest (90.48%) is SMEs. Overall, the number of large firms corresponds to only 13.95% of the all interviewed firms. 50 Figure 13. Percentages of SMEs vs Large-scaled Firms in Each Cluster (Interviewed) In the Figure 14, it can be seen that the annual income ranges of the firms with regards to sector clusters. The 6 large-scale firms out of 43 firms were generally in and outside Turkey, they are related big firms’ R&D departments. These firms, in face-to-face interviews, had given the income information of the related main firms. (In the large category, there are 2 Software & ICT, 2 Electronics, 2 Other cluster firms; however none of the Design clusters are being interviewed, thus in the graph it is close to zero). These values in Figure 14, are perceived as the large firms, since they are having annual income more than 20 million $, due to their main campus’ annual income. Not any information is given about the annual incomes of 3 Software & ICT cluster SMEs, and 3 Other cluster SMEs. Nevertheless, based on the statistics I had taken from these firms, I may say that they do not have a different annual income which is very different than the average annual income of the SMEs. All these column values, outside of the ones explained above, are related to 51 the SMEs interviewed in METUTECH. The most particular result of this figure is this: Half of the Software & ICT sector cluster firms which was the most interviewed firm, is lower than 1 million $. Especially the Software & ICT sector which can survive with low budgets and can have short term projects, it can be said that this situation is something expected. In the Figure 15, there are the numbers of the projects/products according to the firm sectors interviewed present (the number of large-scaled firms and the SMEs were combined together). In this figure, nevertheless, some results for the Software & ICT cluster is particularly present. Under 10, and within the range 10-50, the total number of project/product belongs to Software & ICT sector SMEs, which is the category that interviewed most. At the same time 2 large-scaled Software & ICT firms are also included to the sum, therefore, more finished project/product number can be expected. Despite this situation, I can conclude that the METUTECH firms in the Software & ICT sector are lower in finishing projects/products. Of course this result does not mean that in making projects/products, Software & ICT firms are less successful than the other sectors in METUTECH. Software & ICT firms, frequently, can produce new versions or software tools for the projects/products they had already finished and might count it as a “new project/product”. Similar comments on this situation are given by some Software ve ICT firms in the firm interviews. The lower number in the total project number is also related to this or similar situations. 52 53 Figure 14. Ranges of Annual Income Values for Each Cluster (2013) 54 Figure 15. Ranges of Project/Product Number for Each Cluster In Figure 16, there are IPR numbers of the firms interviewed according to their sector clusters. Here, “IPR” numbers represent the sum of the numbers of “patent” and “utility model” (large firms and SME numbers, is included with the general sum). Again, there are interesting results for the Software & ICT sectors SMEs in this graph, as well as the two large-scaled firms. Most sectors who take less than 10 patents are in this sector cluster. This low result is in fact an expected situation affected from the world trends: The Software and ICT sector in the world develop rapidly in terms of projects and products, due to their open-source structure, and distances these firms from the opinion of making an IPR activity in the sector. These firms can perceive this process as unnecessary and/or as a loss of time. I took many supporting comments from the many Software & ICT firms during my interviews in METUTECH. Lastly, I would like to talk about the trademark numbers in each sector cluster presented in Figure 17. (Combining both the large-scaled firms and SMEs together). I believe that there are some important results. All sector clusters, discluding one large-scaled Electronics firms, are lower than 10 in terms of trademark numbers. In other words, the ratio in METUTECH on this issue is very low. Nevertheless, in the figure, the result that I may define as a surprise is from the SMEs in the Software & ICT cluster. The SMEs in this cluster, in terms of gaining trademarks is high, despite their low numbers in total project/product and IPR graphs (Figure 15 and Figure 16). Another important result is the success of Software & ICT cluster in gaining trademarks is accompanied by the Other cluster. In other words, the sectors which have a number of firms lower than 10% of the METUTECH (the Other cluster), have clearly higher trademark numbers in comparison with the results of the Electronics and Design clusters. 55 56 Figure 16. Ranges of IPR (Patent + Utility Model) number for Each Cluster 57 Figure 17. Ranges of Trademark Number for Each Cluster 4.2 Analysis of Qualitative Data taken from Firm Evaluation Forms 4.2.1 Node Families and Firm Answers: In this section, I would like to introduce the qualitative analysis of the interview data taken from the interviews with Firm Evaluation Forms. The data was analyzed by “NVivo 10 Analysis Program” and the following nodes were composed during the analysis. The concepts I used as “node”s within NVivo Analysis Program are the ones I related the firm interviews to and corresponds to different titles I gathered under different groupings. As I had explained in the previous chapters, related to Nodes, in my thesis I took the most important 5 main nodes: For the sustainability, coordination and the efficient network between the actors in METUTECH which is an STP, there are four crucial and significant constituents, R&D and Innovation, Support, Sectoral Diversification and METUTECH Infrastructure. My 5th node is the “cooperation among METUTECH firms”, which is important as in the thesis the relationships of which is examined with the four constituents. I had used the all qualitative and some quantitative data that I had taken from the interviews under these 5 main node, as “sub-node”s. In other words, these sub-nodes in fact include firm answers, opinions and perspectives for my 5 main nodes. Thus, they formed “node families” with the five main nodes and their sub-nodes together. This can be observed in Table 5. The information I gained with the Firm Evaluation Form from the firms are put under the subnodes in Table 5. I gathered the “Cooperation” sub-nodes from the positive (+) and negative (-) comments that they made by relating it to other node families/main nodes. 58 Table 5. Node Families 59 4.2.2 Degree of Association between Node Families The sub-nodes nodes the definitions of which were given under the previous title were important in understanding the opinions of firms’ administrative executives on the matter of “cooperation among METUTECH firms” with regard to their sectoral distribution. These 43 firms within 4 sector clusters, gave the answers to Firm Evaluation Form questions, which I coded under these sub-nodes mentioned above with the help of NVivo 10 Analysis Program (i.e. sending references to these sub-nodes). I related these coding by being “positive (+)” or “negative (-)” in relation to the sub-nodes. In other words, firms’ opinions and perspectives are grouped as positive (+) or negative (-) due to their relations to the sub-nodes. I gathered the general sum of the firms making positive or negative references made to the node family, by getting the sum of all these firms making references to sub-nodes. Here the point that should be taken into account as I applied is this: I had taken any positive or negative reference given to the sub-nodes as a reference made to the related node family. For instance under the “Support” node family, I did take as a reference of a firm who referred to “External Support (+)”, as reference to both External Support (+) sub-node and to Support (+) node family. In order to analyze degree of association between the node families for each sector cluster and to figure out whether there are meaningful relationships or not; I examined clearly that which firms make references to the sub-nodes and thus to node families. While making this examination, I came across to SIMULTANEOUS/COEXISTING positive/ negative references to cooperation 60 and other node families. For instance: A firm in a sector cluster, in its interview, I looked whether the ones referred to “Sectoral Diversification” node family also made a references to “Cooperation” node family positively or negatively. Thus, by making this analysis, I combined these 4 node family couples: R&D and Innovation vs. Cooperation, Support vs. Cooperation, Sectoral Diversification vs. Cooperation, METUTECH Infrastructure vs. Cooperation. For each couple I examined 4 situations, i.e. I looked for a total of 16 situations. In other words, for each node family couple I tried to figure out these: Positive - Positive (+ +): Direct Relationship Negative - Negative (- -): Direct Relationship Positive - Negative (+ -): Inverse Relationship Negative – Positive (- +): Inverse Relationship Some firms made references to more than one to these four situations from the node family couples above. I added the references that any single firm made for more than one situation to the total of reference numbers. As a result, there might be different perspectives of a firm on a node family couple relationship (direct or inverse). Above, within 4 main situations, the firm references total which is taken by NVivo 10 Analysis Program is given by Table 8, in the very introduction part of Appendix B (Part-1). With these sub-tables, I examined whether there are meaningful degree of association results between the node family couples for each cluster and the total number of 4 main situations. This statistical observation is made with hypothesis as “meaningful (H-alternative)” or “notmeaningful (H-zero)”, as a part of the statistical process. 61 In other words, I tried to figure out whether I can form a meaningful “Direct Relationship”/“Inverse Relationship” or not between the node family couples. For this statistical analysis I used “Chi-square tests” via “SPSS 20 Statistical Analysis Program”. By making “Contingency Tables” and interpreting them, I examined whether the mentioned meaningful relationships might be formed or not. For the 4 sector clusters, by using Table 8 values given at the beginning of Appendix B (Part-1), I observed the degree of association between cooperation and the four constituents of METUTECH. The 16 Contingency Tables written as a result of Chi-square tests were given at the second part of Appendix B (Part-2). The statistics provided by using these contingency tables and Chisquare tests and the degree of association rules were also given in Appendix B (Part-2), after the tables. I reached to the following conclusions for each sector cluster in Table 6, by evaluating the Contingency Tables’ values that I emphasized with the red font color also given in Appendix B (Part-2) (I am going to interpret these results in the following and the last chapter - “Chapter 5: Conclusions”): 62 Table 6. Degree of Association between Node Families 63 CHAPTER 5 CONCLUSION 5.1 Summary This study, examining METUTECH, which has an important place among all “Science and Technology Places”, also qualified as “Technology Development Regions” in Turkey is unique in terms of its approach to the subject, and its analysis techniques and its approach to METUTECH . In addition, the fact that the time period that I gathered the data and the statistics which are used in this study and the completion of this thesis is very close, which contributes to the up-to-dateness of this study. Methodologically, deep interviews helped me construct the perspective of the firms regarding cooperation and various factors that relate to cooperation much better than we could have done through a multiple-choice survey. The qualitative and quantitative data I gathered as a result of semi-structured interviews enabled me to offer a more detailed evaluation of METUTECH firms. Another factor of the building blocks of the methodology is the “node families” and “sub-nodes” of these families, which I defined with reference to the current literature on STPS (using NVivo 10 Analysis Program). These node families are chosen among the titles that are perceived as important for a the functioning of an STP as main “constituent”s R&D and Innovation, Support, Sectoral Diversification and METUTECH Infrastructure; and certainly the “cooperation among METUTECH firms” issue that I am especially interested in. It is especially important to look at the sectoral color of the officially most successful TDR of Turkey in drawing the general picture of METUTECH. In a 64 developing country like Turkey, STPs are the places where many emerging sectors in the world found places to themselves. Because, the firms which are active in these sectors, beyond only contributing to the development of these sectors, make an effort to decrease the R&D costs of the sector, fasten its commercialization process and making easy adaptation to industry processes. For this reason, STPs are the first hosts of these sectors in the process for being sustainable for the firms in these sectors (especially with their qualitative and quantitative supports). METUTECH on the other hand, is one of the first and most important TDRs in Turkey which took this responsibility. The general profile of this STP/TDR today had been explained in Chapter 3 (Methodology and Data Collection) for understanding the internal structure of METUTECH. The qualitative data that I collected through the semi-structured interviews that I conducted with the firms (firm size, IPR activity, project number etc.) helped me better understand the characteristics and identity of the firms that I had taken as in my sample. By this mean, I created 4 different clusters of the firms active by March 2013 in METUTECH: Software & ICT, Electronics, Design and Other. How these clusters in relation to the firms and sectors were categorized was explained in detail, throughout Chapter 3 (Methodology and Data Collection). Here, the striking point that I should make is the “Other” category contains all the sectors except those in the defined three clusters (Table 3.3). The sum of the firms active in these sectors within this ‘other’ category is below 10% of the general distribution of METUTECH in four clusters (Table 3.3). For this reason, I entitled this cluster as “Other”. This indicates that in METUTECH only four sectors (supposing Other cluster as a “single” sector) have a quantitative dominance. This situation’s being evaluated as positive/negative and relating it to the matter of “cooperation among METUTECH firms” in a “sectoral 65 diversification” title as a different node. I also added firms’ perspectives and opinions about “R&D and Innovation”, “METUTECH Infrastructure” and “Support mechanisms in METUTECH (Support)” to my node families (with their sub-nodes) to relate them to cooperation (among METUTECH firms). My last node family is “Cooperation” which I gathered through an examination of the opinions and general perspective of the firms regarding “cooperation among themselves”. Despite, cooperation among METUTECH firms is the main focus of the thesis; I took it as one of the nodes in terms of evaluating the results. The first reason for this is to see how and how much Cooperation was mentioned directly or indirectly. The second reason is to see how much cooperation factor is related to the other node families which were created by the interviews of semistructured interviews. Here the most important point is, to take “cooperation” as one of the nodes and to define the mentioned relations. Because, through such a strategy a more objective “cooperation” picture will emerge. At this point, it can be thought about the pieces of a puzzle: Each node families including the “Cooperation” are the parts of the puzzle. When all of these were combined together and the general picture emerged, it is better understood that the place, situation and its relation to other factors/node families of cooperation within this picture. As a result of this, in the general picture composed by the figures and the tables of the result section of Chapter 4, it should be looked at the relations and interesting points of cooperation among the METUTECH firms. In Chapter 3 and 4; defining and evaluating METUTECH and the firms in detail with their sectoral distribution, as Malerba (2009) (Chapter 2, p. 23) also 66 pointed out, I show that a sectoral system perspective is applicable also for METUTECH. R&D and Innovation, support, sectoral diversification and METUTECH infrastructure are also among the main life cells and constituents of METUTECH. The links between these constituents, processes of innovation and growth of the firms, firm cooperation etc. has the characteristics of dynamic links that keep METUTECH sustainable. The nodes that were analyzed in the results section including the cooperation node have the property of being the link between and/or actors of this sectoral system. The results above related to cooperation situation shows that from the perspective of the firms in METUTECH which is the most dynamic working STP of Turkey, analyzing cooperation from just one perspective or from a specific perspective might not be enough. For the 4 sector cluster, as a result of the analysis over node family couples and degree of association results from Table 6 (Chapter 4, p. 63), in the Chapter 4 (Analysis and Results) the conclusion that I reaches is as such: Apart from the sector firms outside of Electronics sector, none of the clusters have a meaningful relationships between Cooperation and the “R&D and Innovation, Support, Sectoral Diversification or METUTECH Infrastructure”. For the firms in the Electronics sector, there are only the meaningful relationships between “Cooperation” and the “Support” and “METUTECH Infrastructure”. I may summarize it as such: The firms in Software & ICT, Design and Other sector firms are evaluated independently from the situation of making cooperation among their own sector and other sector firms in METUTECH. For the firms in the Electronics sector, their cooperation cases were evaluated related to METUTECH infrastructure and support. 67 5.2 Discussions In an STP, the direct or inverse relationships between the R&D and Innovation, Sectoral Diversification, Support and STP Infrastructure and cooperation among the firms have fundamental and vital connections among themselves for an efficient and sustainable functionality of an STP. Nevertheless as a result of my evaluation of the opinions and general perspective of the METUTECH firms, I could not find any meaningful relationship except from the two headings for the Electronics sector. For this reason, I will not be able to define the degree of association results and not-meaningful relationships between the degree of association results in Chapter 4, as “direct or inverse relationship”. As a result of this situation, I perceive the low ratios of cooperation among METUTECH firms to the following: METUTECH firms, no matter which sector they belong to, could not relate the four crucial constituents of METUTECH to the matter of cooperation among themselves enough. In other words, I think METUTECH firms, do not perceive “cooperation among themselves” issue; from the aspects of R&D and innovation, support, sectoral diversification and METUTECH infrastructure strategies. I may say that as a result of the Electronics sector firms’ relating cooperation to, “Support” and “METUTECH Infrastructure”, I can conclude as such: Electronics firms belong to a sector that is a part of the system that needs to have interdisciplinary work with many other sectors. At the same time, it has one of the top positions in the sectoral trends of the world. For these reasons, I believe that the Electronics sector firms, which are active in the biggest and pioneer STP like METUTECH, can draw a roadmap for cooperation, related to these two titles. These firms give importance to two factors especially for 68 increasing their cooperation with other METUTECH firms, due to world trends and interdisciplinary work needs: The “Support” including o Including governmental and institutional financiers within METUTECH structure (Ministry of Science, Industry and Technology, TTGV, TÜBİTAK, KOSGEB, Ministry of EU Affairs, Ankara Development Agency) o External supports/supporters (e.g. governmental policies, foreign investors and funders for private sector, international projects and organizations) Adequacy and efficiency of METUTECH’s infrastructural services (“METUTECH Infrastructure”) Nevertheless, I could not find any result supporting the argument that the Electronics firms in terms of R&D and innovation and sectoral diversification subjects, are related to cooperation aims. Castilla (2003) (Chapter 2, p. 20) had indicated that social relations in social networks were important in defining the concepts like trust, information, action and cooperation. One of the interesting results related to inter-firm cooperation within result and analysis is it is an example to Castilla’s trust and cooperation related ideas. Some firms in Turkey come to METUTECH just to get the high financial institutional support that is given to TDRs (STPs) in Turkey. It can be said that these firms do not have any anxiety or necessity for cooperation other than financial sustainability. At this point, it can be sees that the selection criteria for the firms in METUTECH are important. One of the SMEs that I interviewed had also emphasized this situation as below: 69 Large-scaled firms take young entrepreneur into their own firms and use their ideas for their own interests/benefits and this prevents entrepreneurship mentality and SMEs to develop. Moreover, when it is examined the firms supporting cooperation but perceiving other constituents as unimportant, it can be seen that this situation might be a result of the firm administratives’ trust issues or financial anxieties. For some firms, the judges for the projects are from rival firms, and they might be accused of attempting to unethically evaluate the qualified personnel of each other, the firms that came to METUTECH only to benefit from its trademark value can be the target of this situation or lead to this situation even though they support cooperation. Again, an SME that I interviewed denotes this problem: Some of the judges for examining and controlling the projects can be the executives of rival firms. It is good to be both an owner/executive of a company and an academician at the same time but this rivalry and the situation of being rival can lead to very unpleasant situations. 5.3 Policy Implications SMEs, usually, have the biggest proportions in number within STPs as being in METUTECH. Therefore, it is beneficial to observe some internal and external problems and barriers for this thesis’ “cooperation” matter in Table 5.1 (Estanyol Casals, 2011). In this table, many factors emerge at this point. However, it is not possible to say that every factor in the table is valid for the METUTECH’s SMEs. There are different roles and effects of the reasons emphasized in affecting inter-SME cooperation of today’s METUTECH, too. For this reason, I believe that all of them should be taken into consideration 70 while defining their cooperation strategies among themselves related to the four constituents of METUTECH: R&D and Innovation, Support, Sectoral Diversification and METUTECH Infrastructure. Table 7. Cooperation Factors for SMEs8 Estanyol Casals, F. (2011). The SME Co-operation Framework: A Multi-method Secondary Research Approach to SME Collaboration. 2010 International Conference on E-business, Management and Economics (pp. 122-123). Hong Kong: IACSIT Press. 8 71 In defining these strategies, I believe that all the firms of METUTECH sectors should be participated by the coordination of METUTECH management. Because in the emergence of this detailed study; the opinions, perspectives and perception of the firms have a big effect to shape the matter of “cooperation among firms” within METUTECH’s vision and mission. They can perceive cooperation differently based on their sectors that they are in and this situation are crucial in defining the vision and mission roadmap of METUTECH. In this subject, there are important roles and responsibilities for METUTECH firms. These roles and responsibilities should be emphasized without categorizing it to METUTECH sectors, for all of the METUTECH firms independent of their sectors. Because in my thesis study, these results show that for almost every of these sectors cooperation (discluding the “Support” and “METUTECH Infrastructure” for Electronics sector), is inadequate in relating it to the four constituents of METUTECH. For this reason; independent of their sectors, all METUTECH firms in their goals they should define their perspective and perception for the headings below related to the matter of “cooperation among themselves”: Their R&D and innovation policies within METUTECH The future of sectoral diversification or concentration within METUTECH Adequacy of the financial and non-financial support mechanisms from internal (governmental and institutional supporters) and external ((e.g. governmental policies, foreign investors and funders for private sector, international projects and organizations) sources within METUTECH for themselves. (Except from the firms in the “Electronics” sector which have meaningful relationship) 72 The situations related to METUTECH infrastructure (work conditions, consulting services, physical and social facilities, mentorship, organizations, qualified employee, collaboration with university departments (especially from METU) etc.) and the place of METUTECH Infrastructure in the firms’ own sustainability and development (Except from the Electronics sector firms which have meaningful relations). 73 REFERENCES About TTGV. (2014, January). Retrieved from Technology Development Foundation of Turkey Web site: http://www.ttgv.org.tr Adams, S. B. (2005). Stanford and Silicon Valley: Lessons on Becoming a High-Tech Region. California Management Review, Vol. 48, No. 1, 29-46. Alm, H., & McKelvey, M. (2000). When and Why Does Cooperation Positively or Negatively Affect Innovation? An Exploration into Turbulent Waters. Centre for Research on Innovation and Competition, No. 39. Andersen, A. D., Johnson, B., Reinert, E., Andersen, E. S., & Lundvall, B.-Å. (2009). Institutions, Innovation and Development - Collected Contributions from Workshop. Working Paper Series (Department of Business Studies - Aalborg University), No. 5, 6-18. (2002). Benchmarking of Business Incubators (Final Report). Centre for Strategy & Evaluation Services - European Commission’s Enterprise DG. Bergek, A., & Norrman, C. (2008). Incubator Best Practice: A Framework. Technovation 28, 20-27. Bigliardi, B., Dormio, A. I., Nosella, A., & Petroni, G. (2006). Assessing Science Parks’ Performances: Directions From Selected Italian Case Studies. Technovation 26, No. 4, 489-504. Bostrom, N. (2006). Technological Revolutions: Ethics and Policy in the Dark. In N. Cameron, & M. E. Mitchell, Nanoscale: Issues and Perspectives for the Nano Century (pp. 129‐152). Chicago: Wiley. Castilla, E. J. (2003). Networks of venture capital firms in Silicon Valley. International Journal of Technology Management, Vol. 25, No. 1/2, 113132. Commission, E. (2005). The New SME Definition - User Guide and Model Declaration. Enterprise and Industry Publications. Concept and Definition (Science Policy and Capacity-Building). (2014, January). Retrieved from United Nations Educational, Scientific and Cultural Organization (UNESCO) Web site: http://www.unesco.org 74 Copus, A., Skuras, D., & Tsegenidi, K. (2008). Innovation and Peripherality: An Empirical Comparative Study of SMEs in Six European Union Member Countries. Economic Geography Journal (Clark University), Vol. 84, No. 1, 51-77. Çakar, S. Ö. (2012). ABD Üniversite Teknoparkları İnceleme Çalışması - Türkiye için Gözlem ve Öneriler. Ankara: Technology Development Foundation of Turkey. Çakır, S. (2009). Teknoloji Politikası Aracı Olarak Teknoparklar ve Ekonomik Etkileri: Türkiye Örneği ve ODTÜ Teknokent Deneyimi. M.Sc. thesis: Marmara University. İstanbul. Çelik, M. (2011). Şirketlerin İnovasyon Yapma Eğilimlerinde Üniversite-Sanayi İşbirliğinin Rolü ve ODTÜ Teknokent Örneği. M.Sc. thesis: Marmara University. İstanbul. Çilingir, C., Şentürk, H., & Kudak, H. (2011). Ankara İlinndeki Üniversite Teknoparklarının Analizi. International Higher Education Congress: New Trends and Issues, (Vol. 3, No. 15, 2154-2162). İstanbul. Eryılmaz, Y. S. (2006). Mixed Networks in Building Innovative Capability in Developing Economies: The Turkish Case. Ph.D. thesis: University of Pittsburgh. Pennsylvania. Estanyol Casals, F. (2011). The SME Co-operation Framework: A Multi-method Secondary Research Approach to SME Collaboration. 2010 International Conference on E-business, Management and Economics (pp. 118-123). Hong Kong: IACSIT Press. (2002). Frascati Manual (6th edition). Paris: Organisation for Economic Cooperation and Development (OECD). Grotz, R., & Braun, B. (1993). Networks, Milieux and Individual Firm Strategies: Empirical Evidence of an Innovative SME Environment. Wiley-Blackwell, Vol. 75, No. 3, 149-160. Guy, E. K. (1996). The Science Park Evaluation Handbook. Brighton: Technopolis. Hancock, R., & Carson, E. D. (2012). Index of Silicon Valley. California: Joint Venture - Silicon Valley Network / Silicon Valley Community Foundation. Hausmann, R., & Rodrik, D. (2003). Economic Development as Self-Discovery. NBER Working Papers, Vol. 72, No. 2, 603–633. Hewitt-Dundas, N., & Roper, S. (2011). Creating Advantage in Peripheral Regions: The Role of Publicly Funded R&D Centres. Research Policy 40, 832-840. 75 History of Stanford (The Rise of Silicon Valley). (2014, January). Retrieved from Stanford University Web site: http://www.stanford.edu Lamoreaux, N. R., Levenstein, M., & Sokoloff, K. L. (2007). Do Innovative Regions Inevitably Decline? Lessons from Cleveland’s Experience in the 1920s. Business and Economic History, Vol. 5. Lamoreaux, N., & Levenstein, M. (2008). The Decline of an Innovative Region: Cleveland, Ohio, in the Twentieth Century. Annual Meeting of the Economic History Association. Connecticut. Lawson, C. (1997). Territorial Clustering and High-Technology Innovation: From Industrial Districts to Innovative Milieux. ESRC Centre for Business Research, No. 54. Leichteris, E. (2009). Science and Technology Parks as Knowledge Organizations in Holistic Innovation System. Management of Organizations: Systematic Research, No. 51, 59-61. Löfsten, H., & Lindelöf, P. (2001). Science Parks and the Growth of New Technology-based Firms-Academic-Industry Links, Innovation and Markets. Research Policy 31, 859-874. Malerba, F. (2002). Sectoral Systems of Innovation and Production. Research Policy 31, 247–262. Malerba, F. (2009). Sectoral systems, Economic Development and Catching-up. Crecimiento Económico y Desarrollo En America Latina. Mexico City. Malerba, F., & Mani, S. (2009). Sectoral System of Innovation and Production in Developing Countries. Massachusetts: Edward Elgar Publishing. Management, M. T. (2013). General Briefing. Ankara: METU Technopolis Management. McAdam, M., & McAdam, R. (2008). High Tech Start-ups in University Science Park Incubators: The Relationship between the Start-up’s Lifecycle Progression and Use of the Incubator's Resources. Technovation 28, 277288. (2011). METU Strategic Plan 2011-2016. Ankara: METU. Ministry of Science, I. a. (2001). Law of the Technology Development Regions No. 4691. Official Gazette (Turkey). Ministry of Science, I. a. (2002). Technology Development Zones Application Regulation. Ankara: Official Gazette (Turkey). Ministry of Science, I. a. (2008). Law on Supporting Research and Development Activities No. 5746. Official Gazette (Turkey). 76 (2012). Ministry of Science, Industry and Technology (Turkey) - Strategic Plan 20132017. Ankara: Ministry of Science, Industry and Technology (Turkey). (2010). National Science, Technology and Innovation Strategy 2011-2016. Ankara: The Scientific and Technological Research Council of Turkey (TÜBİTAK). (2005). OSLO Manual (3rd edition). Paris: Organisation for Economic Cooperation and Development (OECD). Özdemir, S., Ersöz, H. Y., & Sarıoğlu, H. İ. (2007). Küçük Girişimciliğin Artan Önemi ve KOBİ'lerin Türkiye Ekonomisindeki Yeri. Journal of Social Policy Conferences (İstanbul University), No. 53, 210. Pa´lmai, Z. (2004). An Innovation Park in Hungary: INNOTECH of the Budapest University of Technology and Economics. Technovation 24, 421-432. Pekol, Ö., & Erbaş, B. Ç. (2011). Technoparks in Turkey: Patent System Perspective. Ege Academic Review, Vol. 11, No. 1, 39-58. Pitelis, C., & Pseiridis, A. (2007). A Conceptual Framework for Firm Co-operation and Clusters and Their Impact on Productivity and Competitiveness. Dynamic Regions in a Knowledge-Driven Global Economy (DYNREG), No. 13. Quintas, P., Wield, D., & Massey, D. (1992). Academic-Industry Links and Innovation: Questioning the Science Park Model. Technovation, Vol. 12, No. 3, 161-173. Radosevic, S., & Myrzakhmet, M. (2009). Between Vision and Reality: Promoting Innovation through Technoparks in an Emerging Economy. Technovation 29, 645–655. Ratinho, T., & Henriques, E. (2010). The Role of Science Parks and Business Incubators in Converging Countries: Evidence from Portugal. Technovation 30, 278-288. (2009). Research and Analysis Report. Presidency of the Republic of Turkey State Supervisory Council. Rothaermel, F. T., & Thursby, M. (2005). Incubator Firm Failure or Graduation? The Role of University Linkages. Research Policy 34, 1076-1089. Sanz, L., & Monasterio, L. (2012). IASP General Survey. Málaga. Schwartz, M., & Hornych, C. (2010). Cooperation Patterns of Incubator Firms and the Impact of Incubator Specialization: Empirical Evidence from Germany. Technovation 30, 485-493. 77 Scott, J. T., & Link, A. (2003). The Growth of Research Triangle Park. Small Business Economics, Vol. 20, 167-175. Šmihula, D. (2010). Waves of Technological Innovations and the End of the Information Revolution. Journal of Economics and International Finance, Vol. 2 (4), 58-66. Sternberg, R., & Arndt, O. (2001). The Firm or the Region: What Determines the Innovation Behavior of European Firms? Economic Geography Journal (Clark University), Vol. 77, No. 4, 364-382. The Entrepreneurial and Innovative University Index 2013. (2014, January). Retrieved from The Scientific and Technological Research Council of Turkey (TÜBİTAK) Web site: http://www.tubitak.gov.tr Theme (Conference). (2014, January). Retrieved from International Association of Science Parks (IASP) - 29th World Conference in Tallinn 2012 Web site: http://www.iasp2012tln.com. Vučić, I. (2009). Cooperation and Cluster Strategies within and between TechnologyIntensive Organizations: How to Enhance Linkages among Firms in the Techno-Parks. M.Sc. thesis: Middle East Technical University. Ankara. Westfall, L. (2010). The Certified Software Quality Engineer Handbook. Wisconsin: Quality Press. Yaşar, S. S. (2010). Knowledge Networks and Cognitive Communities in Clusters: The Case of ICT Cluster of METU Technopolis and Agricultural Tools and Machinery Cluster of Konya. Ph.D. thesis: Middle East Technical University. Ankara. Yıldız, B., Ilgaz, H., & Seferoğlu, S. (2010). Türkiye’de Bilim ve Teknoloji Politikaları: 1963'ten 2013'e Kalkınma Planlarına Genel Bir Bakış. Academic Computing Conferences, (458-461). Muğla. Zaheer, A., & Bell, G. G. (2005). Benefiting from Network Position: Firm Capabilities, Structural Holes, and Performance. Strategic Management Journal, Vol. 26, No. 9, 809-823. 78 APPENDICES A. FIRM EVALUATION FORM Part 1: Based on Quantitative Information Establishment date of the firm / its sub-department within METUTECH Number of the firm’s / its sub-department’s employees within METUTECH Annual income of the firm / its sub-department within METUTECH Number of the firm’s / its sub-department’s finished project / product within METUTECH Number of the firm’s / its sub-department’s patent and/or utility model within METUTECH Collaboration with university departments and academicians within METUTECH o Number of the academicians collaborated, their titles, their universities (especially including METU) and their positions within the firm / its sub-department (if they have) o Number of the university departments collaborated, their disciplines/research fields and universities (especially including METU) 79 Part 2: Based on Qualitative Information “Support”: Institutional supporters and support types (financial and non-financial) of the firm / its sub-department within METUTECH (Especially from the supporters below) o Technology Development Foundation of Turkey (TTGV) o The Scientific and Technological Research Council of Turkey (TÜBİTAK) o Small and Medium Enterprises Development Organization (KOSGEB) o Industrial Thesis Supporting Program (SANTEZ) o Techno-entrepreneurship Funding Programme o Ankara Development Agency o Ministry for EU Affairs Support types of METUTECH for the firm / its sub-department (Especially the non-financial support types below) o Consultancy / Mentorship o Participation to conference / exposition / workshop / platform o Publicity of the firm/ product/ project o Start-up support for young entrepreneur (e.g. Animation Technologies and Game Development Centre (ATOM), TeknoJumpp) o “Defence Industry Cluster” (Especially for the firms in “Defence Industry”) o Collaboration & Cooperation organizations among METUTECH firms o Social and cultural organizations 80 “METUTECH Infrastructure”: Why did the firm prefer METUTECH in the establishment of its main / sub- department? Which factors does the firm evaluate METUTECH as being positive and/or negative? “R&D and Innovation”: Does the firm have a “R&D and Innovation policy” or not? How does the firm evaluate them from its own perception and perspective? “Sectoral Diversification”: How does the firm evaluate “Sectoral Diversification” for the future of METUTECH? Does the firm think that if a “sectoral diversification-based” or “sectoral concentration-based” policy adoption is more beneficial within the vision and mission of METUTECH and its roadmap? “Cooperation”: Does the firm support cooperation and cooperate with the other sector firms (in its own sector and other sectors) within METUTECH? Which reasons does the firm relate the matter of “cooperation among METUTECH firms (in sectors)” as positive and/or negative? 81 B. DEGREE OF ASSOCIATION Part 1: Direct and Inverse Relationships between Node Families Table 8. Numbers of Direct and Inverse Relationships between Node Families + + - - + - - + DR DR IR IR Soft. & ICT 15 1 10 2 Electronics 5 0 0 1 Design 2 0 2 0 Other 6 0 5 1 Soft. & ICT 13 8 9 11 Electronics 4 0 0 1 Design 2 2 2 2 Other 6 5 5 5 Soft. & ICT 10 10 8 14 Electronics 3 0 0 5 Design 0 0 0 1 Other 3 5 3 4 Soft. & ICT 15 11 11 15 Electronics 5 0 0 3 Design 2 2 2 2 Other 6 5 5 6 R&D and Innovation vs. Cooperation Sectoral Diversification vs. Cooperation Support vs. Cooperation METUTECH Inf. vs. Cooperation 82 Part 2: Contingency Tables & Chi-square Tests and Rules Table 9. “R&D and Innovation vs. Coop.” Results for Soft. & ICT Cluster Table 10. “Support vs. Coop.” Results for Soft. & ICT Cluster 83 Table 11. “Sectoral Diversification vs. Coop.” Results for Soft. & ICT Cluster Table 12. “METUTECH Inf. vs. Coop.” Results for Soft. & ICT Cluster 84 Table 13. “R&D and Innovation vs. Coop.” Results for Electronics Cluster Table 14. “Support vs. Coop.” Results for Electronics Cluster 85 Table 15. “Sectoral Diversification vs. Coop.” Results for Electronics Cluster Table 16. “METUTECH Inf. vs. Cooperation” Results for Electronics Cluster 86 Table 17. “R&D and Innovation vs. Coop.” Results for Design Cluster Table 18. “Support vs. Coop.” Results for Design Cluster 87 Table 19. “Sectoral Diversification vs. Coop.” Results for Design Cluster Table 20. “METUTECH Inf. vs. Coop.” Results for Design Cluster 88 Table 21. “R&D and Innovation vs. Coop.” Results for Other Cluster Table 22. “Support vs. Coop.” Results for Other Cluster 89 Table 23. “Sectoral Diversification vs. Coop.” Results for Other Cluster Table 24. “METUTECH Inf. vs. Cooperation” Results for Other Cluster 90 The Rules for Evaluating Chi-square Test Results 1) The case which is written under the contingency tables as “X cells (Y%) have expected count less than 5” is examined as a result of Chi-square tests. Here the value 5 represents “frequency”. In my study my frequency value is the total number of firms making a simultaneous/coexisting reference to direct or inverse relationships (positive/negative situations) to the relevant node-family couple. (The numbers in Table 3.5). 2) For the “X cells (Y%) have expected count less than 5” situation , if the percentage of Y (Y%) is; a. If Y% < 20%, then we should look at the probability value on “Pearson Chi-Square”. b. If Y% > 20%, then “the minimum expected count (Z)” should be looked. This value, i. If Z < 5, then we should look at the probability value in “Fisher’s Exact Test”. ii. If 5 ≤ Z < 25, then we should look at the probability value in “Continuity Correction” value. iii. If Z ≥ 25, then we should look at the probability value in “Pearson Chi-Square” value. c. For the probability value (p) of the related situations, i. If p < 0, 05; then we can mention about a meaningful degree of association for “H-alternative”. In other words, there is a meaningful degree of association between the node family couples in terms of interviewed firms’ opinions and general perspective. 91 ii. If p > 0, 05, then we cannot accept “H-alternative” and we cannot mention about a meaningful degree of association, and we should accept “H-zero” in this case. In other words, there is not a meaningful degree of association between the interviewed firms’ opinions and general perspective of the node family couples. 92 C. TURKISH SUMMARY Bugün, birçok ülkenin bilim ve teknoloji politikaları kapsamında odak stratejilerinden birini oluşturan ve ODTÜ Teknokent’in de dahil olduğu “Bilim ve Teknoloji Parkları (BTP’ler)” nın ana amacı, akademik bilginin, üniversite-sanayi işbirliği ile ekonomik, endüstriyel ve ticari yönlerden fayda sağlayacak şekilde yönetilmesidir. İlk defa 2. Dünya Savaşı’ndan sonra Stanford Üniversitesi bünyesinde tohumları atılan Silikon Vadisi, dünya genelindeki BTP’lerin ilk ciddi ve büyük adımı olmuştur. Bünyesinde, bugünün birçok dünya markasının genellikle tek bir kişi veya küçük bir grubun girişimci fikirleri ve gelecek hedefleri doğrultusunda geliştiğini gördüğümüz Silikon Vadisi; bu fikir ve hedeflere verdiği desteklerin niteliği ve politika stratejileri ile dünyadaki birçok BTP’nin kurulumuna örnek teşkil edecek bir başlangıç yapmıştır. Elbette Silikon Vadisi’nin bu öncülüğü bir yana, birçok ülkenin bilimsel ve akademik altyapısı, siyasi ve ekonomik vizyonu-misyonu ve destek mekanizmaları, ülkelerin sınırları içinden ve dışından kaynaklı birçok etmen ile şekillenmektedir. Bu durumdan ülkelerin BTP’ler yönünden politika anlayışları da etkilenmektedir. Bölgesel, ulusal ve hatta uluslararası boyutlardaki BTP’lerin kuruluşu ve bu BTP’ler için belirlenen büyüme ve kalkınma hedefleri, bu politika anlayışlarının bir sonucu olarak, her ülke için farklı şekilde ortaya çıkabilmektedir. Böylece her ülke ve hatta her bölge için birçok farklı BTP çeşidinden söz edilebilir. Bazen bir ülkenin uluslarası rekabeti ve işbirliği başarısına katkıda bulunması amacıyla, bazen de bir ülkenin sadece belli bir bölgesindeki ekonomik büyüme ve kalkınmayı destekleyecek bir amaca hizmet etmesi amacıyla BTP’ler kurulabilmektedir. 93 Günümüzde, düşük bütçeli KOBİ’lerden büyük çaplı şirketlerin AraştırmaGeliştirme veya diğer alt birimlerine kadar birçok kuruluşa ev sahipliği yapan birçok BTP çeşidi, girişimci ve yenilikçi fikirlerin, ekonomik ve ticari kazanca dönüşecek şekilde uygulanabilir hale getirilmesi sürecinde etkili mekanizmalardır. Bu mekanizmaların etkili çalışabilmesi içinse birçok sosyal aktör önemli roller üstlenir (özellikle firmalar, üniversiteler ve devlet kurumları). Ayrıca bu sosyal aktörler arasındaki örgütlenmenin ve bağlantıların gücü ve kalitesi, BTP’lerin sürdürülebilir ve verimli bir işleyişe sahip olmaları için de kritik bir öneme sahiptir. Bu durumu sağlayan en önemli faktörlerden biri de BTP’ler arasındaki sosyal aktörler arasında yeterli düzeyde bir işbirliğinin olmasıdır. Bilgi yönetimi ve transferinin, yoğun bir işleyiş ve döngü halinde gerçekleştiği en önemli organizasyonlardan biri niteliğinde olan BTP’ler, aslında bilginin hareket halinde olduğu noktaların (sosyal aktörler) arasındaki koordinasyonu, uyumu ve işbirliğini sağlamak konusunda da önemli görevler üstenmektedir. Diğer bir deyişle BTP’ler, birer ağ çatısı niteliğinde de olan ve bünyelerindeki ağ yapılanmasının etkin bir işlerliğe sahip olması için de ağın her noktası arasında yeterli düzeyde bir işlerlik sağlamakla sorumlu organizasyonlardır. BTPler bünyesindeki sosyal aktörler arasında işbirliğinin sağlanması, kuşkusuz birçok açıdan ele alınabilir. Bu çalışmanın odağını da oluşturmakta baz alınan işbirliği konusu ise, “bir BTP’nin bünyesindeki firmaların kendi aralarındaki işbirliği”dir. Firmaları arasındaki sürdürülebilirlik işbirliği başarısı konusu, açısından aslında “yapıtaşı” yine bir niteliğinde BTP’nin olduğunu düşündüğüm dört faktör ile bağlantılıdır: “Araştırma & Geliştirme (AR & GE) ve İnovasyon”, “Destek”, “Sektörel Zenginleşme” ve “BTP Altyapısı”. Bu yapıtaşlarının her birinin, bir firmanın, aynı BTP içindeki bir başka firma ile işbirliğine yönelimini etkilediğini düşünmekteyim. Her birinin bu etkiyi nasıl gerçekleştirdiğini inceleyelim: 94 “AR&GE ve İnovasyon”, bir firmanın vizyon ve misyon politikalarında bulunması açısından olmazsa olmaz bir bütünleşik kavram olarak ortaya çıkmaktadır. Bugün birçok firmanın AR & GE ve inovasyon politikası resmen belirlenmiş iken; birçoğunda bu tanımlar sadece formalite yönünden söylenen cümleler olarak kalabilmektedir. Bu durumun nedeni ticari kaygılar, hayatta kalabilme ve sürdürülebilir olabilmek endişesi veya sadece mali kazanç elde etme çabasında olabilmek gibi birçok nedene dayandırılabilir. Fakat bu nedenler her ne olursa olsun, özellikle bir BTP bünyesindeki firmanın AR & GE ve inovasyon kavramlarından uzak kalması düşünülemez. Bugün, birçok yenilikçi fikrin, zamana karşı bir yarış ve rekabetle, hem bilimsel hem de ticari yönden büyük avantajlar sağlayabilecek hale getirilebilmesi; bir BTP firmasının da bu iki kavramı benimsemiş bir işlevselliğe sahip olması gerekliliğini getirmektedir. Öte yandan yine bugün, birçok proje ve ürün sonuçlandırma süreci, firmaların kendi sınırlarından çıkarak ulusal ve hatta uluslararası boyutlara çıkacak bir noktaya gelmiştir. Bu yüzden firmalar arası işbirliği konusu, gerek firmaların mensubu olduğu ülke ve bölgeler, gerekse uluslarası çapta ortaklıklar ile kaçınılmaz bir noktaya ulaşmıştır. Bu noktada en önemli sorumluluklardan birini üstlenen BTP’lerin firmaları arasındaki işbirliği durumu ise bu kaçınılmaz noktaya katkı sağlayan en önemli desteklerden biri niteliğindedir. Bu nedenlerle, artık küreselleşme konusunda ciddi boyutlara ulaşmış bir dünyanın içinde, AR & GE ve inovasyonu, çalışmalarının ve performanslarının bir belirleyicisi olarak benimsemiş/benimsememiş BTP firmaları, bu duruma paralel şekilde işbirlikleri yönünden de açılabilmekte veya kapanabilmektedir. “Destek”, bir BTP için de firmaları içinde “yaşam damarı” niteliğinde olan bir yapıtaşıdır. Bu damarın kopması, sadece bir firma için değil, tüm BTP için de hayatta kalma durumunun sonlanması anlamına gelmektedir. Elbette buradaki “destek”ten kasıt, hem iç hem dış kaynaklardan olabilen desteklerin 95 tamamını kapsamaktadır. BTP’ler aracılığı ile firmalar; devlet kurumlarından, çeşitli yatırımcılardan (yine devlet veya özel), ulusal ve uluslararası organizasyonlardan ve bunun gibi birçok kaynaktan özellikle finansal destek alabilmektedir. Bunun yanında BTP’lerin de özellikle genç girişimcilere verdiği, giriş düzeyi ufak mali destekler olabilmektedir. Destek kategorisi içinde, finansal olduğu kadar finansal olmayan, diğer bir deyişle niteliksel destekler de olabilmektedir. Özellikle bu tür niteliksel destekleri, BTP’lerin yönetimi ve kendi organizasyonel yapıları sağlamaktadır: Danışmanlık, eğitim, reklam, tanıtım, fuar-kongre-çalıştay-organizasyon katılımları gibi destekler bu gruba girmektedir. Elbette bu destekleri sadece bir BTP’nin kendisi değil, çeşitli devlet ve vakıf kuruluşları da sağlayabilmektedir. Tüm bu destekler, hem BTP’lerin hem de firmalarının yine sürdürülebilirliği ve verimliliği açısından büyük öneme sahiptir. BTP firmaları, desteklerin temin edildiği kaynakların yeterliliğine veya bu kaynakların koşullarına bağlı olarak da birbirleri arasında işbirliğine açılabilmekte veya kapanabilmektedir. Yani destek stratejileri, firmaların işbirliğine olan yönelimlerini doğrudan etkileyebilmektedir. “Sektörel Zenginleşme”nin de BTP firmaları arasındaki işbirliğine katkısı büyüktür. Özellikle firmalar, ülkelerinin endüstriyel hedefleri ve ekonomik beklentileri doğrultusunda yoğun oranda destekledikleri sektörlerden, iradeleri dışında etkilenebilmektedir. Bir başka yönden, dünya trendlerindeki gelişen belli başlı sektörlerin (yazılım, bilgi & iletişim teknolojileri, savunma teknolojileri, elektronik gibi) firmalar için hayatta kalabilme ve sürdürülebilir olabilme kolaylığı açısından da sunduğu imkanlar, firmaların bu tür sektörlere yöneliminde etkili olabilmektedir. Bununla beraber bazı firmalar, idealist hedefleri doğrultusunda, dünyada ortaya çıkışı daha eskilere dayansa da ekonomik yönlerden yeni gelişmekte olan ve hatta kendi ülkelerinin koşullarına göre yeterli bir ticari bir kazanç getirmesi mümkün gözükmeyen 96 sektörlere de yönelebilmektedirler (örneğin nanoteknoloji). Ek olarak bu sektörlerin, firmaların tercihleri doğrultusunda üzerlerine yüklediği fazladan altyapı gerekliliği (teçhizat, ekipman, laboratuvar vs.) ve çalışma koşulları da ortaya çıkabilmektedir. Tüm bu durumlara rağmen, bugün disiplinlerarası çalışma mantığını gerektiren birçok araştırma ve uygulama alanı ortaya çıkmıştır ve hızla çıkmaya devam etmektedir. Bu durum, aynı sektörün içinde olduğu kadar sektörler arasındaki firmaların da birbirleri arasında işbirliği yapma gerekliliğine ortaya çıkarmaktadır. Özellikle birçok disiplinin, üniversite ve akademik altyapı ile şekillendiği ve hatta içiçe geçerek ekonomik ve endüstriyel uygulamalara uyarlandığı BTP’lerin, sektörel olarak zenginleşmesine veya daralmasına bağlı olarak izlenecek politikaların, BTP firmaları arasındaki işbirliklerinin düzeyini de etkilediği beklenen bir gerçektir. “BTP Altyapısı”, BTP firmaları arası işbirliğini olduğu kadar yukarıda anlatılan üç faktörün de BTP dahilindeki yönelimlerini ve yeterliliklerini belirleyen bir yapıtaşıdır. Fiziki, idari, koordinasyonel ve sosyal açıdan sağlam bir altyapıya sahip BTP, yukarıda anlatılan diğer üç yapıtaşı ile ilgili belirlenen politikalar veya yapılan çalışmalar, hizmetler vs. yönünden de güçlü olacaktır. Böylece; AR & GE ve inovasyon anlayışını bünyesine dahil edip uygulamaya geçirebilmiş firmaların BTP bünyesine seçilme kriterleri, bu firmalara sağlanan / koordinasyonu yapılan yeterli düzeyde destekler ve yeni gelişmekte olan fakat geleceği ekonomik-endüstriyel-ticari başarılar yönünden açık sektörlerin de BTP bünyesinde sektörel zenginleşme politikaları ile dahil edilmesi katkılarının tümü; aslında güçlü bir BTP altyapısının ürünüdür. Bu nedenle bu altyapı da diğer üç yapıtaşı gibin doğrudan BTP firmaları arasındaki işbirliğine eğilimi etkileyen bir yapıtaşı rolü üstlenmektedir. 97 Yukarıda anlatılan dört yapıtaşının, BTP firmaları arasındaki işbirliğine etkisinin incelenmesi için ele alınan örnek BTP, Türkiye’nin başkenti Ankara sınırları dahilindeki ODTÜ Teknokent’tir. Neden bu teknokentin, çalışmanın dahilinde seçildiğini anlamak için, Türkiye’de BTP’lerin tarihine bakmak faydalı olacaktır. Dünyada BTP’lerin ortaya çıkışının miladı olarak kabul edilen Silikon Vadisi’nden çok daha uzun bir zaman sonra, Türkiye’deki BTP oluşumları ve kültürü kendini göstermeye başlamıştır. BTP’ler, Türkiye’de farklı isimlerle nitelendirilmektedir (“teknopark”, “araştırma merkezi”, “kuluçka merkezi” gibi); fakat ülke genelinde aldıkları bu sıfatlar ve nitelendirmeler yanında tümünün altında bulunduğu bugünkü genel başlık “Teknoloji Geliştirme Bölgesi (TGB)”dir. Buradaki dikkat çekici nokta ise bu başlığın kullanılmasından çok daha önce Türkiye’de BTP yapılanmasının ortaya çıkmasıdır. Burada, bu tezin odak noktasında da olan ve ülke genelinde bir “teknopark” olarak anılan ODTÜ Teknokent, TÜBİTAK Marmara Araştırma Merkezi ile birlikte, Türkiye’nin ilk BTP’leri olarak nitelendirilebilecek yerler olduğunu vurgulamak önemlidir. Bugün, Türkiye’nin BTP’leri olarak niteleyebileceğimiz TGB’leri ile ilgili resmi politika belirleme ve yasallaştırma çalışmaları 2000li yılların başlarında başlamıştır. Fakat bu konudaki fiili atılımı, 70’li yılların başlarında faaliyete geçen TÜBİTAK Marmara Araştırma Merkezi ve Orta Doğu Teknik Üniversitesi’nde yapılan çalışmalar ile 80’lerin sonunda temelleri atılan ODTÜ Teknokent yapmıştır. Diğer bir deyişle, Türkiye’nin bu konuda yasallaştırma çalışmalarının başlamasından çok daha önce BTP mentalitesini ülke genelinde hayata geçirmek için girişimler başlamıştır. Bu girişimler, kuruldukları yıllarda yasal düzenlemelerin yetersizliğinden kaynaklı olarak birer “teknopark” ya da başka bir deyişle “BTP” olarak anılmamışlardır. Yine de her ikisi de işleyiş olarak, özellikle üniversitelerin ve yükse öğrenim 98 kurumlarının katkısı ile elde edilen bilimsel bilgiyi, AR&GE süreciyle işleyerek endüstriyel kazanca, ekonomik ve ticari katkıya dönüştürmeleri yönünde faaliyet göstermiş ilk ciddi organizasyonlardır. 1998 yılında her iki organizasyonun da resmi olarak Türkiye’nin ilk “BTP”leri (ülke deyişiyle “teknopark”ları) olarak kabul edilmesi ise, artık BTP oluşumlarının Türkiye’de resmiyet kazanması, politikalarının belirlenmesi, yasal ve hukuki yönden kabul görmeleri açısından en önemli adımlardan biri olmuştur. 1990 yılında, dünyadaki ekonomik trendlerin ve bilimsel ve teknolojik gelişmelerin belirlenmesinde artık önemli bir noktaya gelmiş KOBİ’lerin birçok açıdan desteklenebilmeleri için T.R. Ministry of Science, Industry and Technology çatısı altında “Küçük ve Orta Ölçekli İşletmeleri Geliştirme ve Destekleme İdaresi Başkanlığı (KOSGEB)” kurulmuştur. KOSGEB’in KOBİ’leri bu şekilde desteklemeye başlaması, artık TGB’lerin yasallaşması ve bünyesi dahilinde KOB ve networki kümelenmesi ve ağ yapılanması süreçlerinin oluşması için çok önemli girişimlerden birini oluşturmuştur. Bu girişimin göstergelerini de şöyle görmek mümkündür: KOBİ, kuruluş tarihinden 10 sene sonrasına kadar resmi tanınırlıkları ülke genelinde oturmaya başlayan TGB’lerde, kendi “Teknoloji Geliştirme Merkez”lerini açmıştır. Bu merkezler, KOSGEB’den destek alan KOBİ’ler için bir kuluçka merkezi de olma özelliği taşımaktadır. KOSGEB, bu merkezler aracılığıyla, özellikle bünyesindeki KOBİ’leri birçok açıdan (finansal, teçhizat-ekipman, laboratuvar, danışmanlık, fuar-kongre katılım, ürün tanıtım vs.), desteklemiştir. Bu destekler de hem bünyesindeki KOBİ’ler ve onların kümelenmesi hem de bulundukları TGB’ler için katmadeğer sağlamıştır. Türkiye’de Cumhuriyet’in kabulü sonrası yeniden şekillenen devlet yapısının “Kalkınma Planları”, bilim ve teknoloji politika planlamalarını oldukça uzun bir zamandan sonra içermeye başlamıştır. Bu nedenle BTP’lerin veya 99 Türkiye’de daha çok kullanıldığı şekliyle TGB’lerin, bu “Kalkınma Planları” bünyesinde resmi olarak tam bir yere sahip olmadıkları görülebilir. Aslında 1996 yılında, o zamanın “Sanayi ve Ticaret Bakanlığı”, bugünün ise “Bilim, Sanayi ve Teknoloji Bakanlığı” teknoparklar üzerine bir yönetmelik yayınlamıştır. Fakat asıl köklü başlangıç, 2000’lerin başında atılan adımla gelmiştir. 2001 yılında, 21.yüzyıla da girilmesi ile şu iki ihtiyaç ve gereklilik ülke genelinde oldukça hissedilir düzeye gelmişti: Dünya genelinde oldukça gelişmiş bir noktaya gelmeye ve yaygınlaşmaya başlamış university-industry collaboration linkage larının kurulup geliştirildiği STP trendinden daha fazla geri kalmama Halihazırda ülke genelinde yasal ve hukuki yönleri tam olarak resmi yönlerden tanımlanamamış tecnoparks (METU Technopolis and TÜBİTAK Marmara Research Center için) için bu sorunu çözmek ve yeni kurulacak/kurulması hedeflenen oluşumların önünü açma Bu doğrultuda 2011 yılında “Teknoloji Geliştirme Bölgeleri Kanunu (No. 4691)” çıkarılmıştır. Bu kanunla, dünyadaki BTP çeşitlerini içeren tüm oluşum ve organizasyonlar, Türkiye genelinde bir “teknoloji geliştirme bölgeleri (TGB’ler)” başlığı altında toplanmıştır. Bu kanun üzerine zamanla çeşitli düzenlemeler, eklemeler ve değişiklikler yapılmış veya çıkarılan başka yönetmelikler, kanunlar vs. ile (“Teknoloji Geliştirme Bölgeleri Uygulama Yönetmeliği (2002)”, “Araştırma ve Geliştirme Faaliyetlerinin Desteklenmesi Hakkında Kanun (No. 5746 / 2008)”, “Araştırma ve İnceleme Raporus (T.C. Cumhurbaşkanlığı : Devlet Denetleme Kurulu, 2009/1)” gibi) ilişkilendirilmesi ve desteklenmesi süreçleri gerçekleştirilmiştir. Temelde 4691 sayılı kanun ise, 100 Türkiye’de BTP’lerin resmiyetlerini tam anlamıyla kazanmalarının ve kuruluşlarında önlerinin açılmasının ilk ciddi çalışması olmuştur. 2013 yılı Ocak ayı itibariyle, 4691 nolu kanunun çıkışı sonrasında hızla artan sayıları da baz alınarak, Türkiye genelinde faal olarak işleyen 34 ve henüz kuruluş aşamasında olan 15 adet olmak üzere toplamda 49 adet Teknoloji Geliştirme Bölgesi vardır . Bu kanunun yürürlüğe girmesi ile ülkenin belli başlı strateji dökümanları ve eylem planları dahilinde de artık TGB’ler yerlerini almaya başlamıştır. Bugün örneğin Bilim, Sanayi ve Teknoloji Bakanlığı’nın 2013-2017 yılı Stratejik Plan’ında aşağıdaki konulara değinilmektedir: Türkiye’deki technology development regionsın sayılarının arttırılması ve altyapılarının tamamlanması/güçlendirilmesi TDRlerin bünyelerinde “Technology Transfer Office”ler kurulması ve bu konuda farkındalık düzeyinin artırılmasına dair destek verilmesi, Uluslararası kuruluşlardan sağlanan bilgi ve deneyimlerin ülkeye aktarımı, TDRlerin öncelikli alanlar doğrultusunda uzmanlaşmalarına özendirilmeleri, Çeşitli kurumsal destek programları konusunda bu regionların bilgilendirilmesi ve desteklenmesi Bir başka örnek olarak Ulusal Bilim, Teknoloji ve Yenilik Stratejisi (2011-2016) – 2013 Eylem Planı’nda, aşağıdaki maddeler çerçevesinde, işbirliği yapılacak kuruluşların arasında teknoparkların da bulunduğu belirtilmektedir: “Teknoloji transfer süreçlerinin finansmanına yönelik modellerin incelenmesi ve geliştirilmesi 101 “Araştırmacı, akademisyen ve AR-GE çalışanlarına yönelik patent eğitim programlarının oluşturulması ve uygulanması” “Araştırma sonuçlarının ticarileştirilmesini teşvik etmek için ön kuluçka modellerinin geliştirilmesi” “KOSGEB, üniversiteler, Sanayi/Ticaret ve/veya Sanayi ve Ticaret Odaları, teknoparklar, araştırma enstitüleri, enstitüler gibi devlet/özel kurumları/kuruluşları ile Teknoloji Geliştirme Merkezleri’nin kurulması veya AR&GE ve inovasyon alanında işbirliği yapılması” Türkiye’de TBG’ler, üniversitelerin ve yüksek öğrenim kurumlarının başarı kriter saptamalarında da “üniversite-sanayi işbirliği” ve “TGB’lerle olan ilişkiler” başlıklarına sağladıkları katkılarda da kritik bir öneme sahiptir. TÜBİTAK’ın öncülüğünde hazırlanan “Girişimci ve Yenilikçi Üniversite Endeksi”, bu durumun somut bir sonucudur. Üniversiteler ve yüksek öğrenim kurumlarının bu endekste yüksek puan alma başarısı gösterebilmeleri için, endeksin başarı kriter oranları içinde 65%lik oran, üniversite-sanayi işbirliği ve TGB’lerle olan bağlantılara ayrılmıştır. Bu oranın toplamını oluşturan bu işbirliği ve bağlantılar ile ilişkili olan 3 alt başlık şunlardır: 25% oran “İşbirliği ve Etkileşim”de, 15% oran “Girişimcilik ve Yenilikçilik Kültürü”nde ve 25% oran “Ekonomik Katkı ve Ticarileşme”dedir. ODTÜ Teknokent, Türkiye’nin doğrudan bir üniversite yerleşkesinde kurulan ve üniversite-sanayi işbirliği sağlayabilmesi adına aracılık vizyonu ve misyonu ederek faaliyete geçen ilk BTP/teknopark’tır. Kuruluş adımları, fiilen 80li yıllar içindeki çalışmalarla atılsa da 4691 No.lu Teknoloji Geliştirme Bölgeleri Kanunu’nun yürürlüğe girmesi ile resmiyeti tanınmıştır. Bu doğrultuda ODTÜ Teknokent’in resmi kuruluş yılı, kanunun yürürlüğe girdiği yıl olan 2001 olarak kabul edilir. 20 seneden fazla bir fikir ve fiili işleyiş 102 süreci, 10 seneden fazladır da resmi işleyiş süreci ile ODTÜ Teknokent; bugün Türkiye’deki tüm TGB’lerin öncüsü olarak kabul edilir. ODTÜ Teknokent’in kuruluşunda, candamarlarından biri olan Orta Doğu Teknik Üniversitesi (ODTÜ)’nin özellikle üniversite-sanayi işbirliğinde ilk sıralarda gelen başarıları da ODTÜ Teknokent’i Türkiye’deki BTPler içinde öncü pozisyona getiren önemli faktörlerden biridir. TÜBİTAK’ın öncülüğünde hazırlanan “Girişimci ve Yenilikçi Üniversite Endeksi 2013”te ODTÜ, 86 puan ile Türkiye genelindeki 50 üniversite arasından 1. olmuştur. 2012’de de yine 50 üniversite arasından 2.liği olan ODTÜ, bugüne kadar bu endekste her zaman çok önemli dereceler alabilmektedir. Endekste, “Bilimsel ve Teknolojik Araştırma Yetkinliği”, “Fikri Mülkiyet Havuzu”, “İşbirliği ve Etkileşim”, “Girişimcilik ve Yenilikçilik Kültürü” ve “Ekonomik Katkı ve Ticarileşme” ı içeren 5 başlık ve her 5 başlık için belirlenen yüzdelik başarı oranları vardır. Endeksteki üniversiteler için bu 5 oranın tamamı üzerinden genel bir başarı değerlendirmesi yapılması sonucunda, METU yukarıdaki puan ve dereceleri elde etmektedir. Bu endeks dahilinde ODTÜ’nün başarıları, aynı zamanda bir parçası da olan ve kampüsü dahilinde bulunan ODTÜ Teknokent’in uzun yıllardır süregelen ve bugün de geçerli olan lider poziyonunu korunmasında somut sonuçlardan biri olarak olarak ortaya çıkmaktadır. ODTÜ’nün ODTÜ Teknokent ile olan ilişkileri, ODTÜ’nün Stratejik Plan dökümanında da yer bulmaktadır. Bu planın en güncel hali olan 2011-2016 versiyonunda, 7 Stratejik Program kapsamındaki programlardan biri de doğrudan “ODTÜ Teknokent” olarak geçmektedir. Bu başlık altında bulunan ve kendi alt maddelerini içeren 3 ana madde şöyledir: “Bilginin ekonomik faydaya dönüşmesi ve üniversite-sanayi işbirliği kapsamında ODTÜ Teknokent ve olanaklarının etkin kullanılması” 103 “ODTÜ Teknokent’in uluslararasılaşmasının desteklenmesi” “ODTÜ, ODTÜ Teknokent ve üniversite-sanayi işbirliğinin, toplum ve ülkeye katkısının artırılması ve yaygınlaştırılması” ODTÜ’nün Stratejik Plan’ında, ODTÜ Teknokent’in resmi olarak da bulduğu bu konum ve önem aslında karşılıklı bir çıkar ilişkisini göstermektedir: ODTÜ Teknokent’in, ODTÜ’nün niceliksel ve niteliksel kaynaklarından ve altyapısından yararlanma ihtiyacı hep olduğu gibi; ODTÜ de vizyon ve misyon hedefleri dahilinde ODTÜ Teknokent’e ihtiyaç duymaktadır. Tezim dahilindeki bu çalışma, Türkiye’de yukarıda da anlatılan yönlerden öneme sahip olan ODTÜ Teknokent’in, firmaları arasında işbirliği yapma eğiliminin, yine bu tez özetinin başında anlatılmış olan ve ODTÜ Teknokent’in de dahil olduğu BTP’ler için önemli dört yapıtaşı ile ilişkisini, yine bu firmaların kendi perspektifinden incelemektedir. ODTÜ Teknokent bünyesinde dahil oldukları sektörler yönünden firmaların firmaların genel perspektifi, aynı zamanda bir BTP’nin sürdürülebilirliği ve gelişiminde büyük bir rol oynadığını vurgulamış olduğum bu dört yapıtaşı ile anlamlı bir ilişkiye sahip olup olmadıkları yönünden incelenmiştir: “AR & GE ve İnovasyon, Destek, Sektörel Zenginleşme ve ODTÜ Teknokent Altyapısı”. Çalışma, ODTÜ Teknokent bünyesinde, teknokent yönetiminden alınan çeşitli izinlere ve teknokentteki firmaların çeşitli koşulları ile geribildirimlerine bağlı olarak seçilen 43 firma ile yapmış olduğum derin ve detaylı “yarıyapılandırılmış görüşmeler” doğrultusunda şekillenmiştir ve bu yönden, ODTÜ Teknokent için bu ilişkileri irdeleyen ilk çalışmadır. Bu doğrultuda, ODTÜ Teknokent dahilinde Mart 2013 tarihi ile faaliyette olduğunu öğrendiğim tüm firmaları 4 ayrı kümede grupladım: “Yazılım & Bilgi ve İletişim Teknolojileri”, “Elektronik”, 104 “Tasarım” ve “Diğer”. Burada belirtilmesi gereken çarpıcı bir nokta ise “Diğer” kategorisinin, ilk üç küme dışında, ODTÜ Teknokent’teki tüm sektörleri bünyesinde barındırmasıdır. Bu kategorideki tüm sektörlerde faaliyet gösteren firma sayılarının toplamı, ODTÜ Teknokent’in tüm firmalarının genel sektörel dağılımının 10%’unun altında kaldığı durumdur. Başka bir deyişle, ODTÜ Teknokent’te sadece 4 sektörün sayısal bir yoğunluğunun olduğu gibi bir durumu ortaya çıkmaktadır. Böylece, bu çalışma dahilinde tüm değerlendirmelerimi, bu 4 sayısal yoğunluğa sahip küme için yapmış bulunmaktayım. Çalışmanın temel sonucu, ODTÜ Teknokent’teki firmalar perspektifinden, sektörden bağımsız olarak (hangi sektör dahilinde faaliyet gösteriyor olurlarsa olsunlar), dört yapıtaşı ile firmalar arası işbirliği için anlamlı ilişkilendirmelerin ortaya çıkmamış olmasıdır. Çalışmanın bu temel sonucuna bağlı olarak, hem ODTÜ Teknokent genelinin hem de firmalarının verimli ve sürdürülebilir bir işleyişe sahip olabilmeleri için şu gereklilik ortaya çıkmaktadır: Hem ODTÜ Teknokent yönetimi hem de firmaları, bu dört yapıtaşı ile firmalar arası işbirliği konusunu bir bütün olarak ele almalı ve bunu gelecek “vizyon ve misyon”larını belirlerken göz önünde bulundurmalıdır. Diğer bir deyişle bu konuda bir “beyin fırtınası”nın daha büyük çaptaki organizasyonlar ile yapılması gerekmektedir. Bu büyük beyin fırtınasını oluşturmak için ODTÜ Teknokent Yönetimi koordinasyonunda; ODTÜ’nün akademik ve idari yetkililerinin, teknokente destek veren devlet kurum ve kuruluşlarında görevli çeşitli yetkililerin ve ODTÜ Teknokent’in tüm sektörlerindeki firma yetkililerinin de katılımı ile ODTÜ Teknokent için yol haritası ve gelecek stratejileri belirlenmesi adına düzenli organizasyonlar ve geribildirim & strateji değerlendirme toplantıları yapılabilir. Yöntemi ve uygulaması her nasıl olursa olsun, atılımın kendisinin, hem teknokentin hem de firmalarının sürdürülebilir bir geleceğe sahip olabilmeleri adına, ODTÜ 105 Teknokent çatısı altındaki bütün sosyal aktörler tarafından üstlenilmesi gereken ana bir sorumluluk olduğuna inanmaktayım. Bu çalışma, başta ODTÜ Teknokent olmak üzere, Türkiye’de “Teknoloji Geliştirme Bölgeleri” olarak geçen tüm BTP’ler için önemli bir yere sahiptir. Çalışmanın, özellikle konuyu ele alışı ve analiz-değerlendirme teknikleri ile ODTÜ Teknokent’e yaklaşımı açısından, ODTÜ Teknokent üzerine sayıca benzerleri de zaten az olan çalışmaların içinde dikkat çekici olduğunu düşünmekteyim. Ayrıca çalışmamda kullandığım istatistikler ve veriyi temin ettiğim tarihler, tezimi hazırladığım bugünkü zaman dilimine de oldukça yakın olduğundan, tez konuma güncelliği yönünden katkıda bulunmuştur. Tüm bu yönlerden de ODTÜ Teknokent için olduğu kadar diğer Türk BTP’leri (Türkiye’deki adlandırmaları ile “TDR”leri) için de dikkate değer bir kaynak olacaktır. 106 D. TEZ FOTOKOPİSİ İZİN FORMU ENSTİTÜ Fen Bilimleri Enstitüsü Sosyal Bilimler Enstitüsü Uygulamalı Matematik Enstitüsü Enformatik Enstitüsü Deniz Bilimleri Enstitüsü YAZARIN Soyadı : Adı : Bölümü : TEZİN ADI (İngilizce) : COOPERATION AMONG METU TECHNOPOLIS FIRMS WITH REGARD TO THEIR SECTORAL DISTRIBUTION TEZİN TÜRÜ : Yüksek Lisans Doktora 1. Tezimin tamamından kaynak gösterilmek şartıyla fotokopi alınabilir. 2. Tezimin içindekiler sayfası, özet, indeks sayfalarından ve/veya bir bölümünden kaynak gösterilmek şartıyla fotokopi alınabilir. 3. Tezimden bir bir (1) yıl süreyle fotokopi alınamaz. TEZİN KÜTÜPHANEYE TESLİM TARİHİ: 107
© Copyright 2026 Paperzz