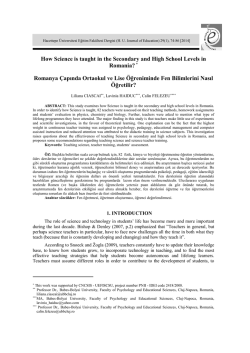
Eurasian Journal of Educational Research, Issue 55, 2014, 21-36 An Integrated Approach for Preservice Teachers’ Acceptance and Use of Technology: UTAUT-PST Scale* Işıl KABAKÇI YURDAKUL** Ömer Faruk URSAVAŞ*** Gökçe BECİT İŞÇİTÜRK**** Suggested Citation: Kabakçı-Yurdakul, I., Ursavaş, Ö.F & Becit-İşçitürk, G. (2014). An integrated approach for preservice teachers’ acceptance and use of technology: UTAUTPST Scale. Eurasian Journal of Educational Research, 55, 21-36. http://dx.doi.org/10.14689/ejer.2014.55.2 Abstract Problem Statement: In educational systems, teachers and preservice teachers are the keys to the effective use of technology in the teaching and learning processes. Predicting teachers’ technology acceptance and use remains an important issue. Models and theories have been developed to explain and predict technology acceptance. The Unified Theory of Acceptance and Use of Technology (UTAUT) is a validated model. While the number of studies designed for teachers or preservice teachers is limited, it is used to determine the variables influencing individuals’ technology acceptance. Therefore, the development of an instrument based on UTAUT is important for measuring preservice teachers’ acceptance and use of information and communication technologies. Purpose of Study: The purpose of this study was to develop an instrument to determine preservice teachers’ acceptance and use of technology. It was developed based on the UTAUT and two variables were added: selfefficacy and attitude toward use. The present study is based primarily on the PhD Thesis of Gökçe BECİT İŞÇİTÜRK at Anadolu University, supervised by Isil Kabakci Yurdakul, called ‘Examining the Acceptance and Use of Computer and Information Technologies of Pre-service teachers. **Corresponding author: Department of Computer Education and Instructional Technologies, Anadolu University, Eskişehir, Turkey. [email protected] ***Department of Computer Education and Instructional Technologies, Recep Tayyip Erdoğan University, Rize, Turkey. [email protected] ****Department of Computer Education and Instructional Technologies, Nevşehir Hacı Bektaş Veli University, Nevşehir, Turkey. [email protected] * 21 22 Işıl Kabakçı Yurdakul, Ömer Faruk Ursavaş, & Gökçe Becit İşçitürk Methods: A systematic and step-by-step approach was followed to develop an instrument for determining preservice teachers’ acceptance and use of information and communication technologies. The data were analyzed in two stages. The responses were assigned to two data sets (n = 170, 409) which were subjected to a two-stage factor analysis. The first data set was used to explore the underlying factor structure of the instrument using exploratory factor analysis (EFA). The second data set was used to confirm the factorial structure derived from the EFA using confirmatory factor analysis. Findings and Results: An innovative instrument for measuring preservice teachers’ acceptance and use of information and communication technologies was developed, and named the UTAUT-PST. It included 23 items to measure seven factors: performance expectancy, effort expectancy, social influence, facilitating conditions, behavioral intention, self-efficacy, and attitude toward using. Conclusions and Recommendations: Technology acceptance and use models differ across cultures and remain an important field of study. In this respect, the instrument is important because it was prepared for the teacher training system in Turkey. In the literature, there are several measurement tools presented to predict the variables that influence technology acceptance, but this instrument was prepared for preservice teachers based on UTAUT. It is important because it can be used both for determining the current situation and for improving the process of acceptance and use of technology. Keywords: Acceptance and use of technology, UTAUT, preservice teachers, instrument Among the variables influencing the success of the process of technology integration into education are teachers’ attitudes toward the process and their support (Bingimlas, 2009; Lim, 2007; Teo, 2008). Researchers have attempted to determine the variables influencing teachers’ acceptance and use of technology (Teo, 2010; Teo, Ursavaş, & Bahçekapılı, 2010), and, as a result, certain models have been developed to explain individuals’ technology acceptance and use (Davis, 1989; Venkatesh, 2000). These theories and models mainly include (Pynoo et al., 2011): Social Cognitive Theory (Bandura, 1986), Diffusion of Innovations Theory (Rogers, 1995), Technology Acceptance Model (Davis, Bagozzi, & Warshaw, 1989), and Theory of Reasoned Action based on psychological and social changes (Fishbein & Ajzen, 1975). Theories examining human behavior generally belong to the psychology literature, but have been used in other academic disciplines. One of these is the Theory of Reasoned Action (TRA) developed by Fishbein and Ajzen (1975). According to this theory, the best predictors of the planned and purposeful behavior of a person are his or her attitudes toward the behavior and his or her related subjective norms. In 1986, based on TRA, Davis (1989) developed the Technology Acceptance Model (TAM), a model designed to explain individuals’ technology acceptance. It consists of two basic components, perceived usefulness (PU) and Eurasian Journal of Educational Research 23 perceived ease of use (PEU). The former is defined as the degree of a person’s belief that use of a certain system will increase his or her performance in what he or she is doing while the latter is defined as the degree of a person’s belief that his or her use of a certain system (information and communication technologies) will require him or her to use less effort (Davis, 1989). The TAM was used in the field of education to determine teachers’ technology acceptance (Hu, Clark, & Ma, 2003) and preservice teachers’ technology acceptance (Ma, Andersson, & Streight, 2005; Teo, Lee & Chai, 2007; Teo, Chai, Hung, & Ling, 2008; Teo, 2008; Teo, Luan, & Sing, 2008; Teo, 2009; Teo et al., 2010). The TAM has been intensely criticized because it does not sufficiently explain technology acceptance. Researchers attempted to increase its explanatory power by adding variables (Legris, Ingham, & Collerette, 2003). In studies designed to better explain technology acceptance by teachers or teacher candidates, behavioral intention (BI) and attitudes toward using (A), were correlated not only to PU and PEU, but also to technological complexity, subjective norm, facilitating conditions, and self-efficacy. However, studies in related literature explained only 40% of the intent to use technology (Venkatesh et al., 2003). This has made it necessary to view technology acceptance models from a unified perspective. A study carried out by Venkatesh et. al. (2003) discussed eight models explaining technology acceptance and use: TRA, TAM, Motivation Model, Theory of Planned Behavior, Technology Acceptance and Planned Behavior Combined Model, PC Use Model, Diffusion Theory, and Social Cognitive Theory. In addition, the weak and strong aspects of these models were compared. As a result of the study, a new model called the Unified Theory of Acceptance and Use of Technology (UTAUT) was developed. Figure 1 demonstrates the structure of the model (Venkatesh et. al., 2003). Figure 1. Unified Theory of Acceptance and Use of Technology (UTAUT) 24 Işıl Kabakçı Yurdakul, Ömer Faruk Ursavaş, & Gökçe Becit İşçitürk As seen in Figure 1, there are four primary variables influencing the intention to use and actual use of technology: performance expectancy (PE), effort expectancy (EE), social influence (SI), and facilitating conditions (FC). In addition, UTAUT includes four moderators, gender, age, experience, and voluntariness, that predict the relationship between the primary variables and intent and use behaviors (Venkatesh et. al., 2003). These are explained as follows: Performance expectancy is defined as the degree of expectancy regarding an increase in the job performance of individuals who are using the system. It can be considered the synthesis of variables such as PEU, found in the TAM (Davis et al., 1989), extrinsic motivation, found in the Motivation Model (Davis et al., 1989), job fit, found in the PC Use Model (Triandis, 1977), relative advantage, found in the Diffusion of Innovations Theory (Rogers, 1995), and result expectancies, found in Social Cognitive Theory (Compeau & Higgins, 1995; Venkatesh et.al., 2003). Effort expectancy is defined as the degree of facilities brought by use of the system. It can be considered the synthesis of variables such as PEU, found in the TAM (Davis et al, 1989), complexity, found in the PC Use Model (Triandis, 1977), and ease of use, found in the Diffusion of Innovations Theory (Rogers, 1995; Venkatesh et.al., 2003). Social influence is defined as the degree of importance that other people give to use of the system. It can be considered the synthesis of variables such as subjective norms, found in the TAM (Davis et al., 1989), Planned Behavior Theory (Ajzen, 1971), and PC Use Models (Triandis, 1977), and image, found in the Diffusion of Innovations Theory (Rogers, 1995; Venkatesh et.al., 2003). Facilitating conditions are the organizational or technical sub-structure supports necessary for use of the system. It can be considered the synthesis of variables such as perceived behavioral control, found in Reasoned Behavior Theory (Ajzen, 1971), facilitating conditions, found in the PC Use Model (Trandis, 1977), and job fit, found in the Diffusion of Innovations Theory (Rogers, 1995; Venkatesh et.al., 2003). In the UTAUT, BI is influenced by the four variables mentioned above, and is an indicator of the efforts and demands of an individual to conduct an attitude (Davis, 1989). These variables constitute a theoretical substructure of this study. They are used to predict individuals’ behavioral intentions and attitudes toward use of the system. However, in the design phase, self-efficacy was considered a variable likely to produce different results among some samples. Self-efficacy is defined as one’s own judgment regarding his or her capacity to organize and achieve the activities necessary to demonstrate a certain performance (Bandura, 1986). While teachers’ acceptance of technology play an important role in their technology use, data collection tools developed to measure the variables influencing technology acceptance are limited in number (Teo, 2010). The first such tools developed in this field were computer attitude scales (CASs). The CAS developed by Loyd and Gressard (1985) examined attitudes toward the computer under three subdimensions: computer anxiety, computer confidence, and computer liking. Nickell Eurasian Journal of Educational Research 25 and Pinto (1986) developed one that consisted of 20 items, eight of which were reverse items, and Kay (1993) developed the Computer Attitude Measurement CAS. The Computer Technology Use Scale included 36 items, and was developed by Conrad and Munro (2008) to cover dimensions such as computer self-efficacy, attitudes toward technology, and technology-related anxiety. Because the instruments implemented in most of the recent studies on technology acceptance (Teo, 2009; Hu et al., 2003; Teo et al., 2008; Teo et al., 2008; Teo, 2009) used PU and PEU, the adapted versions prepared by Davis et al. (1989) to measure the primary variables of the TAM and those prepared by Compau and Higgins (1995) to measure attitudes toward computer use (ATCU) were used. In addition, the literature includes data collection tools developed to determine the variables influencing individuals’ technology acceptance (Becker & Anderson, 1998; Teo & Noyes, 2008; Teo, 2010). Among these, the Technology Acceptance Measure for Preservice Teachers developed by Teo (2010) is a 5-point Likert-type instrument using 16 items to measure preservice teachers’ acceptance and use of technology. While developing the instrument, the TRA (Fishbein & Ajzen, 1975), the Theory of Planned Behavior (Ajzen, 1991), te TAM (Davis, 1989), and the UTAUT (Venkatesh et. al., 2003) were used as bases. The instrument included five factors: PU, PEU, subjective norm, FC, and ATCU. In studies of the UTAUT, an effective model that explains technology acceptance and use, adapted versions of the items prepared by Venkatesh et. al., (2003) were generally used (Pynoo et. al., 2009; Irvin & Birch, 2011). It is evident in related literature that technology use is a complex issue in classes, and that there are a number of variables influencing teachers’ technology use in classes (Teo, 2010). Because UTAUT explains 70% of individuals’ technology use and their attitudes toward technology use, it is considered to be an important development in the literature (Venkatesh et. al., 2003). On the other hand, the number of studies designed for teachers or preservice teachers is limited, though UTAUT is used to determine the variables influencing individuals’ technology acceptance. Therefore, the development of an instrument based on the UTAUT is important for measuring preservice teachers’ acceptance and use of information and communication technologies. Method The purpose of this study was to develop a scale for determining preservice teachers’ acceptance and use of information and communication technologies. A systematic and step-by step-approach was followed while developing the scale. Item generation Following the related literature, scale items for determining the variables that explain preservice teachers’ information and communication technology acceptance and use were adapted from Venkatesh et al. (2003). The 53 items formed were presented to eight field experts from the education technology field, and were organized according to their views. The pilot application was carried out with 12 preservice teachers from different departments, and it was found that the scale did 26 Işıl Kabakçı Yurdakul, Ömer Faruk Ursavaş, & Gökçe Becit İşçitürk not include incomprehensible items. In addition, the pilot revealed that it took approximately 25 minutes to administer the instrument. Participants and Data Analysis Participants in this study comprised 579 preservice teachers from two universities in Turkey. The participants were enrolled in different programs and 67.4% (390) were female. The participants were selected from the seniors, those closest to becoming teachers. The data were analyzed in two stages. The responses were assigned to one of two data sets (n = 170, 409), and they were used in a two-stage factor analysis. The first was used to explore the underlying factor structure of the instrument using exploratory factor analysis (EFA). The second was used to confirm the factorial structure derived from the EFA using confirmatory factor analysis (CFA). The EFA is often considered a data-driven approach to identifying a smaller number of underlying factors or latent variables. However, CFA testing is needed to confirm EFA findings (Haig, 2005). Harrington (2009) stressed that EFA may be used as an exploratory first step during the development of a tool, then CFA is used to examine whether the structure identified in the EFA works in a new sample. In other words, CFA is used to confirm the factor structure identified by the EFA. Study One: EFA Aim and participants. This study was designed to test and refine the 53 items mentioned above. They were presented using a 5-point Likert response scale ranging from 1 (strongly disagree) to 5 (strongly agree). The participants were 170 preservice teachers (119 females and 51 males) enrolled in the education program at a teacher training faculty in Turkey. The mean (standard deviation) of the participants’ daily computer use was 2.24 (0.94). All participants were volunteers and were informed about the purpose of this study and their rights not to participate and to withdraw from completing the questionnaire at any time during or after data collection. It took participants about 25 minutes to complete the questionnaire. EFA. This was applied using principal axis factoring and varimax rotation to extract factors. The eigenvalue and scree plot were used to determine the number of factors extracted. In addition to Kaiser’s (1960) requirement that the eigenvalue be greater than 1 and Cattell’s (1966) scree test, the factor load lower cut-off point was set at 0.50 for each item, as suggested by Hair, Black, Babin, Anderson &Tatham (2006). Moreover, as the factors were more meaningful and interpretable, items found under more than one factor were excluded from analysis. Results. Descriptive statistics and EFA were found for the 53 scale items. The mean values of all items ranged from 2.09 to 4.35. Standard deviations ranged from 0.80 to 1.19, and the skew and kurtosis indices from -.80 to -1.50 and -.84 to 2.04, respectively. Following Kline's (2005) recommendations, the data were considered to be univariate normal. The initial solution yielded eight factors with eigenvalues exceeding 1, accounting for a total of 59.49% of the variance. Inspection of the scree plot supported the retention of eight factors as well. Using a cut-off of 0.5 for factor loading, five items were excluded, reducing the items to 28. Table 1 shows the Eurasian Journal of Educational Research 27 principal axis factoring analysis of the eight constructs and the number of items per factor. The reliability index for each factor was computed using Cronbach’s α, and were high (.76 for PE, .88 for BI, .73 for SE, .89 for FC, .87 for SI, .78 for EE, and .84 for A). Table 1 Principal Axis Factoring Analysis With Varimax Rotation Item PE BI SE FC SI EE h2 PE1 0.78 0.69 PE2 0.76 0.72 PE3 0.71 0.68 PE4 0.71 0.62 PE5 0.70 0.59 PE6 0.61 0.51 BI1 0.72 0.65 BI2 0.70 0.63 BI3 0.68 0.63 BI4 0.67 0.64 BI5 0.65 0.63 SI1 0.75 0.70 SI2 0.75 0.72 SI3 0.73 0.59 SI4 0.72 0.66 SI5 0.60 0.59 FC1 0.81 0.71 FC2 0.77 0.71 FC3 0.59 0.69 FC4 0.57 0.64 SI1 0.81 0.70 SI2 0.80 0.74 SI3 0.76 0.67 EE1 0.68 0.57 EE2 0.60 0.59 A1 0.76 0.76 A2 0.73 0.73 A3 0.54 0.54 Eigenvalue Percentage explained of variance Study Two: CFA 4.27 3.50 3.35 2.48 2.22 1.81 1.72 12.55 10.28 9.86 7.31 6.53 5.31 5.06 28 Işıl Kabakçı Yurdakul, Ömer Faruk Ursavaş, & Gökçe Becit İşçitürk Aim and participants. This study was designed to assess the reliability and validity of the scores regarding the 28 scale items. The participants in this study were 409 preservice teachers (271 female, 138 male) enrolled in the education program at a teacher training faculty in Turkey. The mean (standard deviation) of the participants’ daily computer use was 2.50 (0.97). All participants were volunteers who were not rewarded with money or in kind and were informed that they had the right to withdraw from the study at any time during or after the study. CFA. The model fit was assessed by a number of common indices: the minimum fit function χ2 test, the root mean square error of approximation (RMSEA; Steiger, 1990), the comparative fit index (CFI; Bentler, 1990), the Tucker-Lewis fit index (TLI; Bentler & Bonett, 1980), and the standardized root mean square residual (SRMR; Hu & Bentler, 1999). The χ2 test assesses the fit of the model by comparing the sample correlation matrix with the correlation matrix estimated under the model. Small values indicate a good fit, reflecting a small discrepancy between the structure of the observed data and the hypothesized model. Because χ2 has been found to be too sensitive to the sample size (Hu & Bentler, 1999), the ratio of χ2 to its degrees of freedom (χ2/df) was used, and a range of not more than 3.0 was indicative of an acceptable fit (Carmines & McIver, 1981). The RMSEA reflects the extent to which the model fit approximates a reasonably fit model; the model fit is acceptable when values are less than .08 and good when values are less than .05 (Browne & Cudeck, 1993). The CFI and TLI compare the hypothesized model to a ‘null’ or worst fitting model, taking into account model complexity, and indicate an acceptable model fit when values are greater than .90, and a good model fit when values are greater than .95 (Hu & Bentler, 1999). The SRMR is a standardized summary of the average covariance residuals. When the model fit is perfect, the SRMR is zero. Hu and Bentler (1999) suggest that an SRMR value close to .05 indicates a relatively good fit. Results. To confirm the factor structure found in the EFA, the CFA was conducted using the maximum likelihood estimator (MLE) using Amos 18.0 software (IBM SPSS® Amos™ 18) on the second data set. Use of the MLE is popular in structural equation modeling (Schumacker & Lomax, 2004). Because MLE assumes multivariate normality of the observed variables, the data were examined with respect to multivariate normality using Mardia’s normalized multivariate kurtosis value. The Mardia’s coefficient for this data was 377.48, computed using Amos software. This is lower than the value of 783, computed using the formula p(p+2) where p equals the number of observed variables in the model (Raykov & Marcoludes, 2008). Several models were computed and compared as part of the CFA. Various conceptualizations of the factor structure of the proposed instrument were made: First, a null model that assumes all factors are unrelated; second, a one-factor model that tests if all factors can be summarized with one overall factor; and finally, a correlated factor model that tests whether the eight factors are related to one another. The final model indicated that the participants discriminated between the seven factors and that they were correlated with one another. 29 Eurasian Journal of Educational Research Table 2 Confirmatory Factor Analysis of Alternative Models Model χ2 Df χ2 /df TLI CFI RMSEA SRMR Model 1 – Null 7131.19 253 28.18 --- --- .21 .36 Model 2 - One-Factor (23-items) 2845.56 252 11.29 .60 .64 .13 .31 Model 3 - Seven – Factor Correlated 637.85 209 3.05 .92 .93 .06 .05 Table 2 shows that all the parameters were statistically significant (p < .01). In addition, all the standardized estimates and R2 values were higher than .70 and .50, respectively, as suggested by Hair et.al. (2006). Values of R2 exceeding .50 indicate that more than half of the variance for each factor (latent variable) was explained. The Cronbach’s α for each factor of the UTAUT ranged from .65 to .86, meaning that the model is acceptable, based on the recommendations by Hair et al. (2006). Table 3 shows the model comparisons. Table 3 Results of the Confirmatory Factor Analysis Item Unstandardized estimate Standardized estimate T value* R2 Performance Expectancy .861 PE1-7 .83 .72 18.13 .52 PE2-8 .91 .74 17.81 .54 PE3-12 .91 .76 20.36 .58 PE4-10 .93 .78 21.32 .61 PE5-11 1.00 .83 - .69 Effort Expectancy .733 EE1-4 1.02 .78 14.44 .61 EE2-3 1.00 .74 - .54 SI1-- 1.04 .79 15.05 .62 SI2-6 .86 .71 13.82 .51 SI3-2 1.00 .74 - .54 Social Influence .774 Facilitating Conditions .789 FC1-10 1.18 .79 14.41 .62 FC2-9 1.16 .77 14.34 .59 FC3-2 1.00 .73 - .53 1.19 .87 18.21 .76 Self-efficacy SE1-2 Α .842 30 Işıl Kabakçı Yurdakul, Ömer Faruk Ursavaş, & Gökçe Becit İşçitürk Table 3 Continue Item Unstandardized estimate Standardized estimate T value* R2 SE2-3 1.12 .84 18.55 .71 SE3-1 1.00 .72 - .52 A1-3 1.36 .78 15.94 .61 A2-4 1.42 .76 15.75 .58 A3-1 1.00 .74 - .54 BI1-5 1.04 .73 14.00 .53 BI2-4 1.27 .79 15.43 .62 BI3-1 1.32 .79 15.44 .62 BI4-2 1.00 .71 - .51 Attitude .766 Behavioral Intention *p Α .656 < 0.01; - estimate set at 1.00 for identification purpose. It is seen in Table 3 that the results demonstrate that except for the χ2, all the values satisfied the recommended level of acceptable fit [ χ2=637.850 (p = 0.0001), df=209; χ2 /df=3.052; TLI=0.925; CFI=0.938; RMSEA=0.060(LO:.054, HI:.065); and SRMR=.050]. Hence, Model 3 was retained as the model of best fit. Table 4 shows the correlation matrix for the UTAUT constructs. It is seen in Table 3 that the results demonstrate that except for the χ2, all the values satisfied the recommended level of acceptable fit [ χ2=637.850 (p = 0.0001), df=209; χ2 /df=3.052; TLI=0.925; CFI=0.938; RMSEA=0.060(LO:.054, HI:.065); and SRMR=.050]. Hence, Model 3 was retained as the model of best fit. Table 4 shows the correlation matrix for the UTAUT constructs. Table 4 Matrix of Intercorrelations among the UTAUT Constructs Construct PE SI FC SE A EE PE 1.00 SI .39** 1.00 FC .30** .23** 1.00 SE .49** .34** .27** 1.00 A .72** .33** .27** .62** 1.00 EE .62** .30** .27** .54** .73** 1.00 BI .76** .40** .29** .54** .71** .60** BI 1.00 PE=Performance Expectancy; EE=Effort Expectancy; SI=Social Influence; FC=Facilitating Conditions; BI=Behavioral Intention; SE=Self-Efficacy, A=Attitude Toward Using, **p<0.01. Eurasian Journal of Educational Research 31 Table 4 shows that all correlations between the UTAUT factors are moderate and significant at p < .01 and p < .05. This suggests that the seven factors in the UTAUT are distinct, though they are related. Discussion and Conclsusion The goal of this study was to develop a means to determine preservice teachers’ acceptance and use of technology. The UTAUT was used as a basis, and the variables from this model were used. In addition, the variables of attitude toward use and selfefficacy were not found to be significant, but were considered likely to be significant in different samples. The 53 items prepared as a result of a literature review were presented to field experts and re-organized according to their views. The analyses revealed seven factors: PE, EE, SI, FC, SE, A, and BI. A two-phase study was conducted. First, EFA was carried out, and using a cut-off of 0.5 for factor loading, five items were deleted to reduce the scale items to 28. Second, CFA was used to confirm the factors, and 23 items were ultimately used. The instrument was capable of explaining more than half of the variance. There are certain problems regarding teachers’ integration of technology into instructional processes (Yildirim & Goktas, 2007; Bingimlas, 2009; Choy, Wong, & Gao, 2008). This instrument will allow researchers to determine the variables that influence the process of preservice teachers’ technology integration. Teachers can consider this instrument a useful tool to gain a better understanding of the variables that predict technology acceptance among preservice teachers. These data could help to determine new strategies for increasing preservice teachers’ acceptance of technology and to improve the process of preservice teachers’ technology usage. The UTAUT-PST instrument could be used as a valid and reliable tool to determine the variables influencing preservice teachers’ acceptance and use of technology. In addition, it could provide an integrated approach for determining preservice teachers’ acceptance and use of information and communication technologies using UTAUT. Thus, it is thought to be beneficial for researchers in the field. Appendix A includes the 5-point Likert items ranging from 5 (completely agree) to 1 (completely disagree). In conclusion, the UTAUT-PST instrument differs from other measurement tools developed for the UTAUT that are found in the literature. First, it includes the selfefficacy variable, which could reveal different results with some samples. This was tested before, but was not found to be significant in the UTAUT. Second, it differs from other tools because it was prepared for use with preservice teachers. The Technology Acceptance and Use Model (TAM) differs across cultures, and remains an important field of study (Venkatesh & Zhang, 2010). In this respect, our instrument is important and appropriate for use in the teacher training system in 32 Işıl Kabakçı Yurdakul, Ömer Faruk Ursavaş, & Gökçe Becit İşçitürk Turkey. While the literature contains several measurement tools developed to predict the variables that influence technology acceptance, this instrument was prepared for preservice teachers based on the UTAUT, and can be used both for determining the current situation and for improving the scientific research related with preservice teachers’ use of technology. References Ajzen, I. (1991). The theory of planned behavior. Organizational Behavior and Human Decision Processes, 50, 179-211. Bandura, A. (1986) Social Foundations of Thought and Action: A Social Cognitive Theory, Prentice Hall, Englewood Cliffs, NJ Birch, A. & Irvine, V., (2009). Preservice teachers' acceptance of ICT integration in the classroom: Applying the UTAUT model. Educational Media International, 46(4), 295-315. Bentler, P. M. (1990). Comparative fit indexes in structural models. Psychological Bulletin, 107(2), 238-246 Bentler,P.M., & Bonnett, D.G. (1980). Significant tests and goodness of fit in the analysis of covariance structure. Psychological Bulletin, 88, 588-606. Bingimlas, K. (2009). Barriers to the successful integration of ICT in teaching and learning environments: a review of the literature. Eurasia Journal of Mathematics, Science & Technology Education, 5(3), 235-245. Browne, M. W. & Cudeck, R. (1993). Alternative ways of assessing model fit. In: Bollen, K. A. & Long, J. S. (Eds.) Testing Structural Equation Models, 136–162. Beverly Hills, CA: Sage Carmines, E.G., & Mclver, J.P. (1981). Analyzing models with observable variables. In In G. W. Bohrnstedt & E.F.Borgatta (Eds.), Social measurement, 65-115.Beverly Hills: Sage. Cattell, R. B. (1966). The scree test for the number of factors. Multivariate Behavioral Research, 1, 629-637. Choy, D., Wong, A. & Gao, P. (2008). Singapore’s pre-service teachers’ perspectives in integrating information and communication technology (ICT) during practicum. Proceedings of the Australian Association for Research in Education (AARE) 2008 International Education Research Conference. Fremantle: AARE. Compeau, D. R. & Higgins, C. A. (1995). Application of Social Cognitive Theory to Training for Computer Skills. Information Systems Research, 6(2), 118-143. Conrad, A. M. & Munro, D. (2008). Relationships between computer self-efficacy, technology, attitudes and anxiety: development of the computer technology use scale (CTUS). Journal of Educational Computing Research, 39 (1), 51-73. Davis, F. D. (1989). Perceived usefulness, perceived ease of use, and user acceptance of information technology. M IS Quarterly, 13(3), 319-339. Eurasian Journal of Educational Research 33 Davis, F. D., Bagozzi, R. P. & Warshaw, P. R. (1989). User acceptance of computer technology: A comparison of two theoretical models. Management Science, 35(8), 982-1002. Davis, F. D., Bagozzi, R. P. & Warshaw, P. R. (1992). Extrinsic and intrinsic motivation to use computers in the workplace. Journal of Applied Social Psychology, 22(14), 1111-1132. Fishbein, M. & Ajzen, I. (1975). Belief, Attitude, Intention and Behavior: An Introduction to Theory and Research. Addison-Wesley, Reading, MA. Haig, B. D. (2005). Exploratory factor analysis, theory generation, and scientific method. Multivariate Behavioral Research, 40, 303–329. Hair, J. F. Jr., Black, W. C., Babin, B. J., Anderson, R. E. & Tatham, R. L. (2006). Multivariate data analysis (6th edition). New Jersey: Prentice-Hall International. Harrington, D. (2009). Confirmatory Factor Analysis. (Pocket Guides to Social Work Research Methods Series). New York: Oxford University Press. Hu, P.J.H., Clark, T.H.K. & Ma, W.W.K. (2003). Examining Technology Acceptance by School Teachers: a Longitudinal Study. Information & Management, 41, 227241. Hu, L. & Bentler, P.M.(1999). Cutoff criteria for fit indexes in covariance structure analysis: Conventional criteria versus new alternatives. Structural Equation Modeling, 6, 1-55. Kaiser, H. F. (1960). The application of electronic computers to factor analysis. Educational and Psychological Measurement, 20, 141-151. Kay, R.H. (1993). An exploration of theoretical approach to assessing computer attitudes: The Computer Attitude Measure (CAM). Computers in Human Behavior, 9, 371-386. Kline, R. B. (2005). Principles and practice of structural equation modeling (2nd ed.). New York: Guilford Press. Legris, P., Ingham, J. & Collerette, P. (2003). Why do people use information technology? A critical review of the technology acceptance model. Information & Management, 40 (3), 191-204. Lim, C,P. (2007). Effective integration of ICT in Singapore schools: pedagogical and policy implications. Education Technology Research & Development, 55(1), 83-116. Loyd, B.H. & Gressard, C. (1985). The reliability and validity of an instrument for the assessment of computer attitudes. Educational and Psychological Measurement, 45 (4), 903-908 Ma, W.W., Andersson, R. & Streith, K.O. (2005). Examining user acceptance of computer technology: An empirical study of student teachers. Journal of Computer Assisted Learning, 21(6), 387-395. Nickell, G.S. & Pinto, J.N. (1986). The computer attitude scale. Computers in Human Behavior, 2, 301-306. 34 Işıl Kabakçı Yurdakul, Ömer Faruk Ursavaş, & Gökçe Becit İşçitürk O’Conner, B. P. (2000). SPSS and SAS programs for determining the number of components using parallel analysis and Velicer’s MAP test. Behavior Research Methods, Instruments and Computers, 32(3), 396-402. Pynoo, B., Devolder, P., Tondeur, J., Braak, J., Duyck, W. & Duyck, P. (2011). Predicting Secondary School Teachers’ Acceptance and Use of A Digital Learning Environment: A Cross-sectional Study. Computers in Human Behavior, 27, 568-575 Raykov, T., & Marcoulides, G.A. (2008). An introduction to applied multivariate analysis. Lawrence Erlbaum Associates, Inc. Publishers Rogers, E. (1995). Diffusion of Innovations, Free Press, New York. Schumacker, R. E. & Lomax, R. G. (2010). A beginner's guide to structural equation modeling (3rd ed.). New York: Routledge Steiger, J.H. (1990). Structural model evaluation and modification: an interval estimation approach. Multivariate Behavioral Research, 25, 173–180. Teo, T. (2008). Pre-service teachers’ attitude towards computer use: a Singapore survey. Australasian Journal of Educational Technology, 24, 413-424. Teo, T. (2009). Modeling Technology acceptance in education: A study of pre-service teachers. Computers & Education, 52, 302-312 Teo, T. (2009). Evaluating the Intention to use technology among student teachers: a structural equation modeling approach. International Journal of Technology in Teaching and Learning, 5 (2), 106-118 Teo, T. (2010). Measuring the effect of gender on computer attitudes among preservice teachers: A multiple indicators, multiple causes (MIMIC) modeling. Campus-Wide Information Systems, 27(4), pp.227 - 239 Teo, T., Lee, C.B. & Chai, C.S. (2008). Understanding preservice teacher’ computer attitudes: Applying and extending the Technology Acceptance Model. Journal of Computer Assisted Learning, 24(2), 128-143. Teo, T., Luan, S. W., & Sing, C.C. (2008). A cross-cultural examination of the intention to use technology between Singaporean and Malaysian pre-service teachers: an application of the Technology Acceptance Model (TAM). Educational Technology & Society, 11(4): 265-280 Teo, T., Ursavaş, Ö.F. & Bahçekapılı, E. (2010). Efficacy of the technology acceptance model to explain pre-service teachers’ intention to use technology A Turkish Study, Campus-Wide Information Systems 28(2), 93 – 101. Triandis,H . C. (1977), Interpersonal Behavior, Brooke/ Cole, Monterey, CA. Venkatesh, V. (2000). Determinants of perceived ease of use: integrating perceived behavioral control, computer anxiety and enjoyment into the technology acceptance model, Information Systems Research, 11(4), 342- 365. Venkatesh, V., Morris, M., Davis, G. & Davis, F. D. (2003). User acceptance of information technology: Toward a unified view. MIS Quarterly, 27(3), 425-478. Eurasian Journal of Educational Research 35 Venkatesh, V. & Zhang, X. (2010). Unified theory of acceptance and use of technology: U.S. vs. China. Journal of Global Information Technology Management, 13(1), 5-27. Yildirim, Z. & Goktas, Y. (2007). ICT Integration in primary education and teacher education programs in turkey and in EU countries, Eğitim ve Bilim, 32(143), 55-67. Öğretmen Adaylarının Bilgi ve İletişim Teknolojileri Kabul ve Kullanımlarına Yönelik Ölçek Geliştirme Çalışması: UTAUT-PST Atıf: Kabakçı-Yurdakul, I., Ursavaş, Ö.F & Becit-İşçitürk, G. (2014). An integrated approach for preservice teachers’ acceptance and use of technology: UTAUTPST Scale. Eurasian Journal of Educational Research, 55, 21-36. http://dx.doi.org/10.14689/ejer.2014.55.2 Özet Problem Durumu: Bireylerin teknoloji kabul ve kullanımlarını etkileyen değişkenlerin belirlenmesi alanyazında önemli bir araştırma alanını oluşturmaktadır. Teknoloji Kabul ve Kullanım Birleştirilmiş Modeli (TKKBM) bireylerin teknoloji kabul ve kullanımını açıklamada oldukça başarılı bir modeldir. Bununla birlikte, TTKBM halen yeni ve az denenmiş bir modeldir. Alanyazın incelendiğinde görülmektedir ki; öğretmen adaylarının teknoloji kabul ve kullanımlarını etkileyen değişkenleri belirlemeye yönelik olarak hazırlanmış ölçme araçları sınırlı sayıdadır. Bu bağlamda özel olarak öğretmenler ya da öğretmen adayları için Teknoloji Kabul ve Kullanım Birleştirilmiş Modeli’nin temel alındığı bir ölçeğin geliştirilmesi önem kazanmaktadır. Araştırmanın Amacı: Bu çalışmada öğretmen adaylarının teknoloji kabul ve kullanımlarını etkileyen değişkenleri belirlemeye yönelik bir ölçek geliştirilmesi amaçlanmıştır. Bu bağlamda Teknoloji Kabul ve Kullanım Birleştirilmiş Modeli temel alınmış ve bu modelde incelenen değişkenler kullanılmıştır. Bununla birlikte, modelde anlamlı bulunmayan, ama farklı örneklemlerde anlamlı çıkabileceği düşünülen özyeterlik ve kullanıma karşı tutum değişkenlerine de yer verilmiştir. Araştırmanın Yöntemi: Araştırma iki farklı üniversitenin farklı programlarında eğitim görmekte olan 579 son sınıf öğretmen adayının katılımı ile gerçekleştirilmiştir. Öğretmen olmaya en yakın grup olduklarından son sınıf öğretmen adayları araştırmaya dahil edilmiştir. Alanyazın taraması doğrultusunda öğretmen adaylarının teknoloji kabul ve kullanımlarını açıklamayı amaçlayan bileşenlere yönelik olarak Venkatesh vd. (2003)’ten uyarlanan maddeler kullanılmıştır. Ölçek geliştirme sürecinde adım adım ilerleyen sistematik bir yaklaşım izlenmiştir. Bu bağlamda öncelikle veri seti ikiye bölünmüştür (n=170-409). 5’li Likert tipinde 36 Işıl Kabakçı Yurdakul, Ömer Faruk Ursavaş, & Gökçe Becit İşçitürk hazırlanan ölçme aracında yer alan ölçme maddeleri arasındaki muhtemel ilişkiyi ortaya çıkarma amacıyla veriler ilk olarak Açıklayıcı Faktör Analizine (AFA) tabi tutulmuştur. Araştırmanın ilk bölümünde kullanılan veri seti n=170 öğretmen adayından (119 kadın, 51 erkek) oluşmaktadır. 53 maddeden oluşan ilk veri seti ile betimleyici istatistikler ve açımlayıcı faktör analizi yapılmış böylece öğretmen adaylarının teknoloji kabul ve kullanımını yordayan değişkenlerin hangi faktörler altında toplandığı belirlenmeye çalışılmıştır. Ölçekte yer alan her bir maddeye ilişkin ortalama puanların 2.09 ve 4.35 arasında değiştiği ayrıca ölçme maddelerine verilen cevaplara ilişkin standart sapmaların 0.80 ve 1.19 arasında değiştiği hesaplanmıştır. Normallik varsayımlarından geçirilen verilerin ortalama etrafında dağıldığı normal dağılım gösterdiği tespit edilmiştir. Faktör analiz sonucunda 7 faktörden oluşan ölçme aracı ayrıca çizgi grafiği ve paralel analize tabi tutulmuştur. Bu analizler sonucunda ölçme maddelerinin toplamda varyansın %59.49’unu açıkladığı hesaplanmıştır. Araştırma kapsamında elde edilen bu ölçme aracının mevcut faktör yapısının doğrulanması amacıyla seçilen ikinci bir örneklem üzerinde doğrulayıcı faktör analizi yapılmıştır. Çalışma 2 olarak adlandırılan bu aşamaya 409 öğretmen adayı (271 kadın, 138 erkek) dahil edilmiştir. Çok değişkenli normallik varsayımın test edildiği modelde ayrıca ölçme modelinin sağlanmasına ilişkin pek çok uyum iyiliği indeksi kullanılmıştır. Modelin farklı faktör yapılarında da testi ayrıca sağlanmıştır. Bu çalışmanın sonucunda, öğretmen adaylarının bilgi ve iletişim teknolojileri kabul ve kullanımını etkileyen değişkenleri belirlemeye yönelik yenilikçi bir ölçek olan UTAUT-PST geliştirilmiştir. Araştırmanın Bulguları: Bu çalışmanın sonucunda, öğretmen adaylarının bilgi ve iletişim teknolojileri kabul ve kullanımını etkileyen değişkenleri belirlemeye yönelik yenilikçi bir ölçek olan UTAUT-PST geliştirilmiştir. UTAUT-PST 2 bölümden oluşmaktadır. İlk bölümde demografik bilgilerin yer aldığı 8 madde ikinci bölümde ise 5’li Likert tipi 23 madde bulunmaktadır ve bu maddeler Performans Beklentisi, Çaba Beklentisi, Sosyal Etki, Kolaylaştırıcı Durumlar, Özyeterlik, Kullanıma Karşı Tutum ve Davranışsal Niyet olmak üzere 7 faktör altında toplanmaktadır. Araştırmanın Sonuçları ve Öneriler: Teknoloji Kabul ve Kullanım Birleştirilmiş Modelinin farklı kültürlerle çalışılması alanyazında önemini korumaktadır. Bu bağlamda Türkiye’deki koşullara ve öğretmen yetiştirme sistemine uygun olarak hazırlanan bu ölçek önem kazanmaktadır. Bireylerin teknoloji kabul ve kullanımlarını etkileyebileceği düşünülen değişkenlerin modele katılması ile güçlendirilen ölçek mevcut durumun belirlenmesi ve sürecin iyileştirilmesine katkı sağlaması açısından önemlidir. Benzer şekilde ölçeğin öğretmenler için de uyarlaması yapılabilir ve farklı örneklemlerde uygulandığı çalışmalar desenlenebilir. Anahtar Kelimeler: Teknoloji kabul ve kullanımı, teknoloji kabul ve kullanım birleştirilmiş modeli, öğretmen adayı, ölçek
© Copyright 2026 Paperzz