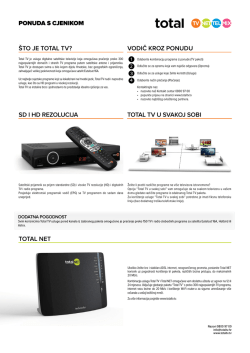
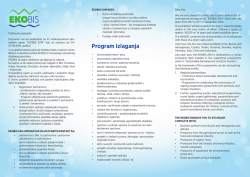
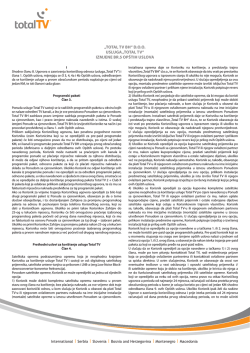
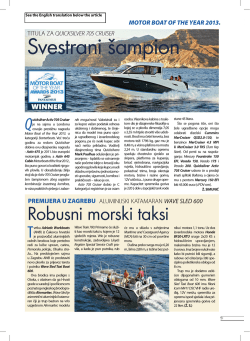
InfoTrend TOP50 50 najvećih u telekom industriji Hrvatske 156/12/2007 InfoTrendTOP50 1 Godišnji pregled telekom industrije u Hrvatskoj Na valu liberalizacije Izvor podataka: Financijska agencija Analiza podataka: Krešimir Alić Uredio: Vlado Smud Kretanja u hrvatskom telekomunikacijskom sektoru u 2006. godini U koliko bi se hrvatski telekomunikacijski sektor usporedio s brodom, njegovo kretanje u prošloj godini moglo bi se opisati sljedećim riječima: susrećući se s nestabilnim vremenskim uvjetima, plovilo se kretalo relativno sporo, ali ipak u smjeru luke do koje planira stići. Izađemo li iz pomorske terminologije, opis bi izgledao ovako: istovremeno s brojnim pomacima u smjeru liberalizacije i jačanja konkurencije među sudionicima hrvatskog telekomunikacijskog tržišta, zabilježeni su i brojni pritisci u suprotnom smjeru koji su u znatnoj mjeri usporili spomenute pozitivne trendove i odgodili njihove očekivane učinke. tržišta tijekom cijele godine ili barem jednog njezinog dijela. Tako su naš brod u pozitivnom smjeru gurali sljedeći vjetrovi: rast broja korisnika mobilne telefonije, rast prometa u mobilnim mrežama, rast broja korisnika širokopojasnog pristupa Internetu, nastavak procesa podjele WiMAX licenci, nastavak ulaganja operatera u vlastitu mrežnu infrastrukturu, rasprave o nacionalnoj broadband strategiji itd. Nasuprot tome, morske struje koje su usporavale kretanje ovog broda obuhvaćale su: nastavak sukoba oko DTK, sporo raspetljavanje lokalne petlje (problem konačno riješen tek u posljednjem kvartalu), pad glasovnog prometa u fiksnim mrežama, pritužbe potrošača vezano uz troškove uzrokovane dialerima i slično. Scenarij razvoja telekomunikacijskog sektora za 2006. godinu Koji su, konkretno, događaji u hrvatskom telekomunikacijskom sektoru obilježili 2006. godinu? Najvažniji od njih sažeti su u Tablici 1. Kao posljedica gore opisanih događaja, na hrvatskom telekomunikacijskom tržištu trebali su nastupiti sljedeći trendovi: Tablica 1. Najvažniji događaji na hrvatskom telekomunikacijskom tržištu u 2006. godini Trend 1.: Nastavak procesa liberalizacije tržišta telekomunikacijskih usluga dovodi do povećanja broja operatera. Kako bi bili u stanju započeti s nuđenjem usluga, alternativni operateri su primorani ulagati u vlastitu infrastrukturu što rezultira povećanjem prihoda proizvođača telekomunikacijske opreme, instalatera telekomunikacijske opreme i implementatora telekomunikacijskih rješenja. Mjesec Događaj na telekomunikacijskom tržištu Siječanj Tele2 uveo SMS parking uslugu u 21 hrvatskom gradu Veljača Novi-Net postao prvi davatelj WiMAX usluga u Hrvatskoj Ožujak Svibanj Amis Telekom postao četvrti provajder usluge širokopojasnog pristupa Internetu Vipnet postao prvi mobilni operater u Hrvatskoj koji nudi HSDPA tehnologiju T-Hrvatski Telekom kupio Iskon Internet za 13,7 milijuna eura Lipanj VIPnet ponudio jeftini Tomato brand s pozivnim brojem 092 Srpanj Kolovoz Metronet ponudio prvo izdanje obveznica u hrvatskom telekomunikacijskom sektoru HAT uputio poziv na javnu raspravu vezanu uz rješavanje pitanja upravljanja DTK infrastrukturom Rujan T-Com ponudio IPTV uslugu, Vipnet uveo Homebox Listopad Studeni Uvedena usluga prenosivosti broja u telekomunikacijskim mrežama Vijeće HAT-a oduzelo WiMAX koncesiju Iskon Internetu i dodijelilo je Vipnetu Prosinac Adriatic Kabel preuzeo Globalnet Travanj Izvor: InfoTrend, 2007. Osim spomenutih, u brodskom se dnevniku nalazi čitav niz događaja koje nije moguće svrstati u točno određeni mjesec, jer su utjecali na razvoj InfoTrendTOP50 Tijekom većeg dijela 2006. hrvatski alternativni fiksni operateri bili su u mogućnosti koristiti tek usluge predodabira operatera i prenosivosti broja (jer je lokalna petlja raspetljana tek krajem godine). Kako bi svoje poslovanje učinili isplativijim, operateri su morali uložiti značajna sredstva u izgradnju vlastitih sustava. Kao posljedica toga, prihodi proizvođača opreme, instalatera opreme i implementatora trebali su značajno porasti. S druge strane, treba imati u vidu pad CAPEX-a (troškova vezanih za kapitalna ulaganja) dvaju vodećih mobilnih operatera, koji je očekivane stope rasta zasigurno spustio za nekoliko postotnih bodova. Također, ovdje je važno uzeti u obzir i snažnu uvoznu tendenciju koja vlada u svim segmentima hrvatskog gospodarstva. Drugim riječima, ako je oprema za potrebe izgradnje sustava operatera uvezena a ne kupljena od domaćih proizvođača, prihod je otišao u ruke distributera telekomunikacijske opreme. Pružatelji telekomunikacijskih usluga (operateri) - svi poslovni subjekti koji pružaju usluge fiksne telefonije, mobilne telefonije, pristupa Internetu, prijenosa podataka, itd. Proizvođači telekomunikacijske opreme - poslovni subjekti koji najveći dio prihoda ostvaruju proizvodnjom i prodajom vlastitih telekomunikacijskih rješenja. Instalateri telekomunikacijske opreme – tvrtke koje bave instaliranjem telekomunikacijske opreme (primjerice, polaganjem optičkih kablova) za potrebe operatera. 156/12/2007 InfoTrend TOP50 Trend 2.: Jačanje konkurencije među operaterima dovodi do pada cijena telekomunikacijskih usluga. Time ove usluge postaju dostupne većem dijelu stanovništva, odnosno i onima kojima zbog niske kupovne moći prije nisu bile dostupne. Rezultat je porast ukupnih prihoda operatera. Distributeri telekomunikacijske opreme - veletrgovci koji se bave plasmanom proizvoda za daljnju prodaju value added resellerima, dilerima i maloprodaji. U hrvatskom slučaju, ova kategorija također učestvuje i u prodaji krajnjim korisnicima. Općenito gledano, u Hrvatskoj je prošle godine došlo do određenog jačanja konkurencije među operaterima. Međutim, veliki udarac tržišnoj konkurenciji, posebno u segmentu usluga pristupa Internetu, zadan je THT-ovim preuzimanjem drugog najvećeg ISP-a. Ipak, zbog T-HT-ovih nastojanja (potaknutih od strane nadležnih Vladinih tijela) da proširi korištenje širokopojasnog Interneta, posljedice za tržište nisu bile tragične. Zbog toga što (određene) telekomunikacijske usluge počinju koristiti ljudi niže kupovne moći, dakle oni koji su u mogućnosti potrošiti manje od prijašnjih korisnika, prosječan prihod po korisniku se smanjuje. Drugim riječima, ukupan prihod operatera raste sporije nego ukupan broj korisnika. Implementatori telekomunikacijskih rješenja - tvrtke koje nude usluge razvoja, instalacije i održavanja telekomunikacijskih sustava. Na osnovi partnerskih ugovora sklopljenim s vodećim proizvođačima opreme u mogućnosti su osigurati stručnu i kvalitetnu podršku korisnicima svojih usluga. Trend 3.: Kako bi mogli koristiti nove telekomunikacijske usluge, korisnici su primorani kupovati korisničku opremu, što dovodi do povećanja prihoda distributera telekomunikacijske opreme. Za korištenje mobilnih podatkovnih usluga korisnik mora imati mobilni telefon koji to omogućuje. Kako bi mogli koristiti IPTV uslugu, korisnici moraju imati set-top box uređaje. Kako bi bili u mogućnosti primati signal WiMAX mreže, korisnici moraju posjedovati odgovarajući prijemnik. Korisničku opremu moguće je kupiti izravno od distributera ili njegovog partnera te posredstvom operatera koji takvu opremu nudi po povoljnijim cijenama u okviru tzv. bundle paketa. Trend 4.: Kako bi bili u stanju odgovoriti na potrebe povećanog broja korisnika, kao i korisnika s većim zahtjevima, operateri su prisiljeni povećati kapacitete svojih sustava, što ponovo djeluje na povećanje prihoda proizvođača opreme, instalatera opreme te implementatora telekomunikacijskih rješenja. Uslijed sve veće konkurencije na tržištu, pojačava se i rizik za operatere od prelaska korisnika ka konkurentskim davateljima usluga. Vodeći operateri nastoje zato segmentirati svoje korisničke baze, prepoznati najizdašnije korisnike, ponuditi im napredne pakete usluga po povoljnijim cijenama te ih na taj način vezati za sebe na duži rok. Ovakva nastojanja operateri nisu u mogućnosti ostvariti ukoliko ne raspolažu prikladnom telekomunikacijskom infrastrukturom. Opisani trendovi shematski su prikazani u Grafikonu 1. Sukladno svemu gore navedenom, cjelokupan hrvatski telekomunikacijski sektor trebao je tijekom 2006. godine uživati u zdravim stopama rasta. Ostvarene bi stope, doduše, trebale biti nešto manje od onih koje su se mogle ostvariti u idealnim uvjetima. Što se tiče pojedinih segmenata, probleme bi eventualno mogli osjetiti proizvođači telekomunikacijske opreme, ponajviše zahvaljujući smanjenim ulaganjima dvaju vodećih mobilnih operatera. Provjerimo da li brojčani pokazatelji potvrđuju ovakav scenarij. Cjelokupna hrvatska telekomunikacijska industrija Tijekom 2006. godine hrvatske su telekomunikacijske tvrtke ostvarile ukupan prihod od 20.845 milijardi kuna. (Jednako kao i prošlih godina, ovdje je nužno napomenuti kako se radi o nekonsolidiranim ukupnim prihodima poslovnih subjekata. Tako, primjerice, prihod tvrtke HT-Hrvatske Telekomunikacije uključuje i prihod koji je ostvarila tvrtka kćer T-Mobile Hrvatska. Rezultati tvrtke T-Mobile prikazani su u zasebnom retku tablice te na taj način dva puta uračunati u ukupne prihode sektora. Osim toga, rezultati svih operatera uključuju prihode od interkonekcijskih naknada koje stoga u ukupnom prihodu sudjeluju s dvostruko većom vrijednošću od stvarno ostvarene.) U odnosu na rezultat ostvaren tijekom 2005. godine, prihodi telekomunikacijskog sektora narasli su za 5,7%. Nužno je istaknuti kako je spomenuta stopa rasta niža za približno jedan postotni bod od stope ostvarene u 2005. te za dva boda od one zabilježene u 2004. godini, što upućuje na nastavak trenda usporavanja dinamike širenja ovog sektora. Osim toga, prihodi telekomunikacijskog sektora prošle su godine rasli približno tri puta sporije od rasta prihoda cjelokupnog hrvatskog gospodarstva (15,8%). Sukladno pripremljenoj klasifikaciji, hrvatska se telekomunikacijska industrija na kraju 2006. sastojala od ukupno 188 poslovnih subjekata, što je za deset manje od brojke zabilježene na kraju prethodne godine. Broj sudionika telekomunikacijskog tržišta i dalje ostaje relativno malen u usporedbi s, primjerice, informatičkom industrijom, što predstavlja odraz polustoljetne tendencije ka monopolizaciji i koncentraciji ovog dijela gospodarstva. Tendencija ka koncentraciji nacionalnog telekomunikacijskog tržišta ogleda se i kroz strukturu ostvarenih prihoda, gdje najveća domaća telekomunikacijska tvrtka, zajedno s kćerkom T-Mobile, ostvaruje više od polovice, a pet najvećih tvrtki približno devet desetina ukupnog prihoda. Nakon niza godina u kojima je hrvatski telekomunikacijski sektor bilježio pad broja zaposlenih, 2006. godina je napokon donijela preokret. Ukupan broj zaposlenika na kraju je godine dosegao 14.098, što predstavlja povećanje za nešto manje od 1% u odnosu na godinu ranije. Najvažniji uzrok promjene trenda zasigurno je usporena dinamika smanjivanja broja radnika u najvećoj hrvatskoj telekomunikacijskoj tvrtki. Drugim riječima, T-HT je prošle godine ugasio približno 400 radnih mjesta, umjesto uobičajenih 1000. Kako je brzina stvaranja novih radnih mjesta u drugim tvrtkama ostala približno jednaka kao u godini ranije, rezultat je na kraju ipak ispao pozitivan. TOP 50 hrvatske telekomunikacijske industrije Grafikon 1. Posljedice liberalizacije na nacionalnom telekomunikacijskom tržištu Izvor: InfoTrend, 2007. 156/12/2007 U 2005. godini pedeset najvećih hrvatskih telekomunikacijskih tvrtki ostvarilo je ukupan prihod od 20.686 milijardi kuna. Njihova dobit prije oporezivanja dosegla je 4961 milijarde kuna. Ukupan broj zaposlenih u spomenutim tvrtkama popeo se na 13.696. Drugim riječima, spomenuta su pedesetorica u godinu dana uvećala svoj prihod za 5,7%, dobit za 12,3% te broj zaposlenih za 0,8%. Ove su tvrtke imale dominantnu ulogu unutar cjelokupnog hrvatskog telekomunikacijskog sektora, ostvarivši 99,2% ukupnih prihoda, zaradivši 99,7% ukupne dobiti te uposlivši 97,1% od ukupnog broja zaposlenih u ovoj gospodarskoj grani. Tablica 2 predstavlja popis pedeset najvećih hrvatskih telekomunikacijskih tvrtki rangiranih prema prihodu ostvarenom tijekom 2006. godine. Tablica također sadrži informacije o ostvarenoj dobiti nakon oporezivanja i broju djelatnika zaposlenih u ovim tvrtkama na kraju prošle godine. Pri- InfoTrendTOP50 Godišnji pregled telekom industrije u Hrvatskoj Tablica 2. TOP 50 hrvatskih telekomunikacijskih tvrtki prema ukupnom prihodu ostvarenom u 2006. godini Table 2. Top 50 Croatia’s Telecomunication Companies by Size of Revenue Generated in 2006. NAZIV / COMPANY Ukupni prihod Total revenue 2005 2006 Dobit nakon poreza Profit after taxes 2005 2006 Broj zaposlenih Number of employees 2005 2006 1 HT - HRVATSKE TELEKOMUNIKACIJE D.D. 2 T-MOBILE HRVATSKA D.O.O. 3.893.259.741 4.181.796.314 1.286.162.640 4 ERICSSON NIKOLA TESLA D.D. ZAGREB 1.808.951.760 1.810.586.439 268.402.315 5 SIEMENS d.d. 1.562.618.723 1.704.285.146 85.968.908 233.555.242 260.618.837 1.597.749 14.220.874 189.961.616 0 90.753.612 114.526.878 128.728.976 78.047.102 1.222.847.360 987 1.013 264.520.161 1.269 1.344 124.386.897 1.248 1.378 4.175.918 394 412 0 226 263 1.951.932 1.975.695 16 17 90.452.794 1.867.830 2.491.142 17 18 78.188.295 2.211.598 0 110 117 40.422.041 57.919.966 0 0 77 85 6.404.304 45.901.453 0 0 70 117 20 36 D.O.O. 31.304.659 30.775.297 217.587 235.816 9 10 21 ELEKTROKEM D.O.O. 27.785.865 29.454.057 2.513.582 5.367.587 53 53 22 MARKOTTEL D.O.O. 18.683.583 26.771.924 1.646.415 1.847.324 34 42 23 CATV ELEKTRONIK D.O.O. 26.210.868 26.464.344 822.828 1.775.395 16 18 24 MICRO-LINK D.O.O. 19.226.062 25.573.889 2.278.940 3.708.256 10 16 17.019.131 22.335.872 4.778.147 5.851.915 18 22 28 STEINER D.O.O. 18.853.179 21.665.084 858.192 299.617 31 30 29 MARK 2 D.O.O. 23.586.928 20.147.355 207.343 166.402 13 13 30 ADRIATIC KABEL D.O.O. 11.069.643 19.890.931 442.040 0 23 30 31 RETEL D.O.O. 18.959.735 19.389.659 120.552 145.121 54 49 32 PRISTAN D.O.O. 20.405.865 16.807.440 362.953 274.141 11 11 33 ELEKTROMAGIC D.O.O. 15.638.005 16.551.470 161.233 0 4 4 34 AMIS TELEKOM D.O.O. 14.237.302 16.549.562 356.861 0 17 26 35 ISKRATRADE D.O.O. 13.168.793 14.438.827 229.501 287.570 12 10 36 HELD D.O.O. 12.407.607 14.215.830 630.237 916.929 12 12 37 PREKVRŠJE SVJETLOVOD D.O.O. 4.634.166 13.242.236 1.306.524 4.368.619 2 12 38 SUPRA NET PROJEKT D.O.O. 6.668.436 13.234.248 254.910 631.198 3 4 39 KRON D.O.O. 14.359.314 12.843.559 6.564.302 6.729.058 13 13 40 GLOBAL NET GRUPA D.D. 17.218.685 11.308.733 0 0 16 16 3 VIPNET D.O.O. 6 MOBIS-ELECTRONIC D.O.O. 7 TELE2 D.O.O. 8 ODAŠILJAČI I VEZE D.O.O. 9 OT OPTIMA TELEKOM 10 SE-MARK D.O.O. 12 INTELKOM D.O.O. 13 ISKON INTERNET D.D. 14 VOLEX D.O.O. 15 ALEA D.O.O. 16 DCM D.O.O. 18 PORTUS D.O.O. 19 VODATEL D.O.O. 25 METRONET TELEKOMUNIKACIJE D.D. 26 CROATEL D.O.O. 27 KATE-KOM D.O.O. 42 VATEL D.O.O 6.120.868 10.241.090 277.659 417.921 8 9 12.374.350 10.050.341 1.018.791 1.081.199 20 17 3.750.935 9.721.111 541.073 2.918.299 7 10 354.274 8.999.794 6.792 78.278 0 0 5.422.212 7.555.049 31.469 22.982 16 19 47 TELCOMPACT D.O.O. 4.021.159 6.956.257 203.155 887.339 7 7 48 NETIKS D.O.O. 5.592.008 6.519.638 49.794 566.625 9 8 15.991 5.834.228 0 65.819 0 6 6.718.227 5.758.175 0 100.605 0 0 19.507.608.900 20.641.331.967 4.418.751.197 4.961.563.972 13.321 13.429 43 BEL TEL D.O.O. 44 MARGON MEDIA D.O.O. 45 VM TELEKOM D.O.O. 46 TENEO D.O.O. 49 VITELON TELEKOMUNIKACIJE D.O.O. 50 AT&T GLOBAL NETWORK SERVICES HRVATSKA D.O.O. Ukupno / Total InfoTrendTOP50 156/12/2007 InfoTrend TOP50 družene informacije o prihodu, dobiti i broju zaposlenika za 2005. godinu omogućavaju odgovarajuće usporedbe. Razdijelimo li najvećih pedeset telekomunikacijskih tvrtki s obzirom na dominantni oblik djelatnosti (pružatelji telekomunikacijskih usluga, proizvođači telekomunikacijske opreme, distributeri telekomunikacijske opreme i komponenti, implementatori telekomunikacijskih rješenja te instalateri telekomunikacijske opreme) dolazimo do informacije o udjelu pojedinih kategorija poslovnih subjekata u ukupnom prihodu kojeg je pedeset najvećih hrvatskih telekomunikacijskih tvrtki ostvarilo tijekom 2006. godine. Za potrebe analize, Slika 1 nudi i informaciju o razdiobi prihoda između ovih pet segmenata u prethodnoj kalendarskoj godini. Razvrstavanje tvrtki na spomenutih pet kategorija nije nimalo jednostavan zadatak. Primjerice, postoji velik broj poslovnih subjekata koji distribuiraju proizvode određenog proizvođača na domaćem tržištu te ih istovremeno instaliraju i održavaju. U takvim slučajevima, pristupili smo analizi njihovih poslovnih modela te ih, već prema tome koji segment poslovanja donosi dominantan dio prihoda, razvrstali u pripadajuće kategorije. U odnosu na prošlogodišnju grafičku usporedbu primjetno je nekoliko bitnijih promjena. Tako operateri bilježe značajan rast udjela u ukupnom prihodu telekomunikacijskog sektora, dok udio prihoda proizvođača telekomunikacijske opreme istodobno značajno opada. Distributeri telekomunikacijske opreme i komponenti te implementatori telekomunikacijskih rješenja ostvarili su potpuno istovjetan rezultat kao i prošle godine. Posljednja bitna razlika odnosi se na ulazak instalatera telekomunikacijske opreme u klub pedeset najvećih, doduše sa sićušnim udjelom u ukupnom prihodu. Sljedećih pet poglavlja donosi rang-liste najvećih sudionika u pojedinim segmentima hrvatskog telekomunikacijskog tržišta. Pored podataka o ukupnom prihodu, tablice donose i stope njegovoga rasta u odnosu na prethodnu godinu te informaciju o prosječnom prihodu po zaposleniku. Pružatelji telekomunikacijskih usluga U skupinu pedeset najuspješnijih hrvatskih telekomunikacijskih tvrtki za 2006. godinu uspjelo se ugurati čak dvadeset pružatelja usluga. Povećanje njihova broja može se smatrati izravnom posljedicom liberalizacije tržišta telekomunikacijskih usluga. S obzirom na ostvareni ukupni prihod, ovaj segment predstavlja daleko najuspješniji dio nacionalne telekomunikacijske industrije. Osim toga, ova grupa ostvarila je daleko najznačajniji dio dobiti i zapošljavala najveći broj radnika. Porast prihoda od 7,4% u ovome segmentu ponajprije je posljedica povećanja broja korisnika i jačanja prometa u mobilnim mrežama. Tome u prilog govore i podaci Državnog zavoda za statistiku, otkrivajući kako je broj minuta razgovora obavljenih u mobilnim mrežama povećan za približno 46% u odnosu na prethodnu godinu. Nasuprot tome, broj minuta u fiksnoj mreži je opao za gotovo 14% na godišnjoj bazi. Analiza popisa davatelja telekomunikacijskih usluga koji su se uspjeli plasirati u TOP 50 u 2006. i 2005. godini otkriva tek nekoliko bitnih promjena. Jednako kao i prošle godine, na vrhu se nalaze vodeći fiksni i mobilni operateri: HT-Hrvatske Telekomunikacije, T-Mobile, VIPnet i pružatelj infrastrukturnih komunikacijskih usluga Odašiljači i veze. S popisa pedeset najvećih ispali su Kabel Net i davatelj telekomunikacijskih usluga s dodanom vrijednošću Loquor. S druge strane, na popisu su se po prvi puta našle tvrtke Metronet telekomunikacije i VIPnet usluge (davatelj usluga hostinga za članove Mobilkom Austria Grupe). Alternativni mobilni operater Tele2 te alternativni fiksni operateri OT-Optima telekom i Portus zabilježili su velike pomake prema vrhu ljestvice, dok su vodeći kabelski operateri DCM i Adriatic Kabel zadržali gotovo iste pozicije u usporedbi s godinom ranije. Proizvođači telekomunikacijske opreme Na popisu pedeset najvećih davatelja hrvatskih telekomunikacijskih tvrtki za 2006. godinu nalazi se tek pet proizvođača. U usporedbi s prethodnom godinom, broj proizvođača u TOP 50 je smanjen za jedan, zbog ispadanja tvrtke Z-Link. Činjenica da su proizvođači „rijetka zvjerka” u hrvatskoj telekomunikacijskoj industriji, uz primjedbu da su i oni koji su uspjeli ući na listu dobar dio svojih prihoda ostvarili plasmanom proizvoda na tržišta stranih država, potvrđuje kako uvozna pošast nije zaobišla ni ovaj dio hrvatskog gospodarstva. U prilog tome govori i činjenica da su proizvođači jedini segment teleko- 156/12/2007 Tablica 2a. TOP 50 telekomunikacijskih tvrtki po dobiti Table 2a. TOP 50 Telecommunication Companies by Profit NAZIV / COMPANY 1 HT - HRVATSKE TELEKOMUNIKACIJE D.D. 2 T-MOBILE HRVATSKA D.O.O. 3 VIPNET D.O.O. 4 Dobit Profit 2006 Rang po Ukupnom Prihodu RANK BY REVENUE 2006 Rang po broju zaposlenih RANK BY Number of Employees 2006 1.222.847.360 2 4 ERICSSON NIKOLA TESLA D.D. ZAGREB 264.520.161 4 3 5 SIEMENS d.d. 124.386.897 5 2 6 MOBIS-ELECTRONIC D.O.O. 8 KRON D.O.O. 6.729.058 39 32 9 CROATEL D.O.O. 5.851.915 26 26 10 ELEKTROKEM D.O.O. 5.367.587 21 15 11 PREKVRŠJE SVJETLOVOD D.O.O. 4.368.619 37 64 12 ODAŠILJAČI I VEZE D.O.O. 4.175.918 8 7 13 MICRO-LINK D.O.O. 3.708.256 24 30 14 MARGON MEDIA D.O.O. 2.918.299 44 66 INTELKOM D.O.O. 2.491.142 12 28 15 16 17 18 VOLEX D.O.O. 19 SE-MARK D.O.O. 1.975.695 10 29 20 MARKOTTEL D.O.O. 1.847.324 22 20 21 CATV ELEKTRONIK D.O.O. 1.775.395 23 28 22 23 KATE-KOM D.O.O. 24 BEL TEL D.O.O. 1.081.199 43 29 25 HELD D.O.O. 916.929 36 33 26 TELCOMPACT D.O.O. 887.339 47 70 KOM SAT D.O.O. 868.720 73 34 691.115 87 35 27 28 29 30 KONEKTIRA D.O.O 31 32 ALEA D.O.O. 33 DOMIFON D.O.O. 34 35 POSLUH D.O.O. 36 RING DATACOM D.O.O. 641.416 53 33 37 SUPRA NET PROJEKT D.O.O. 631.198 38 41 38 LUMISS D.O.O. 613.483 51 32 39 AUTOMAT TN D.O.O. 574.254 96 42 40 NETIKS D.O.O. 566.625 48 37 41 TANGO KOMUNIKACIJE D.O.O. 550.727 67 26 VATEL D.O.O 417.921 42 36 45 MIKROTREND D.O.O. 388.833 100 43 46 KDS D.O.O. 328.003 60 35 47 Z-LINK D.O.O. 48 DENCRO 49 TELEMONT D.O.O. 300.695 91 38 50 STEINER D.O.O. 299.617 28 23 42 43 44 InfoTrendTOP50 Godišnji pregled telekom industrije u Hrvatskoj Tablica 3. Članovi TOP 50 hrvatskih telekomunikacijskih tvrtki, segment pružatelja telekomunikacijskih usluga Table 3. Telecommunications Services Operators that Managed to Qualify for the Croatia’s Telecommunications Top 50 for the Year 2006 NAZIV/ COMPANY MJESTO UKUPNI PRIHOD Total revenue 2005 - HRVATSKE TELEKOMUNIKACIJE 1 HT D.D. ZAGREB 2 T-MOBILE HRVATSKA D.O.O. ZAGREB 3 VIPNET D.O.O. ZAGREB 4 TELE2 D.O.O. ZAGREB 5 ODAŠILJAČI I VEZE D.O.O. 6 OT OPTIMA TELEKOM Rast Growth 2006 3.893.259.741 4.181.796.314 ZAGREB 233.555.242 ZAGREB 14.220.874 7 ISKON INTERNET D.D. ZAGREB 8 DCM D.O.O. ZAGREB 06/05 DOBIT NAKON POREZA Profit after taxes 2005 2006 BROJ ZAPOSLENIH Prihod po zaposlenom u Number of employees Revenue per 2005 employee 2006 2006. 7,4% 1.286.162.640 1.222.847.360 987 1.013 4.128.131 260.618.837 11,6% 1.597.749 4.175.918 394 412 632.570 189.961.616 1235,8% 0 0 226 263 722.288 78.047.102 78.188.295 0,2% 2.211.598 0 110 117 668.276 40.422.041 57.919.966 43,3% 0 0 77 85 681.411 6.404.304 45.901.453 616,7% 0 0 70 117 392.320 ZAGREB 18.683.583 26.771.924 43,3% 1.646.415 1.847.324 34 42 637.427 14 CROATEL D.O.O. ZAGREB 17.019.131 22.335.872 31,2% 4.778.147 5.851.915 18 22 1.015.267 15 ADRIATIC KABEL D.O.O. ZAGREB 11.069.643 19.890.931 79,7% 442.040 0 23 30 663.031 16 AMIS TELEKOM D.O.O. ZAGREB 14.237.302 16.549.562 16,2% 356.861 0 17 26 636.522 17 GLOBAL NET GRUPA D.D. ZAGREB 17.218.685 11.308.733 -34,3% 0 0 16 16 706.796 18 MARGON MEDIA D.O.O. VELIKA GORICA 3.750.935 9.721.111 159,2% 541.073 2.918.299 7 10 972.111 19 VM TELEKOM D.O.O. RIJEKA 354.274 8.999.794 2440,3% 6.792 78.278 0 0 GLOBAL NETWORK SERVICES 20 AT&T HRVATSKA D.O.O. ZAGREB 6.718.227 5.758.175 -14,3% 0 100.605 0 0 14.728.632.771 15.819.520.397 7,4% 3.978.793.121 4.478.396.088 9.848 9.717 10 PORTUS D.O.O. SPLIT 11 VODATEL D.O.O. 12 MARKOTTEL D.O.O. TELEKOMUNIKACIJE 13 METRONET D.D. Ukupno / TOTAL 1.628.025 Tablica 4. Članovi TOP 50 hrvatskih telekomunikacijskih tvrtki, segment proizvođača telekomunikacijske opreme Table 4. Telecommunications Equipment Vendors that Managed to Qualify for the Croatia’s Telecommunications Top 50 for the Year 2006 NAZIV/ COMPANY MJESTO UKUPNI PRIHOD Total revenue 2005 Rast Growth 2006 06/05 DOBIT NAKON POREZA Profit after taxes 2005 2006 BROJ ZAPOSLENIH Prihod po zaposlenom u Number of employees Revenue per 2005 employee 2006 2006. 1 ERICSSON NIKOLA TESLA D.D. ZAGREB ZAGREB 1.808.951.760 1.810.586.439 0,1% 268.402.315 264.520.161 1.269 1.344 1.347.163 2 SIEMENS d.d. ZAGREB 1.562.618.723 1.704.285.146 9,1% 85.968.908 124.386.897 1.248 1.378 1.236.782 3 VOLEX D.O.O. ZAGREB 5 ELEKTROKEM D.O.O. VUGROVEC DONJI 27.785.865 29.454.057 6,0% 2.513.582 5.367.587 53 53 555.737 3.662.022.301 3.608.315.941 -1,5% 371.343.585 396.405.369 3.001 3.229 1.117.472 Ukupno munikacijske industrije čiji su prihodi zabilježili pad na godišnjoj razini. Iako malobrojni u usporedbi s ostalim segmentima, proizvođači su ostvarili više od šestine ukupnih prihoda i zapošljavali gotovo četvrtinu od ukupnog broja zaposlenih u pedeset najvećih hrvatskih telekomunikacijskih tvrtki. Ovim segmentom hrvatskog telekomunikacijskog tržišta već godinama prevladavaju lokalne podružnice velikih globalnih igrača, njemačkog Siemensa i švedskog Ericssona. Važno je naglasiti da je hrvatski dio Siemensa pretežito, a Ericssona djelomično, angažiran na proizvodnji telekomunikacijske infrastrukturne opreme i uređaja namijenjenih krajnjim korisnicima. Distributeri telekomunikacijske opreme i komponenti Popis pedeset najvećih uključuje devet distributera telekomunikacijske opreme i komponenti. U usporedbi s prošlom godinom, broj distribute- InfoTrendTOP50 ra u ovome klubu smanjen je za dva. Ukupan prihod ovih devet tvrtki približio se milijardi kuna, što čini približno 5% ukupnog prihoda pedeset najvećih. Ovaj je rezultat zadržao distributere na trećem mjestu među segmentima telekomunikacijskog sektora, uz ogroman zaostatak za operaterima i proizvođačima, ali i uz značajnu prednost nad implementatorima i instalaterima telekomunikacijske opreme. Unutar ovog segmenta nisu zabilježeni značajniji pomaci. Mobis Electronic je zadržao mjesto vodećeg distributera telekomunikacijske opreme u Hrvatskoj, što potvrđuje popularnost Nokia mobitela među domaćim korisnicima. Intelkom (distributer Panasonic, Nokia, Samsung i Logitech uređaja) pada na četvrto, Se-Mark (distributer Panasonic mobilnih telefona) i Ram 3 (distributer Motorola i Panasonic mobitela) penju se stepenicu više, dok je Alea (još jedan Panasonicov distributer) zadržala peto mjesto među distributerima. 156/12/2007 InfoTrend TOP50 Tablica 5. Članovi TOP 50 hrvatskih telekomunikacijskih tvrtki, segment distributera telekomunikacijske opreme i komponenti Table 5. Telecommunications Equipment Distributors that Managed to Qualify for the Croatia’s Telecommunications Top 50 for the Year 2006 NAZIV/ COMPANY MJESTO UKUPNI PRIHOD Total revenue 2005 2006 Rast Growth 06/05 DOBIT NAKON POREZA Profit after taxes 2005 2006 BROJ ZAPOSLENIH Number of employees 2005 2006 Prihod po zaposlenom u Revenue per employee 2006. 1 MOBIS-ELECTRONIC D.O.O. ZAGREB 2 SE-MARK D.O.O. SESVETE 90.753.612 114.526.878 26,2% 1.951.932 1.975.695 16 17 6.736.875 4 INTELKOM D.O.O. ZAGREB 128.728.976 90.452.794 -29,7% 1.867.830 2.491.142 17 18 5.025.155 5 ALEA D.O.O. ZAGREB 6 MARK 2 D.O.O. SPLIT 23.586.928 20.147.355 -14,6% 207.343 166.402 13 13 1.549.797 7 PRISTAN D.O.O. ZAGREB 20.405.865 16.807.440 -17,6% 362.953 274.141 11 11 1.527.949 8 ELEKTROMAGIC D.O.O. SPLIT 15.638.005 16.551.470 5,8% 161.233 0 4 4 4.137.868 9 ISKRATRADE D.O.O. RIJEKA 13.168.793 14.438.827 9,6% 229.501 287.570 12 10 1.443.883 887.881.615 956.327.142 7,7% 50.176.419 60.483.326 195 206 4.642.365 Ukupno Tablica 6. Članovi TOP 50 hrvatskih telekomunikacijskih tvrtki, segment implementatora telekomunikacijskih rješenja Table 6. Telecommunications Solution Implementers that Managed to Qualify for the Croatia’s Telecommunications Top 50 for the Year 2006 NAZIV/ COMPANY 1 36 D.O.O. MJESTO UKUPNI PRIHOD Total revenue 2005 2006 Rast Growth 06/05 DOBIT NAKON POREZA Profit after taxes 2005 2006 BROJ ZAPOSLENIH Prihod po zaposlenom u Number of employees Revenue per 2005 2006 employee 2006. STRAHONINEC 31.304.659 30.775.297 -1,7% 217.587 235.816 9 10 3.077.530 2 CATV ELEKTRONIK D.O.O. ZAGREB 26.210.868 26.464.344 1,0% 822.828 1.775.395 16 18 1.470.241 3 MICRO-LINK D.O.O. ZAGREB 19.226.062 25.573.889 33,0% 2.278.940 3.708.256 10 16 1.598.368 4 KATE-KOM D.O.O. ZAGREB 5 STEINER D.O.O. BREZJE 18.853.179 21.665.084 14,9% 858.192 299.617 31 30 722.169 6 RETEL D.O.O. ZAGREB 18.959.735 19.389.659 2,3% 120.552 145.121 54 49 395.707 7 HELD D.O.O. ZAGREB 12.407.607 14.215.830 14,6% 630.237 916.929 12 12 1.184.653 8 SUPRA NET PROJEKT D.O.O. ZAGREB 6.668.436 13.234.248 98,5% 254.910 631.198 3 4 3.308.562 9 KRON D.O.O. SPLIT 14.359.314 12.843.559 -10,6% 6.564.302 6.729.058 13 13 987.966 11 VATEL D.O.O SPLIT 6.120.868 10.241.090 67,3% 277.659 417.921 8 9 1.137.899 12 BEL TEL D.O.O. OSIJEK 12.374.350 10.050.341 -18,8% 1.018.791 1.081.199 20 17 591.197 13 TENEO D.O.O. OSIJEK 5.422.212 7.555.049 39,3% 31.469 22.982 16 19 397.634 14 TELCOMPACT D.O.O. SPLIT 4.021.159 6.956.257 73,0% 203.155 887.339 7 7 993.751 15 NETIKS D.O.O. ZAGREB 5.592.008 6.519.638 16,6% 49.794 566.625 9 8 814.955 16 VITELON TELEKOMUNIKACIJE D.O.O. SAMOBOR 15.991 5.834.228 36384,4% 0 65.819 0 6 972.371 224.438.047 243.926.251 8,7% 17.131.548 21.910.570 275 265 920.476 Ukupno Tablica 7. Članovi TOP 50 hrvatskih telekomunikacijskih tvrtki, segment instalatera telekomunikacijske opreme Table 7. Telecommunications Equipment Fitters that Managed to Qualify for the Croatia’s Telecommunications Top 50 for the Year 2006 NAZIV/ COMPANY MJESTO UKUPNI PRIHOD Total revenue 2005 1 PREKVRŠJE SVJETLOVOD D.O.O. Ukupno 156/12/2007 PREKVRŠJE 2006 Rast Growth 06/05 DOBIT NAKON POREZA Profit after taxes 2005 2006 BROJ ZAPOSLENIH Prihod po zaposlenom u Number of employees Revenue per 2005 2006 employee 2006. 4.634.166 13.242.236 185,8% 1.306.524 4.368.619 2 12 1.103.520 4.634.166 13.242.236 185,8% 1.306.524 4.368.619 2 12 1.103.520 InfoTrendTOP50 Godišnji pregled telekom industrije u Hrvatskoj Implementatori telekomunikacijskih rješenja Instalateri telekomunikacijske opreme Na osnovu prihoda ostvarenog tijekom 2006. godine, na popisu pedeset najvećih hrvatskih telekomunikacijskih poduzeća uvršteno je petnaest implementatora. Iako drugi najveći po brojnosti, ovaj je segment u najmanjoj mjeri pridonio ukupnom prihodu industrije u 2006. godini, ostvarivši ukupan prihod od oko 237 milijuna kuna. Rast prihoda ovog segmenta bio je tijekom 2006. tek nešto veći od rasta cjelokupnog telekomunikacijskog sektora. Popis najvažnijih hrvatskih implementatora za 2006. godinu uključuje tvrtke 36, CATV- Elektronik, Micro-Link, Kate-kom, Steiner i Retel. Šest navedenih tvrtki zauzimalo je šest vodećih mjesta i na prošlogodišnjem popisu, doduše u nešto izmijenjenom redoslijedu. Kao što je već spomenuto, instalateri telekomunikacijske opreme ove su godine po prvi puta ušli na popis pedeset najvećih telekomunikacijskih tvrtki. Instalater kojem je to pošlo za rukom nosi ime Prekvršje svjetlovod, a bavi se polaganjem optičkih kabela za potrebe fiksnih operatera. S više od 13 milijuna kuna prihoda, više od 4 milijuna kuna dobiti i 12 zaposlenih, Prekvršje svjetlovod zauzima ukupno 38. mjesto na ljestvici najvećih hrvatskih telekomunikacijskih tvrtki za 2006. Impozantan rast prihoda ove tvrtke (od gotovo 200%) svjedoči kako je ona iznimno dobro iskoristila potrebe ponajprije novih fiksnih operatera za izgradnjom vlastite telekomunikacijske infrastrukture. Slika 1. Udio pojedinih segmenata u ukupnom prihodu TOP 50 hrvatskih telekomunikacijskih tvrtki, usporedba rezultata za godine 2005. i 2006. Zaključak i pogled na 2007. Brojke su potvrdile: scenarij izložen u uvodnom dijelu ovog rada pokazao se ispravnim. Dakle, prošla je godina donijela napredak, kako cjelokupnom hrvatskom telekomunikacijskom sektoru, tako i većini njegovih segmenata. Ipak, nekoliko vječnih pitanja ostaje otvoreno: Je li moglo bolje? Je li konkurencija među operaterima već mogla biti oštrija? Je li već mogao biti riješen problem DTK infrastrukture? Je li prodor širokopojasnih internetskih veza u nas već mogao biti na razini prosjeka Europske unije? Je li prihod telekomunikacijskog sektora mogao rasti barem onoliko koliko su rasli prihodi cjelokupnog gospodarstva? Je li i broj zaposlenih u telekomunikacijskom sektoru mogao rasti brže? Je li broj proizvođača telekomunikacijske opreme, ili još bolje, njihov udio u ukupnom prihodu sektora, mogao biti i veći? Odgovore na neka od ovih pitanja donijela je već ova 2007. godina. Od početka tekuće godine svjedočili smo tako sljedećim doga- InfoTrendTOP50 đajima: okrupnjavanju alternativnih operatera kroz preuzimanja (Metronet preuzeo Vodatel); ulasku stranih kompanija na domaće telekomunikacijsko tržište preuzimanjem postojećih kabelskih operatera (austrijski B-net kupio DCM); izlasku novih operatera na tržište pristupa Internetu (Voljatel ponudio ADSL uslugu); dokapitalizaciji putem izdavanja obveznica (Optima Telekom); dogovorima između gradova, T-HT-a i alternativnih operatera oko korištenja DTK infrastrukture; pojavi prvog virtualnog mobilnog operatera; te prvom ratu cijenama između mobilnih operatera (Tele2 i VIPnetov Tomato) itd. Dakle, stvari se ipak pokreću. Svaka nova godina znači novi korak naprijed. Vjetrovi liberalizacije ipak nose naš telekomunikacijski brod prema željenom odredištu. Možda taj brod ne plovi onom brzinom kojom bismo željeli, ali na željeno će odredište sigurno stići. Pitanje je samo koliko će mu vremena za to trebati. 156/12/2007 InfoTrend TOP50 In the Wake of Liberalisation Croatian Telecommunications Industry in 2006 Scenario of Development of Telecommunications Industry for Year 2006 If Croatian telecommunications industry is imagined as a sailing ship, its last year’s progress could be described as follows: passing through an unstable weather conditions, the ship sailed relatively slowly, but still holding the right course. If we leave the nautical terminology, the description would look like this: together with numerous developments that lead the market toward liberalization and an increase of competition between participants, a number of inhibitors weakened the positive trends and postponed the materialization of expected positive effects. Concretely, what developments the country’s telecommunications industry witnessed during 2006? The most important among them are listed in the table 1 below. As a consequence of the above-mentioned developments, the Croatia’s telecommunications market should have witnessed the following trends: Table 1 – The Most Important Developments at the Croatian Telecommunications Market in 2006 Month Development at the country’s telecommunications market January May Tele2 introduced m-parking service and offered it to inhabitants of 21 Croatian cities Novi-Net launched operations and became first WiMAX services provider in Croatia Amis Telekom became the country’s fourth broadband Internet access provider Vipnet upgraded its UMTS network with HSDPA technology as the first in Croatia T-Hrvatski Telekom acquired local ISP Iskon Internet for EUR 13,7 million June VIPnet introduced low-cost service brand Tomato with a prefix 092 July November Metronet became the first telco in the country to finance itself through bonds issue Agency for Telecommunications started a public discussion with an aim to solve the problem related to ownership of distribution telecommunications duct T-Com launched IPTV, Vipnet launched fixed telephony over mobile network (Homebox) service Number portability service for fixed and mobile telecommunications networks introduced The market regulator annulled WiMAX concession for Iskon Internet and granted it to VIPnet December Adriatic Kabel acquired Globalnet February March April August September October Source: InfoTrend, 2007. In addition to this, the logbook includes a number of developments that could not be assigned to a specific month, because they influenced the market environment during whole year, or at least during one part of it. These included the following winds that pushed our telecommunications ship to the right direction: an increase in number of mobile telephony subscriptions, growth of mobile voice and SMS traffic, rise in number of broadband access users, the prolongation of WiMAX licensing process, continued investments of operators into own network infrastructure, talks on national broadband strategy, etc. On the other hand, sea streams that slowed the speed of sailing consisted of conflicts over distribution telecommunications duct ownership, slow pace of local loop unbundling (the problem was finally solved at the end of the year), decline of voice traffic in fixed networks, conflict between the incumbent and users associations related to unjustified dialer expenses, etc. 156/12/2007 Trend 1: As the liberalization process continues, number of operators is growing. In order to become able to introduce their commercial offerings, alternative operators must build their own networks. The result is an increase in revenues of telecommunications equipment vendors, equipment fitters, and implementers of telecommunications solutions. During first nine months of 2006, Croatian alternative fixed-line operators were only able to use carrier pre-selection and number portability services (because they were allowed to access the local loop in the last quarter of the year). Aiming to make their business operations cost-effective, the companies were forced to undertake significant investments into development of own network systems. As a consequence, the revenues of network equipment vendors, equipment fitters, and solution implementers should have increased notably. On the other hand, the capital expenditures of two leading mobile operators declined, thus probably lowering the expected growth rates by few percentage points. What also should be taken into account is a general imports-growing tendency that affects all segments of the Croatian economy. In other words, if the equipment needed for construction of operators’ systems was imported, and not purchased from local manufacturers, the final beneficiaries were telecommunications equipment distributors. Trend 2: An increase in competition between operators lead to decline in telecommunications services tariffs. As a result, the services become affordable to larger part of population, or in other words, to those that could not used them before due to low purchasing power. The consequence is an increase in operators’ total revenues. In general, the competition between operators increased in Croatia last year. However, a huge attack on liberalization process, especially in the Internet access services segment, included T-HT’s acquiring of the country’s leading alternative ISP Iskon Internet. Still, due to T-HT’s efforts (encouraged by the respective Government bodies) to expand the usage of broadband access in the country, the consequences were not devastating for the market. As people with lower purchasing power, or those that spend less than previous users, now use telecommunications services, the average revenue per customer is decreasing. In other words, operators’ revenues rise at slower rates compared to the total number of customers. Trend 3: In order to become able to use telecommunications services, users must purchase the necessary equipment. This drives an increase in revenue of telecommunications service distributors. In order to be able to use mobile data services, a subscriber must have a mobile handset that allows the usage of such services. In order to use IPTV service, user must acquire a set-top box. In order to be able to receive WiMAX network signal, user must have an appropriate receiver. The enduser equipment is purchased directly from a distributor or its partner, and from operator that offers such equipment at discounted prices within socalled bundle packages. InfoTrendTOP50 Croatian Telecommunications Industry - Annual Report Trend 4: In order to be able to satisfy the growing needs of increased number of customers, operators are forced to expand the capacities of their network systems. Again, this fuels an increase in revenue of telecommunications equipment vendors, equipment fitters, and implementers of telecommunications solutions. As a consequence of increased competition, a risk for operators for the customers’ churning is growing. For that reason, the market’s leading operators aim to segment their customer bases, detect the most valuable among their customers, and offer them improved service packages at lower prices, thus trying to increase and prolong their loyalty. Operators that do not have at disposal an appropriate infrastructure are not capable to perform such activities. Chart 1 below elucidates the above-explained trends. The results of the tendency could also be noticed if looked at the structure of the industry’s revenues. Thus the incumbent T-HT, together with its daughter company T-Mobile, was responsible more than one half, while five largest companies generated approximately 90% of the total industry’s revenues. After a number of years in which the Croatian telecommunications industry witnessed a decline in number of employed, the year 2006 brought a change in the trend. The total number of employed reached 13,831 at the year-end, reflecting an increase of around 1% on yearly basis. The most important reason for the change in trend was the incumbent’s slowing of the pace of job cut-offs. In other words, T-HT dismissed from service some 400 employees last year, which was notably lower than 1,000 as it used to lay off during a years before. As the other companies maintained the tempo of creation of new jobs from previous years, the final result was positive. Croatian Telecommunications Industry’s TOP 50 In line with everything said above, the entire Croatian telecommunications industry should have enjoyed healthy growth in 2006. The growth rates, however, should have been somewhat lower compared to those that could have been reached in ideal market environment. Of all industry subsegments, only telecommunications equipment vendors could have faced negative growth, due to decreased capital expenditures of the country’s two leading mobile operators. But, do the figures confirm this scenario? In 2006, fifty largest Croatian telecommunications companies generated total revenue of HRK 20.641 billion. Their total profits after taxation reached HRK 4.961 billion, while the total number of employees arrived at 13,429. On yearly basis, the fifty largest companies increased their revenues by 5.8%, profit by 12.3%, and number of employees by 0.8%. These companies dominated the entire country’s telecommunications industry, as they generated 99.2% of total revenue, earned 99.7% of total profit, and employed 97.8% of the total workforce. Table 2 (see page 4) is a list of fifty largest Croatia’s telecommunications companies, ranked by the size revenue generated during 2006. The table also contains information on their profits after taxes, and number of workers they employed at the end of last year. Information on revenue, profits, and employees for the year before allow appropriate comparisons. With respect to the dominant business activity of the company, the entire Croatian telecommunications industry is divided into five segments: telecommunications services providers, equipment vendors, equipment distributors, solution implementers, and telecommunications equipment fitters. Chart 1 (see page 8) illustrates the distribution of the total 2006 revenue between the five market segments. Comparison between the two pie charts reveals few noteworthy changes. Thus the share of operators in the total industry’s revenues increased significantly compared to the last year’s result, while share of telecommunications equipment vendors declined by the same amount. Equipment distributors and solution implementers controlled exactly the same share as at the end of 2005. The last important difference includes the appearance of telecommunications equipment fitters in the industry’s TOP 50, though with a tiny market share. Total Croatia’s Telecommunications Industry Telecommunications Services Providers In 2006, the telecommunications companies operating in Croatia reached total revenues of HRK 20.801 billion. (It should be noted that the number shows total unconsolidated revenue of the industry. Thus, for example, the revenue of HT-Hrvatske Telekomunikacije, as shown in the table, also includes revenues generated by its daughter company T-Mobile Hrvatska. As the daughter company’s revenue is presented in the separate row of the table, it was twice calculated in the total sum of revenue of the telecommunications sector. Also, the results of all operators include revenues from interconnection fees, which also means that they participate in the total industry’s revenue with two times bigger amount than actually generated). On yearly basis, the total revenues of the industry went up by 5.8%. It is to be noted that the growth rate was lower by approximately one percentage point than the one achieved in 2005, and by two percentage points compared to the one witnessed in 2004. In other words, the progress of the industry continues, but the growth rates gradually decline. It is also to be noted that the revenues of the telecommunications industry increased almost three times slower compared to the growth in revenues that the total Croatian economy achieved in 2006 (15.8%). In line with the prepared classification, the Croatia’s telecommunications industry consisted of 188 companies at the end of 2006, which was ten companies less than at the end of the year before. The number of market participants remains relatively low if compared with the number of IT companies operating in the country. This is clearly a heritage of fifty-years-long tendency driving monopolization and concentration in this segment of the economy. The Croatian telecommunications industry’s TOP 50 for the year 2006 includes twenty telecommunications service providers. The increase in their number compared to the year before is a direct consequence of liberalization of the country’s telecommunications services market. Measured by the total revenue generated, this segment represents the most successful part of the national telecommunications industry. In addition, this segment gained the most profits and employed the largest share of the total workforce. The increase in revenue of 7.4% is a result of increased number of telecommunications services users and jump in total traffic that mobile networks witnessed last year. This is confirmed by the data provided by the Central Bureau of Statistics that reflected a 46% increase in mobile voice traffic compared to the year before. In contrast, fixed telephony traffic declined by almost 14% on yearly basis. Comparing to the last year’s list of operators that managed to qualify for the country’s telecommunications TOP 50, there are only a few minor changes. The same as last year, the top operators included the country’s fixed-line incumbent HT-Hrvatske Telekomunikacije, mobile operators T-Mobile and VIPnet, and provider of infrastructure communication services Odašiljači i Veze. Cable operator Kabel Net and provider of value-added telecommunications services Loquor faild to qualify for TOP 50 this year. On the other hand, the companies that joined the list for the first time this year includes alternative fixed-line telco Metronet Telekomunikacije and provider of hosting services for Mobilkom Austria Group members VIPnet Usluge. Alternative mobile operator Tele2 and alternative fixed-line operators OT-Opti- Chart 1 - The effects of liberalization at the national telecommunications market Source: InfoTrend, 2007. 10 InfoTrendTOP50 156/12/2007 InfoTrend TOP50 Chart 2 – Distribution of telecommunications industry revenue in 2005 and 2006 ma Telekom and Portus moved toward the top of the list, while the country’s leading cable TV operators DCM and Adriatic Kabel retained the positions they had at the end of the year before. (See Table 3 on page 6.) Telecommunications Equipment Vendors The list of fifty most successful telecommunications companies for the year 2006 includes only four equipment vendors. In comparison to the year before, the number of manufacturers as members of the TOP 50 decreased by one, as the company Z-Link fell of the list. The equipment manufacturers are very rare in the Croatian telecommunications industry. Furthermore, those companies generate the majority of their revenues by selling their products at foreign markets. This confirms that the growing imports tendency that affects all segments of the Croatian economy did not spared the telecommunications industry. In line with this is the fact that equipment vendors were the only segment of the telecommunications industry that witnessed a decline in total revenues last year. Although smaller than other segments by number of companies, vendors generated more than one sixth of total TOP 50 revenues and employed almost one fourth of total workforce last year. This segment is traditionally dominated by local subsidiaries of leading global equipment vendors, Siemens and Ericsson. It is to be noted that both the companies are partially involved in manufacturing of telecommunications infrastructure equipment and end-user devices. (See Table 4 on page 6.) Telecommunications Equipment Distributors Nine telecommunications equipment vendors qualified for the last year’s TOP 50. Compared to the year before, the number of such companies dropped by two. Despite that, the total revenues of these nine companies arrived very close to one billion Croatian Kuna, which was around 5% of the total revenue gained by TOP 50 telecommunications companies. This result made this segment the third largest group within the industry, with revenues at far below operators and equipment manufacturers, but far above implementers and equipment fitters. Within this segment, there were no major changes compared to the last year’s list. Mobis Electronic retained the position of leading distributor in Croatia, which confirms the popularity of Nokia handsets among Croatian mobile users. Intelkom (distributor of Panasonic, Nokia, Samsung, and Logitech products) dropped to the fourth position; Se-Mark (distributor of Panasonic mobile phones) and Ram 3 (distributor of Motorola and Panasonic handsets) climbed one step up, while Alea (another Panasonic distributor) retained the position of fifth largest distributor in the country. (See Table 5 on page 7.) Telecommunications Solution Implementers Of fifty largest Croatia’s telecommunications companies in 2006, sixteen were solution implementers. Although the second largest group by number of companies, it participated in the total TOP 50 revenue with relatively low share. The total revenue of this segment reached HRK 237 million last year and witnessed growth rate higher than the total telecommunications industry. 156/12/2007 The list of largest Croatian implementers for year 2006 includes the following companies: 36, CATV-Elektronik, Micro-Link, Kate-kom, Steiner, and Retel. The six companies held the six leading positions on the last year’s ranking as well, although in somewhat different order. (See Table 6 on page 7.) Telecommunications Equipment Fitters As already mentioned, the equipment fitters entered the list of fifty largest telecommunications companies in Croatia this year for the first time. The only such company that managed to do that was Prekvrsje svjetlovod. The company’s activity includes installation of optical cables for fixed-line operators. With revenues at above HRK 13 million, profits at more than HRK 4 million, and 12 employees, Prekvrsje svjetolovod was the 38th most successful telecommunications company in Croatia in 2006. The enormous growth in revenue of almost 200% reveals the company’s success in meeting the needs of new fixedline operators for new telecommunications infrastructure. (See Table 7 on page 7.) Conclusion and Look at 2007 The figures have confirmed: the scenario announced in the introductory part of this article is correct. So, the entire Croatian telecommunications industry, as well as the majority of its segments, progressed last year. However, some questions remain unanswered: Could the industry have done better than this? Could the competition between service operators have already been stronger? Could the problem with the distribution telecommunications duct have already been solved? Could the penetration of broadband Internet connections have already reached the EU average? Could the revenues of the telecommunications industry have grown at least as fast as the revenue of the total Croatian economy? Could the number of employees have grown faster? Could the number of telecommunications equipment vendors, or even better their share in total industry’s revenue, have grown faster? The current year has brought answers to some of these questions. Since the start of 2007, the following developments have taken place at the country’s telecommunications market: concentration in the services providers’ segment (fixed-line operator Metronet acquired local ISP Vodatel), entry of foreign companies at the local telecommunications market (B-net of Austria acquired DCM), the appearance of new operators at the Internet access market (Voljatel introduced ADSL offering), finance through bonds issue (Optima Telekom), agreements between city administrations and the incumbent on ownership and usage of distribution telecommunications duct, the appearance of the country’s first mobile virtual network operator, and the first price wars between mobile operators (Tele2 and VIPnet’s Tomato). So, the things are happening. Every year brings a step forward. The winds of liberalization are pushing our telecommunications ship toward the port it plans to reach. Perhaps the ship has not moved at the speed we would all like to see it moving, but it will unquestionably reach the desired port. Uncertain is only the time it will need to arrive there. InfoTrendTOP50 11 12 InfoTrendTOP50 156/12/2007
© Copyright 2026 Paperzz