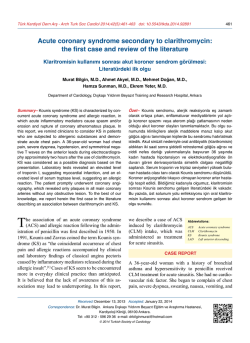
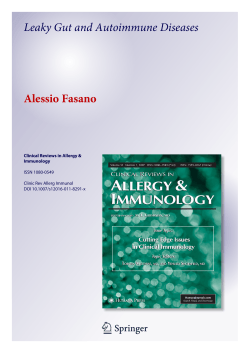
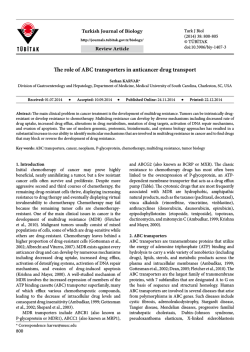
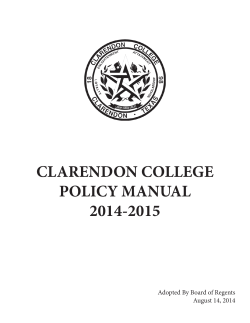
CROATICA CHEMICA ACTA CCACAA, ISSN 0011-1643, e-ISSN 1334-417X Croat. Chem. Acta 83 (3) (2010) 323–331. CCA-3423 Original Scientific Article Assessment of Macrolide Transport Using PAMPA, Caco-2 and MDCKII-hMDR1 Assays Danijela Nožinić,a,* Astrid Milić,a Lara Mikac,b Jovica Ralić,a Jasna Padovan,a and Roberto Antolovićc a GlaxoSmithKline Research Centre Zagreb, Ltd., Prilaz baruna Filipovića 29, 10000 Zagreb, Croatia b Division of Materials Physics, Ruđer Bošković Institute, Bijenička 54, 10000 Zagreb, Croatia c Department of Biotechnology, University of Rijeka, S. Krautzeka bb, 51000 Rijeka, Croatia RECEIVED JANUARY 19, 2010; REVISED MARCH 21, 2010; ACCEPTED MARCH 22, 2010 Abstract. The transport of commercially available macrolide antibiotics erythromycin, clarithromycin, roxithromycin, azithromycin, and telithromycin was studied by PAMPA, a model of passive diffusion, and by two models of active transport, Caco-2 and MDCKII-hMDR1. An involvement of efflux pump P-glycoprotein (P-gp) in macrolide transport was also examined. Generally, in Caco-2 and MDCKII-hMDR1 assays without P-gp inhibition, a significantly lower apparent permeability (Papp) in apical-to-basolateral (AB) than basolateral-to-apical (BA) direction was observed [efflux ratio, Pappratio(BA/AB) > 4.2]. Upon P-gp inhibition, Papp(AB) was increased and Papp(BA) was decreased. The observed Papp values, their efflux ratios, as well as a significant decrease in efflux ratios caused by P-gp inhibition (> 50 %) qualify all tested macrolides as P-gp substrates. Results obtained with PAMPA suggest that this assay is not a method of choice for screening of macrolide permeability due to the lack of P-gp efflux pump and/or other transporters potentially involved in macrolide transport. Keywords: macrolides, permeability, P-glycoprotein, PAMPA, Caco-2, MDCK INTRODUCTION The intestinal epithelium permeability is recognized as a critical feature that determines the rate and extent of human absorption and at last, the bioavailability of drugs. Commonly used in vitro methods to assess intestinal permeability in early drug discovery include: parallel artificial membrane permeability assay (PAMPA), Caco-2 and Madin-Darby canine kidney (MDCK) cell assays.1–3 PAMPA represents a rapid, low-cost alternative to cellular models for early ADME screening of new chemical entities, where a mammalian membrane is mimicked by various filter-supported lipid membrane systems.4–7 However, due to the lack of facilitators of active transport, only passive diffusion is assessed by PAMPA. Alternatively, cellular models offer several advantages over PAMPA due to over expression of the transporter of interest, precise control of experimental conditions, and, usually, the lack of other confounding physiological processes. Originally derived from human colon adenocarcinoma, Caco-2 cells express transporter proteins, efflux proteins [apically localized P-glycoprotein (P-gp) efflux pump],8–10 and Phase II conjuga- tion enzymes responsible for metabolic transformation of test substances. Consequently, Caco-2 cells are the most frequently used in vitro tool for prediction of drug permeability and absorption potential,11,12 as they have shown to be predictive of transcellular-based absorption including passive diffusion, active transport, efflux and paracellular transport.13,14 As an alternative to Caco-2 cells, MDCK cells with over expressed human multidrug-resistant gene (hMDR), MDCKII-hMDR1, have become the method of choice to study bidirectional transport of compounds and to evaluate the influence of P-gp.15–17 This is due to the significantly shorter culture time (3–5 vs. 21 days) which reduces cost and increases throughput, low expression levels of transporter proteins and low metabolic activity. In spite of their moderate bioavailabilities in humans,18,19 some macrolide antibiotics20,21 are identified to be substrates/inhibitors for the main drug efflux pump P-gp,22–26 which is known to restrict intestinal permeation. Studies in rats and humans have shown that P-gp inhibition with macrolides in addition to the cytochrome P450 3A4 (CYP3A4) inhibition,27 can cause severe drug-drug interactions affecting oral bioavailability of co-administered drugs.28–30 * Author to whom correspondence should be addressed. (E-mail: [email protected]) 324 D. Nožinić et al., Macrolide Transport Using in vitro Assays O O OH HO O O O O OH O O OH Clarithromycin HO OH HO N HO O O O O O O O O OH Roxithromycin N N O O O N O O O O HO O O OH Azithromycin nologies (Invitrogen, Carlsbad, CA, USA). Caco-2 cells were obtained at passage 47 (European Collection of Cell Cultures, Health Protection Agency Culture Collections, Salisbury, UK). MDCKII-hMDR1 cells were obtained at passage 30 (Netherlands Cancer Institute, Amsterdam, Netherlands). Parallel Artificial Membrane Permeability Assays (PAMPA) N N N N HO O O O O OH O O Erythromycin O OH N HO O O O HO OH N HO O O O O HO OH O N O O O Telithromycin Figure 1. Macrolides used in this study. Recent papers indicate that uptake transporter function of organic anion transporting polypeptide (OATP) family should be considered as an additional potential mechanism of drug-drug interaction with macrolides.31,32 In the present study, five macrolide antibiotics (erythromycin, clarithromycin, roxithromycin, azithromycin, and telithromycin) were characterized and compared according to their permeability through biological membranes (Figure 1). Their permeabilities were studied using three different in vitro methods: PAMPA and cellular based Caco-2 and MDCKII-hMDR1 assays, with and without known P-gp inhibitors, in order to evaluate their applicability to macrolides. EXPERIMENTAL Materials Clarithromycin, azithromycin (Pliva, Zagreb, Croatia), telithromycin (Sanofi-aventis, Paris, France), and testosterone (Steraloids, Wilton, NH, USA) were used in this study. Erythromycin, roxithromycin, verapamil, propanolol hydrochloride, warfarin, dimethyl sulfoxide (DMSO), phosphate-buffered saline (PBS), Hank's balanced salt solution (HBSS), 4-(2-hydroxyethyl)-1piperazineethanesulfonic acid (HEPES), lucifer yellow, acetonitrile (all from Sigma-Aldrich, Munich, Germany), lecithin [Lipoid E100 (Lipoid, Ludwigshafen, Germany)], and n-dodecane (Merck, Darmstadt, Germany) were purchased. Amprenavir and 9,10-dihydro5-methoxy-9-oxo-N-[4-[2-(1,2,3,4-tetrahydro-6,7-dimethoxy2-isoquinolinyl)ethyl]phenyl]-4-acridine-carboxamide (GF120918A) were acquired from our compound repository (GlaxoSmithKline, Stevenage, UK). Dulbecco's Modified Eagles medium (DMEM), fetal bovine serum (FBS), glutamax, nonessential amino acids (NEAA), penicillin-streptomycin, Fungizone (amphotericin B), trypsin-EDTA, and Dulbecco's Phosphate Buffered Saline (DPBS) were purchased from Gibco Life TechCroat. Chem. Acta 83 (2010) 323. DMSO stock solution of tested substance was diluted with PBS buffer (10 mmol dm–3, pH = 7.4) to a final concentration of 500 µmol dm–3 with 5 % (volume fraction, φ) of DMSO. The artificial membrane was prepared using a 1 % (φ) solution of lecithin in n-dodecane and sonicated using a probe to ensure complete dissolution. Avoiding pipette tip contact with the membrane, 5 µl of the lecithin/n-dodecane mixture was pipetted into each donor plate well (MultiScreen-IP PAMPA assay plate, Millipore, Billerica, MA, USA). Immediately after application of the artificial membrane, 150 µl of macrolide-containing donor solution was added to each well of the donor plate. A volume of 300 µl of buffer [5 % (φ) DMSO in 10 mmol dm–3 PBS, pH = 7.4] was added to each acceptor plate well (PTFE Acceptor plate, Millipore, Billerica, MA, USA). The macrolide-filled donor plate was then placed into the acceptor plate to create a “sandwich”, making sure the bottom of the membrane is in contact with the buffer. Standard controls, used in the assays were warfarin (500 µmol dm–3) and testosterone (100 µmol dm–3) as markers of low and high permeability, respectively. The plate was incubated at room temperature (≈ 23 °C) for 3 and 24 h with a medium agitation. After incubation, macrolide concentrations in donor and acceptor plates were determined by LC-MS/MS method. The permeability studies were performed in duplicate for all tested substances, macrolides and standard controls, and the apparent permeability Papp in [nm s–1] was calculated16 according to equation substanceA,End 107 Papp C ln 1 (1) substanceeq where C VD VA VD VA area t (2) and VD and VA are donor (D) and acceptor (A) solution volumes [cm3], respectively; area is active surface area of the membrane (i.e., area = 0.24 cm2 for the membrane in assay plate); t is incubation time [s]; [substance]A,End is concentration [µmol dm–3] of tested substance in the acceptor compartment at the completion of the assay; and [substance]eq is concentration of tested substance at theoretical equilibrium (i.e., 325 D. Nožinić et al., Macrolide Transport Using in vitro Assays [substance]eq = 166 µM for the substances with initial concentration of 500 µmol dm–3).33 Caco-2 Assay Caco-2 cells were cultured34 under controlled atmosphere (37 °C, 95 % air, 5 % CO2, 90 % relative humidity), seeded in plastic flasks and maintained with complete medium [DMEM with glucose (4500 mg mL–1), 10 % (φ) FBS, 1 % (φ) glutamax, 1 % (φ) NEAA, 1 % (φ) streptoycin (100 μg mL–1), and 1 % (φ) Fungizone (amphotericin B)]. Culture medium was changed every 2 days and cultures were split (1:3 to 1:6) every 5 days when they reached 85–90 % confluence, using 0.05 % (φ) trypsin-EDTA. For transport studies, following equilibration with the culture medium for 2 h in CO2 incubator, Caco-2 cells at passages 54–57 were seeded onto collagen coated 6-well polycarbonate Costar Transwell filter inserts (Corning, New York, NY, USA) in culture medium at the density of 2×10⁵ cells per mL. The medium was changed the day after the seeding and every other day (or three times per week) and Caco-2 cells were cultured on the filters for 20 to 22 days. On the day of the transport experiment, the culture medium was changed and 2 h thereafter the integrity of the cell monolayers was estimated microscopically and by measuring transepithelial electrical resistance (TEER) by epithelial voltmeter Millicell-ERS (Millipore, Billerica, MA, USA), before and after the experiment. After removing the culture medium, the monolayers were incubated in the transport medium, for 2 h. Propanolol hydrochloride, a marker of high permeability and transcellular transport, was used as a control in the assay, dissolved in DMSO (10 mg mL–1) and diluted to a final concentration of 100 μmol dm–3 using HBSS containing 12 mmol dm–3 HEPES adjusted at pH = 7.4 for preparation of transport medium. All tested substances were dissolved in DMSO (30 mmol dm–3 stock solutions) and later diluted with transport medium to a final concentration of 50 μmol dm–3. Each substance was tested in triplicate in both directions [apical-to-basolateral (AB) and basolateral-to-apical (BA)] and in the presence and absence of verapamil, a P-gp inhibitor (50 μmol dm–3). The amount of DMSO applied to the cells did not exceed 1 % (φ). For AB transport studies, the medium was removed from monolayers and the inserts were transferred to the new 6-well plate. Each well contained prewarmed transport medium (2.6 mL, 37 °C) in the lower compartment. Prewarmed solutions of tested substances (1.5 mL, 37 °C) were added to the upper compartments. For BA transport studies, prewarmed tested substances were added into the lower compartments (2.6 mL, 37 °C) and prewarmed transport medium was filled into the upper compartments (1.5 mL, 37 °C). In AB and BA bidirectional studies, samples (100 μL) were taken at 0, 45, 90 and 135 min from the acceptor compartments and immediately replenished with the same volume of the transport medium. From the donor compartments, aliquots (20 μL) were taken at the beginning of the experiment (zero point) and at the end of the experiment (135 min). During transport experiment, the plates were incubated at 37 °C and shaken at 55 rpm. In addition, analogue experiments with pH gradient with pH = 6.5 and 7.4 in apical and basolateral compartments, respectively, were done for all tested substances. The concentrations of substances in the collected samples from donor and acceptor wells were determined by LC-MS/MS. The apparent permeability Papp in [nm s–1] was calculated according to the equation Papp dQ c0 1 area 1 dt (3) where dQ/dt is the linear appearance rate obtained from the profile of the transported amount of the substrate against the time [μg s–1]; c0 is a measured initial concentration in donor compartment [μg mL–1]; and area is the membrane surface area of cell monolayer (i.e., area = 4.71 cm2 for 6-well plate). The ratio between Papp values in both transport studies (AB and BA) was calculated according to the expression Papp ratio BA/AB Papp (BA) Papp (AB) (4) Mass balance MB was calculated by equation MB / mD,End mA,End mD,0 100 (5) where m represents mass of tested substance in donor (D) and acceptor (A) compartments at t = 0 min and at the end of transport assay (End) and all values above 80 % were acceptable. MDCKII-hMDR1 Assay MDCKII-hMDR1 cells were grown in controlled atmosphere (37 °C, 95 % air, 5 % CO2, 90 % relative humidity) in DMEM with 10 % (φ) FBS, 1 % (φ) of glutamax I, 1 % (φ) of penicillin (100 U mL–1) - streptomycin (100 μg mL–1) and 1 % (φ) of Fungizone (amphotericin B) in cell culture flasks. Culture medium was changed every 2 days and cultures were split (1:3 to 1:6) every 5 days when they reached 85–90 % confluence, using 0.05 % (φ) trypsin-EDTA. Cells were prepared for transport studies by pre-incubation of 24-well cell culture inserts (Millipore, Billerica, MA, USA) with culture medium (1 h, 37 °C) and then seeded in a concen- Croat. Chem. Acta 83 (2010) 323. 326 tration of 0.3×10⁶ cells per mL. The cells were fed with fresh medium 24 h post seeding and cultured to confluence for 3 days before use. On the day of experiment, 2 h after feeding with the appropriate medium, the cell monolayers were washed and equilibrated with transport medium (DPBS, pH = 7.4) for 30 min (37 °C, 95 % humidity). Test substance solution consisted of test substance (5 μmol dm–3) in transport medium containing lucifer yellow (100 μmol dm–3) and 1 % (φ) DMSO. Transport assays were conducted using 400 and 800 μL of apical and basolateral solution, respectively, i.e., for AB study 400 μL of test substance solution was added to upper compartment and 800 μL of transport medium in the lower compartment. Monolayers were incubated with the dose solution for 90 min at 37 °C under gentle agitation. Apical and basolateral compartments were sampled at the end of the transport experiment and the tested substance concentrations in both compartments were determined by LC-MS/MS. Each substance was tested three times in duplicate in both directions (AB and BA) and in the presence and absence of GF120918A (2 μmol dm–3), a specific P-gp inhibitor. Amprenavir (0.5 μmol dm–3) was used as a positive control in the assay. Like in Caco-2 assay, Papp in both directions (AB and BA), and Pappratio for all tested substances and amprenavir with and without GF120918A were determined using the same equations [3] and [4]. Mass balance was calculated using expression [5] and all values in range of 80–120 % were acceptable. Lucifer yellow, a fluorescent marker for the paracellular pathway, was used as an internal control in every monolayer to verify tight junction integrity during the assay. Cell monolayers with lucifer yellow Papp > 30 nm s–1 were discarded. LC-MS/MS Analysis The LC-MS/MS system consisted of an Agilent 1100 LC Binary Pump (Agilent Technologies, Waldbronn, Germany) with CTC Analytics HTS Pal autosampler (CTC Analytics, Zwingen, Switzerland) and a SCIEX API2000 or API3000 triple quadrupole mass spectrometer (Applied Biosystems, Foster City, CA, USA). Chromatographic separation was performed using a Phenomenex C18 guard column and Phenomenex C18(2) (50×2.0 mm, 3 µm) column (Phenomenex, Torrance, CA, USA) for gradient method with acetonitrile/water (both acidified with 0.1 % (φ) formic acid) as mobile phase, with flow rate of 0.3 mL min–1 at room temperature, and with injection volume of 5 µl. Tested substances were analysed using positive-ion mode with the following multiple reaction monitoring (MRM) transitions: erythromycin 735.5 (M+) → 577.5 (M+); clarithromycin 748.5 (M+) → 590.3 (M+); roxithromycin 837.8 (M+) → 678.5 (M+); azithromycin 749.5 (M+) → 591.5 (M+); telithromycin 407.5 (M++) → 656.1 (M+); warfarin 309.1(M+) → 163.3 (M+); propranolol 260.2 Croat. Chem. Acta 83 (2010) 323. D. Nožinić et al., Macrolide Transport Using in vitro Assays (M+) → 116.2 (M+); testosterone 289.3 (M+) → 97.2 (M+) and amprenavir 506 (M+) → 245.3 (M+). Samples from PAMPA, Caco-2 and MDCKII-hMDR1 studies were prepared by deproteinization with 3 volumes of acetonitrile:methanol (φ = 0.67) containing internal standard (clarithromycin or roxithromycin). Thereafter, samples were centrifuged (4000 rpm, 15 min, 4 °C) and an aliquot of supernatant was injected for analysis. Each tested substance sequence consisted of one calibration curve and samples. Calibration curves were designed to cover possible ranges of analyte concentrations in matrix: a) 11 dilutions in range of 0.195–200 μmol dm–3 for all tested substances in PAMPA; b) 10 dilutions in ranges of 0.1–50 μmol dm–3 and 0.2–100 μmol dm–3 for all tested macrolides and propranolol, respectively, in Caco-2 assay; and c) 12 dilutions in ranges of 0.0048–10 μmol dm–3 and 0.48 nmol dm–3–1 μmol dm–3 for all tested macrolides and amprenavir, respectively, in MDCKII-hMDR1 assay. Linear regression analysis with 1/x or 1/x2 weighing factor was chosen as the most appropriate to determine the substance calibration curves. The correlation coefficient in each calibration curve was higher than 0.95. All back calculated values used within each selected calibration curve were below 20 % of deviation. Peak areas of analyte and calibration curves were determined using the Analyst software version 1.4 (Applied Biosystems, Foster City, CA, USA). Other calculations were performed in MS Excel spreadsheet. RESULTS Papp values in PAMPA, obtained at pH = 7.4 with incubation time of 3 h at room temperature (≈ 23 °C), are 5.7 ±0.4 7.3 ± 0.7 warfarin 58.5 ±15.9 testosterone 10.2± 0.6 1.4 ±0.1 1.3 ±0.1 erythromycin 109.9±13.1 clarithromycin 37.8±1.7 65.5±21.8 roxithromycin 35.6± 1.5 13.1±0.5 10.1± 0.9 azithromycin n.d. 0.13 ±0.03 telithromycin 0 30 3h 24 h 60 90 120 150 180 Papp / [nm s-1] Figure 2. The apparent permeability coefficients (Papp/nm s–1) in PAMPA at pH = 7.4 obtained by incubating tested substances either for 3 or 24 h at room temperature (≈ 23 °C). Data is presented as mean value ± standard deviation from two replicates. 327 D. Nožinić et al., Macrolide Transport Using in vitro Assays Table 1. The apparent permeabilities (Papp/nm s–1)* in Caco-2 cell assay from apical-to-basolateral (AB) and basolateral-to-apical (BA) side on pH = 7.4 without and with inhibition of P-glycoprotein (P-gp) efflux pump by verapamil. The ratios between Papp in BA and AB directions, [Pappratio(BA/AB)] Substance Papp (AB) Noninhibited P-gp Papp (BA) Pappratio(BA/AB) nm s –1 nm s –1 0.9 0.2 63.8 3.3 clarithromycin 38.4 4 roxithromycin 5.2 1.2 azithromycin 2.2 1.3 166.4 13.1 telithromycin 19.4 2.2 94.9 2.3 propanolol 121.8 4.5 94.2 3.1 0.8 erythromycin Papp (AB) Inhibited P-gp Papp (BA) Pappratio(BA/AB) nm s –1 nm s –1 74.5 4.4 0.2 11.6 1.4 2.6 183.3 6.5 4.8 72.9 1.8 73.4 5.8 1.0 110.9 9.1 21.3 86.9 5.4 188.3 5.6 2.2 75 16.8 4.3 16.5 3.3 1.0 4.9 26.8 2.7 75.6 0.4 2.8 127.2 4.1 80.6 1.4 0.6 * data is presented as mean value ± standard deviation from three replicates. displayed in Figure 2. The apparent permeability for telithromycin could not be determined as the levels were below the lower limit of quantification (0.195 µmol dm–3). The highest PAMPA Papp values were obtained for clarithromycin, indicating high permeability, followed by roxithromycin (moderate permeability), and low permeable azithromycin and erythromycin. The influence of time on passive diffusion was examined by prolonging the incubation time from 3 to 24 h (Figure 2).16 For low permeable macrolides erythromycin, azithromycin and telithromycin, no substantial differences in permeability with time were observed. Moreover, an increase in incubation time did not contribute to an increase in telithromycin levels in the acceptor compartment significantly. For moderately permeable roxithromycin and highly permeable clarithromycin an increase in incubation time resulted in 1.8and 2.9-fold decreases in PAMPA Papp, respectively, which classifies clarithromycin from highly to moderately permeable. Although prolonging the incubation time produces different results, no significant change was observed in the ranking of tested macrolides. Caco-2 Papp values were determined for both di- rections, AB and BA, and together with the respective efflux ratio [Pappratio(BA/AB)] are listed in Table 1. Erythromycin26 and azithromycin showed very low AB permeability with Papp(AB) of 0.9 and 2.2 nm s–1, respectively, in comparison to the more permeable macrolides, roxithromycin (5.2 nm s–1), telithromycin (19.4 nm s–1) and clarithromycin (38.4 nm s–1). The addition of verapamil (Table 1), resulted in increased Papp values in the AB direction and in reduced Papp values in the BA direction, respectively in all cases with the exception of roxithromycin [Papp(BA) is 110.9 and 188.3 nm s–1 without and with P-gp inhibition, respectively]. Caco-2 efflux ratios with inhibited P-gp are significantly lower, from 1 to 2.8, than without P-gp inhibition. The TEER values varied slightly among different sets of plates and only monolayers with TEER ≥ 300 Ω were used in transport studies. The effect of pH gradient, more precisely the effect of apical pH, on Caco-2 permeability was determined using pH = 6.5 and 7.4 solutions in apical compartment and pH = 7.4 solution in the basolateral compartment. Papp in both directions, AB and BA, and their efflux ratio, are displayed in Figures 3a–c. While ery- Figure 3. Effect of apical pH on the permeability of macrolides in Caco-2 cell assay. The apparent permeabilities (Papp/nm s–1) in a) apical-to-basolateral (AB) direction, Papp(AB), b) in basolateral-to-apical (BA) direction, Papp(BA), and c) the ratio between Papp in BA and AB directions [Pappratio(BA/AB)] obtained with (pH = 6.5 and 7.4 in apical and basolateral compartments, respectively) and without pH gradient (pH = 7.4 in both compartments). Data is presented as mean value ± standard deviation from three replicates. Croat. Chem. Acta 83 (2010) 323. 328 D. Nožinić et al., Macrolide Transport Using in vitro Assays Table 2. The apparent permeabilities (Papp/nm s–1)* in MDCKII-hMDR1 cell assay from apical-to-basolateral (AB) and basolateral-to-apical (BA) side on pH = 7.4 without and with inhibition of P-glycoprotein (P-gp) efflux pump by GF120918A. The ratios between Papp in BA and AB directions, [Pappratio(BA/AB)] Substance Papp (AB) Noninhibited P-gp Papp (BA) Pappratio(BA/AB) Papp (AB) nm s –1 nm s –1 erythromycin 10.1 ± 0.3 128.7 ± 8.7 clarithromycin 3.3 ± 0.9 roxithromycin 3.7 ± 0.4 azithromycin 25.9 ± 4.3 109.7 ± 18.7 4.2 telithromycin 4.7 ± 0.8 358.5 ± 16.6 75.6 propanolol 43.7 ± 7.5 738.2 ± 9.9 16.9 284.8 ± 11.9 Inhibited P-gp Papp (BA) Pappratio(BA/AB) nm s –1 nm s –1 12.7 9.7 ± 0.4 62.6 ± 16.4 6.4 548.6 ± 42.2 166 54.1 ± 3.2 159.1 ± 15.3 2.9 298 ± 7.5 80 6.2 ± 0.9 98.5 ± 14.5 16 35.9 ± 0.1 48.2 ± 9.9 1.3 59.3 ± 13.4 151.6 ± 42.1 2.6 537.5 ± 34.4 1.9 * data is presented as mean value ± standard deviation from three replicates. thromycin and azithromycin exhibit decreased permeabilities at lower apical pH, the other three macrolides showed an increased permeability (Figure 3c). The changes in efflux ratios are primarily caused by a decrease in Papp(AB) at lower apical pH, observed for all tested substances with the exception of azithromycin (Figure 3a). On the contrary, at lower pH, a relatively small decrease in Papp(BA) was observed for all but roxithromycin (Figure 3b). Papp values and the efflux ratios obtained in the MDCKII-hMDR1 assay, with and without P-gp inhibition by GF120918A, are listed in Table 2. Although Papp(AB) values for all five tested substances indicate low to moderate permeability, as observed in the Caco-2 assay, the overall ranking differs. Clarithromycin, roxithromycin and telithromycin exhibit low transport in the AB direction (3.3, 3.7, and 4.7 nm s–1, respectively), whereas erythromycin (10.1 nm s–1) and azithromycin (25.9 nm s–1) exhibit higher transport. Upon P-gp inhibition with GF120918A, Papp(AB) was increased for all macrolides except erythromycin where the change was negligible. Substantial increases in AB permeability were observed for clarithromycin and telithromycin with Papp(AB) of 54.1 and 59.3 nm s–1, respectively. Permeability in BA direction was reduced by P-gp inhibition from 2 to 3.5 times for all of them. MDCKII-hMDR1 efflux ratios were significantly lower upon P-gp inhibition for all tested substances. DISCUSSION Transport studies using PAMPA, Caco-2 and MDCKIIhMDR1 assays were performed for a set of five commercially available macrolide drugs: 14-membered ring macrolides erythromycin, clarithromycin, and roxithromycin, 15-membered ring macrolide azithromycin, and for a novel class representative, ketolide, 14-membered ring macrolide telithromycin. PAMPA Papp describes the affinity of compounds Croat. Chem. Acta 83 (2010) 323. for transcellular passive diffusion in a system lacking active and paracellular transport. The macrolides tested are all weak bases with a protonated amine on the desosamine moiety at pH = 7.4. In addition, azithromycin has the protonated nitrogen in the macrolide ring at the same pH. Consequently, as being protonated at pH = 7.4, the tested substances showed relatively low PAMPA permeability. Our results, obtained after 3 h of incubation, classify erythromycin and azithromycin as low permeable substances with the PAMPA Papp of 1.4 and 13.1 nm s–1, respectively (Figure 2). Moderately permeable roxithromycin and clarithromycin showed significantly higher PAMPA Papp (65.5 and 109.9 nm s–1, respectively). These results are in line with their higher oral bioavailability in humans (72–85 % and 55 %, respectively)19 in comparison to erythromycin and azithromycin (20 % and 37 %, respectively).19,35 Although they share similar physicochemical properties,36 a relatively small structural difference between erythromycin and clarithromycin (hydroxy- vs. methoxy-substituent on the C6 position, respectively) causes a significant difference (79-fold increase) in their PAMPA permeability. Although prolonging the incubation time from 3 to 24 h, did not significantly change the overall ranking of tested substances, decreases in Papp values were observed for clarithromycin and roxithromycin. Decreased Papp values could be explained by an increase of tested substance concentration in the acceptor compartment which comes closer to the theoretical equilibrium concentration ([substance]eq in Equation 1). Moreover, the PAMPA assay classifies telithromycin as nonpermeable as the concentrations of telithromycin were below the lower limit of quantification after 3 h of incubation. However, data from literature demonstrate that telithromycin has a good oral bioavailability in humans, very similar to clarithromycin (57 vs. 55 %, respectively).19,21 In both cellular assays, Caco-2 and MDCKIIhMDR1, permeability measurements are made in the 329 D. Nožinić et al., Macrolide Transport Using in vitro Assays apical-to-basolateral and basolateral-to-apical directions with the apical side representing the gut lumen and the basolateral side representing the systemic circulation. The Caco-2 cell monolayer model mimics not only transcellular passive diffusion, as PAMPA, but also includes active transport, efflux and paracellular transport. However, due to macrolide size (Mr > 700), paracellular transport can be neglected in this study. The influence of the pH gradient on the Caco-2 permeability for tested macrolides is not straightforward (Figure 3). Based on our results, the pH seems to affect not only the passive diffusion but could also affect the affinity of macrolides to behave as substrates for various efflux pumps and/or transporters. In the Caco-2 assay performed at pH = 7.4, all tested macrolides showed lower permeability in the AB direction in comparison to the BA direction (Table 1). Moreover, erythromycin and azithromycin showed a higher efflux ratios (74.5 and 75, respectively), when compared to same values obtained for roxithromycin (21.3), but especially for clarithromycin and telithromycin (4.8 and 4.9, respectively). Differences in AB permeabilities are likely due to different affinities for the P-gp efflux system for the macrolides tested. It could be postulated that transport of erythromycin and azithromycin is more influenced by active secretion and efflux system than other three macrolides. As previously reported in the literature, a comparison of efflux ratio generated in the presence and absence of a P-gp inhibitor (i.e. verapamil) is the method of choice in identifying P-gp substrates.2 A compound is typically considered to be a P-gp substrate when the efflux ratio in the absence of inhibitor is greater than 2 and is at least halved in the presence of inhibitor.3 Moreover, inhibition of P-gp by verapamil generally increased AB and decreased BA permeability.26 Accordingly, erythromycin, clarithromycin, roxithromycin, and azithromycin could be classified as P-gp substrates (Table 1). On the other hand, telithromycin does not fulfil the second criteria, as efflux ratio decreased for 42 % by P-gp inhibition. However, this result is in accordance with previous findings in the literature that showed a much lower extent of P-gp involvement in the overall transport of telithromycin than for other macrolides.25 It has been proposed that a change in efflux ratio in the presence of verapamil suggests that the greatest decrease in efflux ratio is indicative of the lowest relative apparent affinity for P-gp.25 According to our results obtained in the Caco-2 assay, the apparent P-gp affinity is in following order: azithromycin < erythromycin < roxithromycin < clarithromycin < telithromycin. One of the drawbacks of applied bidirectional permeability Caco-2 assay is the fact that other transporters, uptake/efflux proteins and metabolic enzymes are also functionally expressed in Caco-2 cells, therefore ranking of analysed macrolides according to their P-gp affinity could be ambiguous, at least. It raised the need to perform comparable experiments using MDCKIIhMDR1 cell line with overexpression of human P-gp, low expression levels of other transporter proteins and low metabolic activity, in comparison to Caco-2 cells. Our results show that MDCKII-hMDR1 permeability in AB direction is much lower than in the BA direction for all tested macrolides (Table 2), which is in line with data from the Caco-2 assay. However, the observed permeabilities in the BA direction are generally higher in MDCKII-hMDR1 than in the Caco-2 assay. MDCKII-hMDR1 efflux ratios range from 4.2 to 166, due to different and in some cases very low AB permeabilities. These results suggest a significant influence of the efflux mechanism on the permeability of tested macrolides in MDCKII-hMDR1 assay, especially in the cases of clarithromycin (166), roxithromycin (80), and telithromycin (75.6). Differences in the permeability observed between Caco-2 and MDCKII-hMDR1 assays could be result of the difference in the relative expression levels of total P-gp in each of them. Importantly, there is no data in literature that showed expression levels of P-gp or any transporters in MDCK cells and this should be taken into account when interpreting results of this assay. The potency of P-gp inhibition in MDCKIIhMDR1 cells was assessed using verapamil and GF120918A in the same experimental set-up (data not shown). In these studies GF120918A demonstrated the same inhibitory potency at a 25 times lower concentration and was therefore used for further studies. P-gp inhibition with GF120918A in MDCKII-hMDR1 cells reduced the amount of tested substance transported from the cell to the apical side, thereby affecting the permeability in both directions: increasing Papp(AB) and decreasing Papp(BA) for all tested macrolides, but erythromycin. Interestingly, inhibition of P-gp with GF120918A resulted in a decreased transport of erythromycin in the BA direction, however, failed to influence its transport in the AB direction. Similar effects have been reported in the literature.25 Comparison of efflux ratio with and without P-gp inhibition reveals a significant decrease caused by P-gp inhibition, from 49 % for erythromycin to 98 % for clarithromycin, classifying all these macrolides as P-gp substrates. CONCLUSION Our data demonstrate that the tested set of macrolides behave as low to moderately permeable substances in all three assays used. Results obtained in cellular assays, Caco-2 and MDCKII-hMDR1, indicate involvement of active transport by being P-gp substrates. In order to Croat. Chem. Acta 83 (2010) 323. 330 D. Nožinić et al., Macrolide Transport Using in vitro Assays assess the impact of P-pg efflux activity on the oral absorption, in vivo studies in P-gp-deficient mice should be considered. Based on our results we can conclude that permeabilities obtained by PAMPA do not correlate with values obtained in both cellular assays and that this method is not appropriate for routine permeability screening of macrolides, as it only takes into account passive transport and likely inaccurately estimates the intrinsic permeability. Acknowledgements. The authors thank Vesna Munić, PhD, for helpful and productive discussions during experimental work described in this paper. REFERENCES 1. 2. 3. 4. 5. 6. 7. 8. 9. 10. 11. 12. 13. 14. 15. S. Deferme, P. Annaert and P. Augustijns, Biotech. Pharm. Aspect 7 (2008) 182–215. P. V. Balimane, Q.-H. Han and S. Chong, AAPS Journal 8 (2006) E1–E13. E. H. Kerns, L. Di, S. Petusky, M. Farris, R. Ley and P. Jupp, J. Pharm. Sci. 93 (2004) 1440–1453. A. Avdeef, S. Bendels, L. Di, B. Faller, M. Kansy, K. Sugano and Y. Yamauchi, J. Pharm. Sci. 96 (2007) 2893–2909. A. Avdeef, Expert Opin. Drug Metab. Toxicol. 1 (2005) 325–342. M. Kansy, A. Avdeef and H. Fischer, Drug Discov. Today. Technol. 1 (2004) 349–355. A. Avdeef and O. Tsinman, Eur. J. Pharm. Sci. 28 (2006) 43–50. D. Balayssac, N. Authier, A. Cayre and F. Coudore, Toxicol. Lett. 156 (2005) 319–329. S. Eberl, B. Renner, A. Neubert, M. Reisig, I. Bachmakov, J. König, F. Dörje, T. E. Mürdter, A. Ackermann, H. Dormann, K. G. Gassmann, E. G. Hahn, S. Zierhut, K. Brune and M. F. Fromm, Clin. Pharmacokinet. 46 (2007) 1039–1049. J. P. Keogh and J. R. Kunta, Eur. J. Pharm. Sci. 27 (2006) 543–554. R. B. Van Breemen and Y. Li, Expert Opin. Drug Metab. Toxicol. 1 (2005) 175–185. B. Press and D. Di Grandi, Curr. Drug Metab. 9 (2008) 893–900. C. Masungi, J. Mensch, A. Van Dijck, C. Borremans, B. Willems, C. Mackie, M. Noppe and M. E. Brewster, Pharmazie 63 (2008) 194–199. H. Sun, E. C. Y. Chow, S. Liu, Y. Du and K. S. Pang, Expert Opin. Drug Metab. Toxicol. 4 (2008) 395–411. T. T. Tran, A. Mittal, T. Gales, B. Maleeff, T. Aldinger, J. W. Polli, A. Ayrton, H. Ellens and J. Bentz, J. Pharm. Sci. 93 (2004) Croat. Chem. Acta 83 (2010) 323. 16. 17. 18. 19. 20. 21. 22. 23. 24. 25. 26. 27. 28. 29. 30. 31. 32. 33. 34. 35. 36. 2108–2123. S. Carrara, V. Reali, P. Misiano, G. Dondio and C. Bigogno, Int. J. Pharm. 345 (2007) 125–133. P. Acharya, M. P. O'Connor, J. W. Polli, A. Ayrton, H. Ellens and J. Bentz, Drug Metab. Dispos. 36 (2008) 452–460. G. Foulds, R. M. Shepard and R. B. Johnson, J. Antimicrob. Chemother. 25 (Suppl. A) (1990) 73–82. R. Jain and L. H. Danziger, Curr. Pharm. Design 10 (2004) 3045–3053. G. G. Zhanel, M. Dueck, D. J. Hoban, L. M. Vercaigne, J. M. Embil, A. S . Gin and J. A. Karlowsky, Drugs 61 (2001) 443–98. M. Zeitlinger, C. C. Wagner and B. Heinisch, Clin. Pharmacokinet. 48 (2009) 23–38. C. Seral, J.-M. Michot, H. Chanteux, M.-P. Mingeot-Leclercq, P. M. Tulkens and F. Van Bambeke, Antimicrob. Agents Chemother. 47 (2003) 1047–1051. M. Sugie, E. Asakura, Y. L. Zhao, S. Torita, M. Nadai, K. Baba, K. Kitaichi, K. Takagi, K. Takagi and T. Hasegawa, Antimicrob. Agents Chemother. 48 (2004) 809–814. S. Yamaguchi, Y. L. Zhao, M. Nadai, H. Yoshizumi, X. Cen, S. Torita, K. Takagi, K. Takagi and T. Hasegawa, Antimicrob. Agents Chemother. 50 (2006) 80–87. J. I. Pachot, R. P. Botham and K. D. Haegele, J. Pharm. Pharmaceut. Sci. 6 (2003) 1–12. H. Saito, Y. Fukasawa, Y. Otsubo, K. Yamada, H. Sezaki and S. Yamashita, Pharm. Res. 17 (2000) 761–765. J. F. Westphal, Br. J. Clin. Pharmacol. 50 (2000) 285–295. K. Shakeri-Nejad and R. Stahlmann, Expert Opin. Pharmacother. 7 (2006) 639–651. J. Rengelshausen, C. Goggelmann, J. Burhenne, K. D. Riedel, J. Ludwig, J. Weiss, G. Mikus, I. Walter-Sack and W. E. Haefeli, Br. J. Clin. Pharmacol. 56 (2003) 32–38. S. Ito, R. Nasu, M. Tsujimoto, H. Murakami, H. Ohtani and Y. Sawada, Biopharm. Drug Dispos. 28 (2007) 113–123. E. Garver, E. D. Hugger, S. P. Shearn, A. Rao, P. A. Dawson, C. B. Davis and C. Han, Drug Metab. Dispos. 36 (2008) 2492–2498. A. Seithel, S. Eberl, K. Singer, D. Auge, G. Heinkele, N. B. Wolf, F. Dörje, M. F. Fromm and J. König, Drug Metab. Dispos. 35 (2007) 779–786. K. Sugano, H. Hamada, M. Machida and H. Ushio, J. Biomol. Screen. (2001) 6189–6196. J. G. Gao, E. D. Hugger, M. S. Beck-Westernmeyer and R. T. Borchart, Curr. Protoc. Pharmacol. 7 (2000) 7.2.1–7.2.23 J. Lakritz and D. W. Wilson, AAEP Proceedings 43 (1997) 83–86. J. W. McFarland, C. M. Berger, S. A. Froshauer, S. F. Hayashi, S. J. Hecker, B. H. Jaynes, M. R. Jafson, B. J. Kamicker, C. A. Lipinski, K. M. Lundy, C. P. Reese and C. B. Vu, J. Med. Chem. 40 (1997) 1340–1346. 331 D. Nožinić et al., Macrolide Transport Using in vitro Assays SAŽETAK Utvrđivanje transporta makrolida putem PAMPA, Caco-2 i MDCKII-hMDR1 testova Danijela Nožinić,a Astrid Milić,a Lara Mikac,b Jovica Ralić,a Jasna Padovan,a i Roberto Antolovićc a GlaxoSmithKline centar za istraživanje Zagreb, Ltd., Prilaz baruna Filipovića 29, 10000 Zagreb, Croatia b Zavod za fiziku materijala, Institut Ruđer Bošković, Bijenička 54, 10000 Zagreb, Croatia c Odjel za biotehnologiju, Sveučilište u Rijeci, S. Krautzeka bb, 51000 Rijeka, Croatia Transport komercijalnih makrolidnih antibiotika eritromicina, klaritromicina, roksitromicina, azitromicina i telitromicina proučavan je PAMPA testom pasivne difuzije te Caco-2 i MDCKII-hMDR1 testovima aktivnog transporta molekula kroz membranu. Proučavan je i utjecaj membranskog transportera P-glikoproteina (P-gp) na transport makrolida. U Caco-2 i MDCKII-hMDR1 testovima bez P-gp inhibicije opažena je smanjena permeabilnost (Papp) iz apikalne prema bazolateralnoj (AB) nego li iz bazolateralne prema apikalnoj strani (BA) membrane [omjer permeabilnosti, Pappratio(BA/AB) > 4,2]. Uslijed P-gp inhibicije Papp(AB) se povećala, dok se Papp(BA) smanjila. Opažene Papp vrijednosti, omjeri permeabilnosti, kao i značajno smanjenje istih omjera uzrokovano P-gp inhibicijom (> 50 %), svrstava ovdje testirane makrolide u P-gp supstrate. Rezultati dobiveni PAMPA testom upućuju na zaključak da ovaj model nije dobar izbor za razvrstavanje makrolida prema njihovoj permeabilnosti, kako radi nepostojanja P-gp tako i/ili radi nepostojanja drugih transportera potencijalno uključenih u transport makrolida. Croat. Chem. Acta 83 (2010) 323.
© Copyright 2026 Paperzz