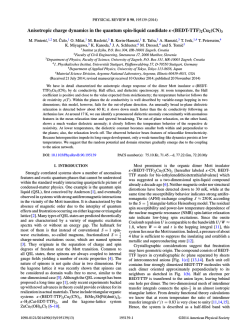
PHYSICAL REVIEW B 86, 245125 (2012)
Cooperative dynamics in charge-ordered state of α-(BEDT-TTF)2 I3
T. Ivek,1,2,* I. Kovaˇcevi´c,1 M. Pinteri´c,1,3 B. Korin-Hamzi´c,1 S. Tomi´c,1 T. Knoblauch,2 D. Schweitzer,2 and M. Dressel2
1
2
Institut za fiziku, P.O. Box 304, HR-10001 Zagreb, Croatia
Physikalisches Institut, Universit¨at Stuttgart, Pfaffenwaldring 57, D-70550 Stuttgart, Germany
3
Fakulteta za gradbeniˇstvo, Univerza v Mariboru, Smetanova 17, 2000 Maribor, Slovenia
(Received 17 August 2012; published 21 December 2012)
Electric-field-dependent pulse measurements are reported in the charge-ordered state of α-(BEDT-TTF)2 I3 . At
low electric fields up to about 50 V/cm only negligible deviations from Ohmic behavior can be identified with no
threshold field. At larger electric fields and up to about 100 V/cm a reproducible negative differential resistance
is observed with a significant change in shape of the measured resistivity in time. These changes critically depend
on whether constant voltage or constant current is applied to the single crystal. At high enough electric fields
the resistance displays a dramatic drop down to metallic values and relaxes subsequently in a single-exponential
manner to its low-field steady-state value. We argue that such an electric-field-induced negative differential
resistance and switching to transient states are fingerprints of cooperative domain-wall dynamics inherent to
two-dimensional bond-charge density waves with ferroelectric-like nature.
DOI: 10.1103/PhysRevB.86.245125
PACS number(s): 71.27.+a, 71.45.−d, 71.30.+h
I. INTRODUCTION
Diverse charge structures and complex nonlinear dynamics
in anisotropic condensed matter systems with electron-phonon
couplings and strong Coulomb interactions have been the
focus of intense scientific activity in recent years. Conventional
charge and spin density waves (CDW/SDW) previously found
in highly anisotropic inorganic and organic systems with prevailing electron-phonon (electron-electron) coupling feature
the collective phason mode with well-established fingerprints
in applied ac and dc electric fields.1–4 Since the phason is
pinned to random impurities or the commensurate lattice, it can
be observed as a narrow resonance at terahertz frequencies and
as a broad loss peak in radio-frequency range. Other famous
fingerprints of the phason are the nonlinear conductivity above
a finite threshold field and narrow-band noise due to sliding.
On the other hand, in the presence of strong on-site and
intersite Coulomb repulsion a wealth of broken symmetry
insulating ground states with spatially inhomogeneous charge
(spin) structures is found in various transition metal oxides and
quasi-two-dimensional (quasi-2D) organics.5,6 In particular,
organics with a rich variety of lattice structures provide a nice
playground to study electronic phases ranging from localized
Wigner-crystal-like charge (spin) to delocalized CDW-like
(SDW) modulation of charge (spin) densities. However, there
are no well-developed theoretical models about collective
excitations in these phases and how they should respond to
applied ac and dc electric fields.
Under applied ac electric fields, anisotropic phason-like
dispersions were found similar to those of conventional
CDWs, while at high dc electric fields contradictory results
were reported ranging from negligibly small nonlinearities
with no threshold field to the well-defined effects due to
sliding similar to conventional CDWs.7–9 At much higher
fields the giant nonlinear conductivity and negative differential resistance (NDR) were reported10–14 which were very
different from those known in conventional CDWs. Distinct
mechanisms to explain these remarkable nonlinear effects
have been suggested ranging from melting of charge order
in θ -(BEDT-TTF)2 CsM (SCN)4 (M = Zn, Co) compounds11
1098-0121/2012/86(24)/245125(6)
to dielectric breakdown and depinning and sliding of holes
within charge stripes in La2−x Srx NiO4+δ .10 In the TMETTTP organic system the electrothermal model originally
developed to account for the hot electron dynamics was used to
reproduce the measured nonlinear conductivity which featured
NDR with no switching.14 On the other hand, in θ -(BEDTTTF)2 MZn(SCN)4 (M = Cs, Rb) and α-(BEDT-TTF)2 I3 the
I-V characteristics were found to follow a power-law behavior
I ∝ V α in the range of extremely low currents (lower than
10 nA) and low temperatures (lower than 60 K) and were
explained within the excitonic model with a long-range
Coulomb interaction.15,16 Further, an analogy to SDW sliding
has been invoked to explain unusual nonlinear effects in the
case of antiferromagnetic phase of localized spins in MDT-TS
organic compounds.17 Finally, when the constant voltage is
applied to the sample, current oscillations with very low
fundamental frequencies (10–100 Hz) have been observed in
the NDR region of several quasi-2D organics and interpreted as
the switching frequency between low and high current states in
analogy to the well-known Gunn effect observed in two-valley
semiconductors.18 The cause of all these remarkable nonlinear
effects, although appearing as a common phenomenon in many
strongly correlated insulating systems, is still unclear and the
proposed interpretations are highly controversial.
α-(BEDT-TTF)2 I3 represents one of the most prominent
and best studied quasi-2D organic metals with charge order.
Synchrotron x-ray diffraction, NMR, Raman, and infrared
vibrational measurements (Ref. 19 and references therein)
demonstrate that α-(BEDT-TTF)2 I3 should be considered
as the model case of the 2D bond-charge density wave
with concomitant formation of a pattern of structural twin
domains.20 These results at the same time indicate that
the description of charge order as a horizontal stripe of
localized charges is oversimplified and that the modulation
of bonds in two almost diagonal in-plane directions needs
also to be taken into account. Recently, on the basis of
the anisotropic electrodynamic response it was shown that
collective excitations of such a charge order possess a
complex anisotropic dispersion along diagonal as well as along
245125-1
©2012 American Physical Society
T. IVEK et al.
PHYSICAL REVIEW B 86, 245125 (2012)
oscilloscope
V
Rs·I
Rs
current source
oscilloscope
U
V
Rs·I
Rlarge
oscilloscope
U
V
Rs·I
Rs
voltage source
Rs
voltage source
U
U
I
FIG. 1. Schematic diagrams of the pulse measurement circuits employed for the constant-current mode (left and middle panels) and for the
constant-voltage mode (right panel).
two crystallographic in-plane directions: a broad screened
relaxation due to long-wavelength phason-like excitations and
a temperature-independent relaxation with small amplitude
due to the motion of domain-wall pairs between twinned
domains in the charge order texture.21 If this interpretation is
valid, the dynamical properties of these collective excitations
should also manifest themselves as a characteristic nonlinear
response in high dc electric fields. Early experiments by one
of us first observed nonlinear effects in dc conductivity at low
fields.22 Further nonlinear conductivity measurements along
three crystallographic directions have shown NDR and voltage
oscillations.23 The authors point out that the current-voltage
characteristics measured in the two-probe configuration by
constant-current and constant-voltage methods were essentially the same and oscillations could be detected only for
sufficiently short single crystals. The picture of pure horizontal
stripe charge order was invoked to interpret these results as the
evidence for charge order depinning and sliding.
In this communication we attempt to clarify these important
issues concerning the nature and origin of nonlinearities in
the charge-ordered ground state of α-(BEDT-TTF)2 I3 . We
approach the charge order as a 2D bond-charge density wave
developed in the pattern of ferroelectric-like twin domains.
Our results give evidence that long-wavelength collective
excitations of this charge order, while possessing phason-like
dispersion, do not show the nonlinear response in high dc electric fields established for conventional CDWs. Rather, shortwavelength excitations with domain-wall-like dispersion give
rise to a negative differential resistance at high dc electric fields
and reversible switching to transient high-conducting states.
II. EXPERIMENTAL
The measurements were performed on six single crystals
of varying lengths (0.2–2 mm) along three in-plane directions:
in the a and b crystallographic axes and in the diagonal [110]
direction. The sample selected for a detailed study for E a
had a cross-sectional area of 0.0032 mm2 , and the distance
between current and voltage contacts was 0.37 and 0.11 mm,
respectively. The electric transport in the Ohmic regime was
measured between room temperature and 20 K as described
in Ref. 19; qualitatively the same behavior was found with no
hysteresis in the phase transition temperature region.
At high fields the current-voltage characteristics were
obtained by pulse measurements in the charge-ordered state
between 100 and 135 K, a temperature range where systematic
errors were excluded due to sample resistances much smaller
than input impedance of instrumentation. Mostly a four-point
configuration was used in order to eliminate any possible
contact influence. The experiments were carried out using
two measurement modes as shown in Fig. 1. In the constantcurrent mode, a circuit with a Keithley 6221 current source
was used (Fig. 1, left panel). In order to minimize Joule
heating we applied rectangular pulses, typically 1–5 ms
wide with a settling time of about 5 μs and the repetition
time of 100–500 ms. The sample resistance was measured
by monitoring the voltage drop V at the sample and the
current I through load resistor Rs by a Tektronix TDS3014C
digital storage oscilloscope. We also measured the total source
voltage U . The response was typically sampled 64 times
and averaged. Interestingly, out of six samples the two with
a distance between current contacts smaller than 0.4 mm
showed real-time voltage oscillations, which is in accord with
previous findings.23,24 However, the current pulses turned out
to feature oscillations as well, indicating that the current source
did not succeed in regulating a constant current within the
pulse.25 The spurious origin of oscillations was confirmed by
the experiments using another circuit for the constant-current
mode in which the current was fixed by means of a large
resistor in series with an HP214B pulse generator (Fig. 1,
middle panel). These experiments as well as experiments done
in the constant-voltage mode never did exhibit any oscillations,
in any of its various configurations.
In the circuit for the constant-voltage mode a Tabor 8023
signal generator (Fig. 1, right panel) provided voltage pulses
(typical width of 1–5 ms, repetition time 100–500 ms),
and the voltage drop and current through the sample are
again measured by an oscilloscope. We have additionally
recorded time-resolved infrared reflectivity spectra, E a
and b, during the above-described voltage pulses. These
preliminary measurements with a time resolution of 25 μs have
been performed in the frequency range 800–4000 cm−1 using a
Bruker Vertex 80v spectrometer in step-scan mode as a trigger
for the voltage-pulse generator and a Hyperion IR microscope
with a measurement spot between voltage contacts.26
III. RESULTS AND DISCUSSION
All measured temperatures show qualitatively the same
transport behavior. A typical nonlinear conductivity for fields
245125-2
COOPERATIVE DYNAMICS IN CHARGE-ORDERED STATE . . .
(a)
10
101
200
5
0
Time (ms)
150
5
0
Time (ms)
100
0.02
(d)
voltage source
E||a
125K
σ (Ω-1cm-1)
0
5
Time (ms)
102
voltage source
E||a
125K
250
2
2
J (A/cm )
Resistivity
15
Resistivity
0.04
(c)
current source
E||a
125 K
Resistivity
E||a
125 K
0.06
(σ-σ0)/σ0
(b)
α-(BEDT-TTF) 2I3
J (A/cm )
0.08
PHYSICAL REVIEW B 86, 245125 (2012)
5
100
10-1
50
0.00
0
0
10
20
30
E (V/cm)
40
50
10-2
0
0
20
40
60
80
100
120
0
E (V/cm)
20
40
60
E (V/cm)
80
100
120
10-2
10-1
100
101
102
103
2
J (A/cm )
FIG. 2. (a) Low- and (b, c, d) high-electric field behavior of α-(BEDT-TTF)2 I3 , E a, at a representative temperature 125 K. (a) Conductivity
increase normalized to its Ohmic value vs electric field. (b) Current density vs electric field with corresponding resistivity vs time plots
measured in the constant-current and (c) constant-voltage mode. The current density and electric field are evaluated as an average of 4–5 ms.
(d) Conductivity vs current density measured in the constant-voltage mode. The full line is a fit to the power law σ (J,T ) = σ0 (T ) + AJ n
with σ0 = 0.034 −1 cm−1 and n = 1.8 ± 0.2. Constant-current mode data follow the same expression with σ0 = 0.04 −1 cm−1 and n =
2.1 ± 0.2.
up to 50 V/cm for E a measured in constant-current mode
is shown in Fig. 2(a). The obtained behavior is in accord with
that of the constant-voltage mode measurement. It is evident
that the threshold field for sliding cannot be clearly defined.27
Qualitatively similar results were obtained for the conductivity
data along the b axis and diagonal [110] direction as well. All
orientations show an almost negligible nonlinearity (a few
percent) if compared with the standard CDW nonlinear effects
which amount to at least several tens of percent at twice the
threshold field.1–3 Pulse shapes show only a small deviation
from rectangular shape.
The sample response drastically changes in higher fields
[Figs. 2(b) and 2(c)]: The current density J against the
electric field E curve deviates from the Ohmic-like behavior
at fields higher than 50 V/cm and eventually shows a negative
resistance behavior (NDR).23 Our results clearly demonstrate
that the observed NDR which sets in above the threshold field
Eth is accompanied with a significant change in shape of the
measured resistivity R in time t which critically depends
on the applied measurement mode.28 When the constantcurrent mode is used, R-t curves show only smooth changes
within pulse [Fig. 2(b)]; conversely when the constant-voltage
mode is used, R-t curves show a discontinuous jump to a
low-resistance state [Fig. 2(c)] and an overall drop to low
fields in E-J plots happens at significantly higher current
densities. Delay times become longer for fields close to
threshold indicating the field-dependent formation of the
connected metallic-like regions. The NDR behavior becomes
more prominent and the threshold field Eth increases as the
temperature lowers (not shown). Unfortunately, due to a rather
restricted temperature range we cannot distinguish between
conventional CDWs, for which at low temperatures theory
predicts Eth (T ) ∝ exp(−T /T0 ),29 and dielectric breakdown
associated with the charge carrier avalanche process which
experimentally follows the Eth (T ) ∝ exp(T0 /T ) law.30 In the
former case T0 corresponds to the strength of the pinning
potential, and we get a value of 5 K. This is close to
that found for charge stripes (2.5–15 K), and somewhat
smaller than the values typically found in conventional CDWs
(20–100 K). On the other hand, our data nicely follow the
phenomenological formula for current-dependent conductivity
expected in the presence of avalanche process of current, i.e.,
charge carriers, σ (J,T ) = σ0 (T ) + AJ n , where the first term is
Ohmic conductivity and n in the second term does not depend
on temperature [Fig. 2(d)].
We also characterize the switching from a high- to lowresistance state as detected in the constant-voltage measurement mode, and to test for a possible memory effects we
have applied the following procedure (Fig. 3). First, a very
short (1 ms) low-field pulse was applied to measure the
sample resistance; it was followed by an adjustable high-field
conditioning pulse (3 ms), and in the end a long, low-field
probing pulse was applied to track time-dependent recovery of
sample resistance (up to 100 ms). Our results demonstrate that
the low-resistance states achieved by switching are transient
in nature: Once the conditioning pulse with a voltage high
enough to induce switching into a low-resistance state is
turned off, the memory keeps the sample metallic-like during
2 ms and subsequently the sample’s resistance decays back
in a single-exponential manner to its steady-state value. The
switching to a low-resistance state and back is a highly
reproducible phenomenon. Additionally, after the voltage is
applied, the switching occurs at a characteristic delay time
which becomes shorter either for larger voltage amplitudes
at a given temperature (0.8–17 ms at 125 K) or at higher
temperatures for a given voltage amplitude (not shown).
Although such a huge (by more than a factor of 100; see
Fig. 3, left panel) and steep reduction of resistance under high
electric field can hardly be attributed to Joule heating, the
decay time dependency motivated us to verify the extent of
its influence. The resistance at 125 K before the switching
was 10 k. The switching to low-resistance state of about
40 was observed with delay time of 3 ms upon the
application of 7.34 V. The total Joule heat generated in the
sample prior to switching was calculated to be less than 1 μJ.
Using the measured value of heat capacity (575 J/mol K at
125 K)31 and the sample volume, the upper bound of
temperature rise due to Joule heating would be less than 1 K
with the assumption of homogenous temperature. Figure 4
shows a comparison between measured resistance vs time as
opposed to estimates based on Joule heating and dc resistivity
curve. A similar data analysis was done for the constant-current
245125-3
PHYSICAL REVIEW B 86, 245125 (2012)
α-(BEDT-TTF)2I3
12
voltage source
E||a
125 K
20
R(t)
15
8
U = 7.34 V
6
10
4
5
2
Source voltage U (V)
10
25
14
α-(BEDT-TTF)2I3
12
voltage source
E||a
125 K
10
0
10
15
R(t)
6
10
4
2.05 V
20
30
40
5
U(t)
0
0
0
20
8
2
U(t)
25
50
Resistance (kΩ)
14
Resistance (kΩ)
Source voltage U (V)
T. IVEK et al.
0
0
10
20
30
40
50
Time (ms)
Time (ms)
FIG. 3. Effects of two extreme conditioning pulses with total source voltage U on α-(BEDT-TTF)2 I3 , E a, at a representative temperature
125 K measured in constant-voltage mode. At sufficiently high electric fields within the conditioning pulse the sample becomes metallic and
in time decays back to the high-resistance state (left panel). A low-field conditioning pulse keeps the resistance unchanged (right panel).
mode experiments where only a smooth decrease of the
resistance with no delay was detected (not shown). The results
verified that even in this measurement mode the resistance
fell faster than the Joule heating estimate, which implies
that heating cannot be the sole cause of the observed effect.
Preliminary time-resolved infrared spectroscopy experiments
also indicate that the sample does not undergo a transition
into the high-temperature metallic phase as it switches to
a low-resistance state during a voltage pulse. To elaborate,
an α-(BEDT-TTF)2 I3 heated through the metal-to-insulator
transition would show characteristic changes in the E a,
b infrared spectra before and after transition.19 In our timeresolved infrared experiment these changes were notably
absent; indeed there are only negligible differences to the
insulating-phase spectra through the whole duration of a
high-field switching pulse.26 Therefore, we are confident that
the NDR with switching and the low-resistance state should
20
α-(BEDT-TTF)2I3
voltage source
E||a
125 K
Joule heating estimate
measured
Resistance ( kΩ)
15
U = 1.2 V
10
7.2 V
5
10 V
0
0
1
2
3
4
5
Time (ms )
FIG. 4. Comparison between measured resistance vs time (full
lines) and an estimate (dashed lines) based on Joule heating and the
dc curve, for three representative pulses with total source voltage U
applied to α-(BEDT-TTF)2 I3 along the a axis at 125 K.
be an intrinsic, although transient, state of electron system in
the charge-ordered state of α-(BEDT-TTF)2 I3 .
Nonlinear conductivity effects similar to the ones in α(BEDT-TTF)2 I3 have also been observed in diverse quasi-1D
strongly correlated inorganic and organic insulating systems.
Arguments were given that the observed dynamics should be
collective in nature, analogous to the case of conventional
CDWs. First, the decrease of Eth with increasing temperature
of the form Eth (T )/Eth (0) = exp(−T /T0 ) has been also found
in CDWs and ascribed to the reduction of pinning by thermal
fluctuations of the phase of the CDW order parameter.29
Second, the magnitude of threshold fields, although several
orders of magnitude larger than needed to depin a CDW
(∼0.01–1 V/cm), is at the same time much smaller (again
by several orders of magnitude) than typical breakdown fields
in band insulators (107 V/cm). Third, delayed switching is
an effect also found in conventional CDWs32 and it was
consistently explained as a result of coupling among CDW
domains to form a coherent current-carrying state. As a rule the
nonlinear contribution to conductivity in conventional CDWs
does not follow the J n power law. To the best of our knowledge,
NbSe3 is the only conventional CDW system which shows an
NDR;33 however the effect is very small and dwarfed by the
drop in resistivity of α-(BEDT-TTF)2 I3 .
In α-(BEDT-TTF)2 I3 the values of threshold fields are more
than one order of magnitude smaller than the ones found
in transition-metal Mott insulators and mixed-stack organic
systems.30,34,35 Further, the delay times (0.01–10 ms) are
10 times longer than known from standard CDW systems
(0.001–0.1 ms),32 but more than 100 times shorter than the ones
detected in transition metal compounds with stripe phases.10
Delayed switching in conventional CDWs was studied in
relation to sign memory charging and was monitored as
transient voltage responses to current pulses with different
histories.32 In these experiments, as in many others, periodic
voltage oscillations were clearly resolved. Memory effects
were attributed to the redistribution of CDW deformations and
the appearance of voltage oscillations to the interaction of the
sliding CDW with impurities. Voltage-mode experiments on
K0.3 MoO3 at very low temperatures where electron screening
245125-4
COOPERATIVE DYNAMICS IN CHARGE-ORDERED STATE . . .
PHYSICAL REVIEW B 86, 245125 (2012)
is absent have shown behavior atypical for conventional
CDWs: strong nonlinearities, delayed current switching, and
oscillating current response were detected above an extremely
high electric field of about 100 V/cm.36 As far as the voltage
oscillations are concerned our results clearly show that the
voltage oscillations in our samples, when they appeared, are
only an artifact of the measurement circuit and are in sharp
contrast to previously published two-contact measurements.23
We are led to conclude that a more systematic investigation
needs to be done on single crystals of different geometries,
from different syntheses and using different constant-current
circuits in order to reconcile the existing observations.
Therefore, we consider that delayed switching detected in
the NDR regime as a transient current response and the powerlaw current-dependent conductivity seem to be a somewhat
different phenomenon than the one in most conventional
CDWs. However, the very reason why the charge response
at high electric fields is so different may be due to the
complex structure of the CO in α-(BEDT-TTF)2 I3 . Namely,
the unit cell consists of four crystallographically inequivalent
molecules placed in different environments, which intuitively
should prevent sliding in high fields as found in conventional
CDWs. The 1100 modulation of site charges accompanied
by bond tetramerization along the two diagonal in-plane
directions appears not to be the only significant pattern of
the CO. Indeed, the symmetry breaking at the CO phase
transition is associated with a 1010 modulation and bond
dimerization within the stack of A molecules perpendicular
to stripes. The latter change implies the loss of inversion
centers between A molecules which consequently become
nonequivalent and thus are responsible for the ferroelectriclike nature of the CO.37 Recently it was suggested on the basis
of DFT calculations that the instability which leads to this CO
and associated ferroelectricity is not purely Coulomb-driven
within the molecular subsystem, but that it is also amplified
by anion interactions.38
On the other hand, the observed behavior is rather similar to
the one of strongly correlated LaSrNiO with charge stripes,10
the SrCuO Mott insulators,30 as well as in organic systems.12
In the LaSrNiO extremely long delay times near threshold
field were taken as an indication of the field-dependent
formation of conductive regions and the onset of NDR
was suggested to be a sign of a dielectric breakdown and
concomitant collective motion of holes within charge stripes.
The dielectric breakdown was also suggested in an organic
conductor based on BEDT-TTF due to a resistance drop by a
factor of 103 (Ref. 12), while in a mixed-stack charge-transfer
system34 the NDR was attributed to either the cooperative
motion of charge defects or domain walls inherent to the
insulating states of these systems. In all these cases as
well as in α-(BEDT-TTF)2 I3 the current-power-law-dependent
conductivity was found with the exponent n = 1.8 implying
a self-multiplication avalanche-like process of charge carriers
which is induced by current density. Such a process can be also
seen as a cooperative percolation process among randomly distributed preformed conductive domains switched on at fields
above Eth .
In case of switching from insulating to a metallic-like
state in α-(BEDT-TTF)2 I3 we have to consider the following
possible causes. The first one could be the destruction of
charge order by high electric fields as described above for
strongly correlated systems, or as in PrCaMnO.39 Another
option is electron heating effects. Simple estimates indicate
that both of these causes can be ruled out. Namely, taking the
upper bound for the inelastic electron mean-free path of about
1.35 nm in the temperature range 100–135 K,40 the maximum
energy provided by a field of 100 V/cm is of the order of
13.5 μeV ≈ 0.16 K. This value is still four times smaller
than the charge order energy gap and far below the thermal
energy at measured temperatures. Dielectric breakdown can
be also ruled out since no oscillatory behavior of current,
predicted by theories, was observed in our samples.18,41 It is
noteworthy that the avalanche-like increase of conductivity can
happen at fields which are still lower than needed for the onset
of breakdown. Here we also point out a recent pump-probe
experiment which demonstrated a photoinduced transition in
α-(BEDT-TTF)2 I3 from insulating to the metallic state.42 The
initial fs-scale pulse destroys the charge order; macroscopic
metallic domains form and eventually relax back to the
charge-ordered state in ps–ns times. These fast relaxations
are in contrast to the millisecond-scale high-conducting state
found in our experiments.
Keeping in mind the above considerations, we suggest
the following scenario for the charge response in high dc
electric fields of the CO developed in α-(BEDT-TTF)2 I3 .19
The long-wavelength collective excitations with phason-like
dispersion are not able to respond to the applied dc electric
field due to structural inequivalences of BEDT-TTF molecules
within a unit cell.38 Rather we propose that the domain-wall
pairs formed due to the twinned nature of the charge-ordered
phase are responsible for the observed nonlinearities. The
observed millisecond scale of response is indeed too slow for
phasons; more likely it corresponds to soliton-like excitations.
In the applied dc electric field the coupling to the dipole
moments of each unit cell breaks the symmetry between
two opposed dipole orientations. At high fields the rate
of formation of domain wall pairs strongly increases and
overcomes their formation due to thermal excitations. Subsequently, the motion of domain wall pairs become increasingly
correlated and thus creates growing conduction regions until
percolation promotes an NDR. The microscopic nature of these
regions remains open, that is, whether percolation islands
or filament-like regions are formed. It is noteworthy that a
qualitatively similar behavior is observed in the constantcurrent mode, albeit without switching and thus significantly
weaker. This result implies that the NDR itself is independent of measurement-mode but achieving a prominent effect
absolutely requires measurement conditions which allow unlimited current self-multiplication: an uncapped, i.e., voltage,
source.
IV. CONCLUSION
In summary, we demonstrate the huge negative differential
resistance and switching to transient high-conduction states
at high dc electric fields within molecular planes in the
charge-ordered state of α-(BEDT-TTF)2 I3 . Conversely, at low
dc electric fields only negligibly small nonlinearities without
a clear-cut threshold field are observed. We argue that this
behavior of dc conductivity is closely related to the origin
245125-5
T. IVEK et al.
PHYSICAL REVIEW B 86, 245125 (2012)
of complex dielectric response at radio frequencies. In the
high-field regime, we suggest that the effects are accounted
for by the dynamics of short-wavelength excitations of the
two-dimensional bond-charge density wave, i.e., domain walls
at interfaces of two types of ferroelectric-like domains. On the
other hand, in the low-field regime, negligibly small effects indicate a largely frozen dynamics of collective long-wavelength
(phason-like) excitations whose dispersion at low ac fields
we have detected previously as a broad screened relaxation
mode. Further experiments are needed to clarify whether such a
negative differential resistivity phenomenon is a unique feature
of the charge order in α-(BEDT-TTF)2 I3 , or is common to
strongly correlated systems close to commensurability.
*
22
[email protected]; http://real-science.ifs.hr/
P. Monceau, editor, Electronic Properties of Inorganic Quasi-OneDimensional Materials (Reidel, Dordrecht, 1985), p.139.
2
G. Gr¨uner and A. Zettl, Phys. Rep. 119, 117 (1985).
3
G. Gr¨uner, Rev. Mod. Phys. 60, 1129 (1988); 66, 1 (1994).
4
S. Tomic, J. R. Cooper, W. Kang, D. Jerome, and K. Maki, J. Phys.
I (France) 1, 1603 (1991).
5
P. Fulde, Electron Correlations in Molecules and Solids, 3rd ed.
(Springer-Verlag, Berlin, 1995).
6
H. Seo, J. Merino, H. Yoshioka, and M. Ogata, J. Phys. Soc. Jpn.
75, 051009 (2006).
7
T. Vuleti´c, B. Korin-Hamzi´c, T. Ivek, S. Tomi´c, B. Gorshunov,
M. Dressel, and J. Akimitsu, Phys. Rep. 428, 169 (2006).
8
T. Ivek, T. Vuleti´c, S. Tomi´c, A. Akrap, H. Berger, and L. Forr´o,
Phys. Rev. B 78, 035110 (2008).
9
G. Blumberg, P. Littlewood, B. S. Denis, N. Motoyama, H. Eisaki,
and S. Ushida, Science 297, 584 (2002).
10
S. Yamanouchi, Y. Taguchi, and Y. Tokura, Phys. Rev. Lett. 83,
5555 (1999).
11
F. Sawano, I. Terasaki, H. Mori, M. Watanabe, N. Ikeda, Y. Nogami,
and Y. Noda, Nature (London) 437, 522 (2005).
12
S. Niizeki, F. Yoshikane, K. Kohno, K. Takahashi, H. Mori,
Y. Bando, T. Kawamoto, and T. Mori, J. Phys. Soc. Jpn. 77, 073710
(2008).
13
T. Ozawa, K. Tamura, Y. Bando, T. Kawamoto, T. Mori, and
I. Terasaki, Phys. Rev. B 80, 155106 (2009).
14
T. Mori, T. Ozawa, Y. Bando, T. Kawamoto, S. Niizeki, H. Mori,
and I. Terasaki, Phys. Rev. B 79, 115108 (2009).
15
Y. Takahide, M. Kimata, K. Hazama, T. Terashima, S. Uji,
T. Konoike, and H. M. Yamamoto, Phys. Rev. B 81, 235110 (2010).
16
K. Kodama, M. Kimata, Y. Takahide, N. Kurita, A. Harada,
H. Satsukawa, T. Terashima, S. Uji, K. Yamamoto, and K. Yakushi,
J. Phys. Soc. Jpn. 81, 044703 (2012).
17
T. Mori, Y. Bando, T. Kawamoto, I. Terasaki, K. Takimiya, and
T. Otsubo, Phys. Rev. Lett. 100, 037001 (2008).
18
E. M. Conwell, High Field Transport in Semiconductors, Solid State
Physics, Suppl. 9, edited by F. Seitz, D. Turnbull, and H. Ehrenreich
(Academic, New York, 1967), p. 80.
19
T. Ivek, B. Korin-Hamzi´c, O. Milat, S. Tomi´c, C. Clauss,
N. Drichko, D. Schweitzer, and M. Dressel, Phys. Rev. B 83, 165128
(2011).
20
R. T. Clay, S. Mazumdar, and D. K. Campbell, J. Phys. Soc. Jpn.
71, 1816 (2002).
21
T. Ivek, B. Korin-Hamzi´c, O. Milat, S. Tomi´c, C. Clauss,
N. Drichko, D. Schweitzer, and M. Dressel, Phys. Rev. Lett. 104,
206406 (2010).
1
ACKNOWLEDGMENTS
We thank G. Untereiner for sample preparation. S.T.
acknowledges helpful discussions with S. Mazumdar and
R. T. Clay. This work was supported by the Croatian Ministry
of Science, Education, and Sports under Grant No. 0350000000-2836 and by the Deutsche Forschungsgemeinschaft
(DFG). T.K. was supported by the Carl Zeiss Stiftung.
M. Dressel, G. Gr¨uner, J. P. Pouget, A. Breining, and D. Schweitzer,
J. Phys. I (France) 4, 579 (1994).
23
K. Tamura, T. Ozawa, Y. Bando, T. Kawamoto, and T. Mori, J.
Appl. Phys. 107, 103716 (2010).
24
H. Wakita, K. Tamura, T. Ozawa, Y. Bando, T. Kawamoto, and
T. Mori, J. Appl. Phys. 108, 123709 (2010).
25
This is not surprising since in the presence of an NDR and high
enough capacitance in parallel it might be possible to drive the
feedback loop of the current source into an oscillating regime.
26
T. Knoblauch, T. Ivek, D. Schweitzer, and M. Dressel (unpublished).
27
A threshold field of about 5 ± 1 V/cm may be seen in the lin-log
plot; however the log scale can be misleading and is usually not
employed.
28
The two circuits for constant-current mode gave similar J -E curves,
which excluded the possibility that the current source feedback loop
influences the pulse shape in a systematic way.
29
K. Maki, Phys. Rev. B 33, 2852 (1986).
30
Y. Taguchi, T. Matsumoto, and Y. Tokura, Phys. Rev. B 62, 7015
(2000).
31
N. A. Fortune, K. Murata, M. Ishibashi, M. Tokumoto, N. Kinoshita,
and H. Anzai, Solid State Commun. 77, 265 (1991).
32
G. Mih´aly, G. Kriza, and A. J´anossy, Phys. Rev. B 30, 3578 (1984).
33
R. P. Hall, M. Sherwin, and A. Zettl, Phys. Rev. Lett. 52, 2293
(1984).
34
Y. Tokura, H. Okamoto, T. Koda, T. Mitani, and G. Saito, Phys.
Rev. B 38, 2215 (1988).
35
Y. Iwasa, T. Koda, S. Koshihara, Y. Tokura, N. Iwasawa, and
G. Saito, Phys. Rev. B 39, 10441 (1989).
36
A. Maeda, T. Furuyama, and S. Tanaka, Solid State Commun. 55,
951 (1985); A. Maeda, M. Notomi, K. Uchinokura, and S. Tanaka,
Phys. Rev. B 36, 7709 (1987).
37
T. Kakiuchi, Y. Wakabayashi, H. Sawa, T. Takahashi, and
T. Nakamura, J. Phys. Soc. Jpn. 76, 113702 (2007).
38
P. Alemany, J.-P. Pouget, and E. Canadell, Phys. Rev. B 85, 195118
(2012).
39
A. Asamitsu, Y. Tomioka, H. Kuwahara, and Y. Tokura, Nature
(London) 388, 50 (1997).
40
The electron mean-free path is estimated to be about 1 nm at
room temperature and 1.35 nm just above the charge-ordered phase
transition temperature.
41
T. Oka, R. Arita, and H. Aoki, Phys. Rev. Lett. 91, 066406 (2003).
42
S. Iwai, K. Yamamoto, A. Kashiwazaki, F. Hiramatsu, H. Nakaya,
Y. Kawakami, K. Yakushi, H. Okamoto, H. Mori, and Y. Nishio,
Phys. Rev. Lett. 98, 097402 (2007); S. Iwai, Crystals 2, 590
(2012).
245125-6
© Copyright 2026 Paperzz