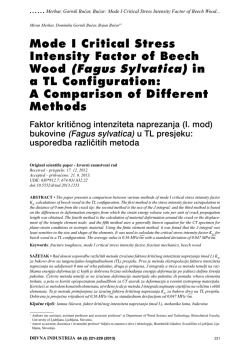
Ž. Božić, M. Mlikota, S. Schmauder
Primjena ΔK, ΔJ i ΔCTOD parametara u modeliranju rasta zamornih pukotina
ISSN 1330-3651
UDC/UDK 620.191.33:539.42
APPLICATION OF THE ΔK, ΔJ AND ΔCTOD PARAMETERS
IN FATIGUE CRACK GROWTH MODELLING
Željko Božić, Marijo Mlikota, Siegfried Schmauder
Subject review
This paper presents the developed fatigue crack growth models based on parameters ΔK, ΔJ-integral and ΔCTOD determined by using linear elastic and elastic
plastic FE analysis. The fatigue crack growth threshold values of the considered crack growth driving force parameters, below which crack propagation does
not occur, were taken into account. Fatigue crack growth tests with constant load amplitude were carried out on a centrally cracked plate specimen until collapse
occurred. The tests were performed on mild steel specimens at room temperature in laboratory air, at a loading frequency of 5 Hz. For the analyzed specimen, the
calculated ΔJ-integral range values obtained by linear elastic analysis, ΔJle, and the elastic-plastic values, ΔJep, were close at lower crack growth rates. As the
crack length increases the ΔJep values became higher as compared with the linear elastic values, ΔJle, This indicates that small scale yielding conditions
prevailed only for smaller crack lengths. The models based on the EPFM parameters ΔJep and ΔCTOD provide better agreement with experimental results for
higher crack growth rates, compared with the models based on the LEFM parametersΔK andΔJle.
Keywords: CTOD, EPFM, fatigue crack growth, J-integral, LEFM
Primjena ΔK, ΔJ i ΔCTOD parametara u modeliranju rasta zamornih pukotina
Pregledni članak
U radu su izloženi modeli rasta zamornih pukotina, temeljeni na parametrima mehanike loma ΔK, ΔJ-integral i ΔCTOD koji su utvrđeni koristeći linearno
elastičnu i elasto-plastičnu analizu metodom konačnih elemenata. Prag napredovanja pukotine, koji predstavlja graničnu vrijednost relevantnog parametra
mehanike loma ispod koje ne dolazi do napredovanja pukotine, uzet je u obzir u modelima. Proveden je test zamora s konstantnom amplitudom cikličkog
rasteznog opterećenja za uzorak ploče sa središnjom pukotinom. Test je proveden za uzorak od mekog konstrukcijskog čelika u laboratoriju na sobnoj
temperaturi s frekvencijom 5 Hz. Za manje duljine pukotine vrijednosti izračunate u linearno elastičnoj analizi ΔJle poklapaju se s ΔJep vrijednostima
izračunatim u elasto-plastičnoj analizi. Za veće duljine pukotina parametarΔJep raste brže od linearno elastičnog parametra ΔJle, što pokazuje da je pretpostavka
linearno elastične mehanike loma o malim plastičnim deformacijama u ligamentu zadovoljena samo za manje duljine pukotine. Modeli temeljeni na elastoplastičnim parametrima ΔJep i ΔCTOD daju bolje slaganje simuliranog životnog vijeka s eksperimentalnim rezultatima nego linearno elastični modeli temeljeni
na parametrima ΔK i ΔJle.
Ključne riječi: CTOD, EPML, J-integral, LEML, rast pukotine uslijed zamora
1
Introduction
Uvod
The fatigue life of a structural component is usually
split into a crack initiation period and a crack growth period,
[1, 2]. Nucleation of micro cracks generally occurs very
early in the fatigue life. The initiation period is supposed to
include some micro crack growth or short crack growth, [3,
4]. At this stage the fatigue cracks are still too small to be
visible. After some micro crack growth has occurred away
from the nucleation site, a more regular growth is observed,
[5]. This is the beginning of the so-called long crack growth
period. At this stage, the crack is growing in a stable manner
until failure occurs. Various stages in the fatigue life are
given in Fig. 1.
It is technically significant to consider the crack
initiation and stable crack growth periods separately. Crack
length of 1mm represents a limit between the short and long
cracks, [6, 7]. This length is also considered as a limit size in
NDT inspections. Once cracks become visible, the
remaining fatigue life of a structural component is usually a
smaller part of the total life. This part is particularly
important for the fail-safe and safe-life designs of structures
such as aircrafts, ships, etc. [2].
For the two periods the fatigue prediction methods are
different. The stress concentration factor Kt is the important
parameter for predictions on crack initiation. Analysis of
crack initiation period is usually based on PalmgrenMiner's linear cumulative damage hypothesis, [8, 9]. For
prediction of fatigue crack growth the fracture mechanics
Technical Gazette 18, 3(2011), 459-466
parameters such as Stress Intensity Factor (SIF), K, Jintegral and Crack Tip Opening Displacement (CTOD), δ,
are considered as a crack driving force.
The fatigue crack growth prediction models are
fracture mechanics based models that have been
developed to support the damage tolerance concepts in
metallic structures. The common approach to fatigue
crack growth analysis is to describe the data by a
differential equation, which is referred to as a fatigue
crack growth law or model. By integrating the
equation one can obtain the crack length versus
number of cycles, a-N curve, and predict the number
of cycles required for the crack to grow from an initial
to the final size.
Cyclic
slip
Crack
nucleation
Micro crack
growth
Initiation period
Macro crack growth
Final failure
Crack growth period
Stress concentration factor
Fracture parameters
Fracture toughness
Kt
K, J, CTOD
K c, Jc, CTOD c
Figure 1 Stages in the fatigue life
Slika 1. Stadiji kod zamora
There are different criteria for crack growth
considering the brittle or ductile behaviour of the
material. Linear Elastic Fracture Mechanics
assumption (LEFM) usually dominates in brittle
materials and the crack growth criterion is described
by SIF K. Ductile materials are often based on Elastic
459
Application of the ΔK, ΔJ and ΔCTOD parameters in fatigue crack growth modelling
Plastic Fracture Mechanics (EPFM) assumption and
different parameters such as energy release rate, G, Jintegral, or CTOD, δ, represent the crack propagation
criterion. It is necessary to mention that crack growth
criterion for ductile materials is also valid for brittle
materials. [28]
The fatigue crack growth is in essence brittle and it is
often based on LEFM assumptions. The well-known Paris
law is based on the stress intensity factor range ΔK, which
represents the difference of the maximum and minimum K
value, ΔK = Kmax – Kmin, associated with the maximum and
minimum applied nominal stress in a loading cycle, σmin and
σmax, respectively, [10]. The Paris equation (1) does not take
account of the effect of loading ratio, i.e. R = σmin/σmax. It is
well-known from experimental observations that R-ratio
affects the rate of crack growth [1]. As a consequence, Cp
and mp also vary in relation to the R-ratio changes. Walker
[11] and Forman [12] extended Paris' model by taking
account of the stress ratio R. The Forman equation can also
describe higher crack growth rates, da/dN, when Kmax
approaches to the fracture toughness value, KIc. The fracture
toughness value, KIc, is a critical KI value associated with
fracture onset and it represents a material property.
da
m
= C p ( DK ) p .
dN
(1)
Growth of long cracks may take place if the applied
cyclic stress is high enough to provide the SIF range higher
than the stress intensity factor range threshold ΔKth, [6, 7].
Its value is determined experimentally by using the
decreasing K test as described in theASTM E647 document.
There are cases when LEFM does not govern fatigue
crack growth rate. Some examples are: short crack growth,
crack growth in welded areas, low cycle fatigue, crack
growth under large scale yielding regime, etc. In such cases
the EPFM parameters J-integral and CTOD can be
considered as a crack driving force. Dowling and Begley
[13] suggested implementation of ΔJ-integral for fatigue
crack growth modelling under large scale yielding
conditions. Branco et al. [14] investigated fatigue crack
growth under tensile cyclic loading using mild steel
specimens and concluded that crack growth rate at higher
strains is substantially controlled by ΔJ-integral. Chow and
Lu [15] discussed implementation of the ΔJ-integral to
crack growth rate modelling under small and large scale
yielding. In reference [16] is presented a crack growth
model based on ΔJ-integral, by means of which crack
growth rates for two different steels were examined.
McEvily [30] proposed a model that relates the crack
growth rate to the crack tip opening displacement and
includes the threshold effect.
This paper presents results of calculated fracture
mechanics parameters SIF, K, J-integral and CTOD, δ, by
using Linear Elastic (LE) and Elastic Plastic (EP) FE
analysis, for a centrally cracked plate specimen. A fatigue
test with constant load amplitude was carried out on the
centrally cracked plate specimen. The material used for the
specimens is conventional mild steel for welded structures.
In the experiment higher crack growth rates were observed
in the last part of the specimen's total fatigue life.
The calculated J-integral values obtained by LE and EP
analysis are close initially, for shorter crack lengths, and for
longer cracks the EP values are higher as compared with the
LE values. This suggested that the specimen was not under
460
Ž. Božić, M. Mlikota, S. Schmauder
small scale yielding during the whole fatigue life, which is
in agreement with higher crack growth rates observed in the
experiment when the crack became longer. Crack growth
models based on parameters ΔK, ΔJ and ΔCTOD are
developed in order to simulate fatigue crack growth life for
the test specimen.
2
Fatigue crack growth models
Modeli rasta zamornih pukotina
In a structure subjected to a cyclic load, a fatigue crack
nucleus can be initiated on a microscopically small scale.
The initiated crack grows further to a macroscopic size, and
finally the component fails in the last cycle of the fatigue
life. A typical fatigue crack growth rate curve, commonly
called a da/dN versus ΔK curve, is illustrated in Fig. 2. The
curve is defined by Regions A, B and C which is commonly
referred to as region I, II and III respectively, [31].
Region I represents the early development of a fatigue
crack and the crack growth rate; da/dN is typically of the
-9
order 10 m/cycle or smaller. This region is highly
influenced by the crack growth threshold, ΔKth, below
which long fatigue cracks practically do not propagate.
Region II represents the intermediate crack propagation
zone where the length of the plastic zone ahead of the crack
tip is long compared with the mean grain size, but much
smaller than the crack length. The use of LEFM concepts is
acceptable and the data follows a linear relationship
between log da/dN and log ΔK. The crack growth rate is
-9
-6
typically on the order of 10 to 10 m/cycle. The influence
of the mean stress is probably the most significant and
usually results in closely spaced lines parallel to each other.
This region corresponds to stable crack growth.
Figure 2 Fatigue rate curve
Slika 2. Krivulja rasta zamora
Region III represents the fatigue crack growth at very
6
high rates, da/dN > 10- m/cycle associated with a rapid and
unstable crack growth just prior to final failure. The
corresponding stress level is very high and causes a large
plastic zone near the crack tip. Because large scale yielding
occurs, the influence of the nonlinear properties of the
material cannot be ignored. The use of LEFM is not entirely
correct and nonlinear fracture mechanics should be applied
to this stage.
Various fatigue crack growth prediction models have
been developed to analyze propagation of long cracks. Paris
used ΔK parameter to explain FCGR behaviour based on the
LEFM assumption. For situations of fatigue crack growth
under large scale yielding regime, where the stress intensity
factor is no longer valid, Dowling and Begley introduced
Tehnički vjesnik 18, 3(2011), 459-466
Primjena ΔK, ΔJ i ΔCTOD parametara u modeliranju rasta zamornih pukotina
Ž. Božić, M. Mlikota, S. Schmauder
DK th
.
E × (2DK - DK th )
a model with ΔJ-integral as the crack driving force
parameter, Eq. (2).
DJ th =
da
= C db (DJ ) mdb .
dN
In accordance with Eq. (7), the correlation between ΔJth
andΔCTODth can be represented by the Eq. (12).
(2)
Where Cdb and mdb are the constants of the DowlingBegley equation and ΔJ = Jmax – Jmin, is the J-integral range.
In LEFM the parameters K and J-integral are correlated.
Assuming the plane stress conditions, the following
correlation exists:
J=
K2
,
E
(3)
where E is Young's modulus. From the equations (1), (2) and
(3), the constants mdb and Cdb are given by (4) and (5).
mdb =
mp
2
,
(4)
mp
Cdb = E
2
McEvily proposed a crack growth models based on the
crack tip opening displacement range, ΔCTOD. A crack
growth model based on ΔCTOD = CTODmax – CTODmin, is
given by equation (6).
da
= C ctod (DCTOD ) mctod .
dN
(6)
Elastic Plastic Fracture Mechanics gives relationship
between the CTOD and J-integral:
J
,
sY
(7)
where σY is yield stress and dn is a correlation parameter
which depends on material properties.
For a crack growth model given by Eq. (6), and by
means of Eqs. (2) and (7) the constants Cctod and mctod are
given by Eqs. (8) i (9).
mctod =m db ,
Cctod
æ 1
ö
= çç
×s ty ÷÷
è dn
ø
DJ th
.
E
(12)
The crack growth models (1), (2) and (6) do not take
into account the fatigue threshold parameters (10), (11) and
(12). In this work the fatigue threshold parameters ΔKth and
ΔJth and ΔCTODth are considered in the implemented crack
growth models.
An extension of the Paris equation (1) based on the
effective stress intensity factor range, ΔKeff , (10) is given by
(13). This equation is also known as the Zheng-Hirt model,
[19].
m
m
da
= C p eff × (DK eff ) p eff = C p eff × (DK - DK th ) p eff . (13)
dN
(5)
× Cp .
DCTOD = d n ×
DCTOD th = d n ×
(11)
(8)
mdb
× C db .
(9)
The threshold stress intensity factor range value, ΔKth,
is a ΔK value bellow which crack growth practically does
not occur, [17, 18]. Paris' equation does not take account of
the threshold ΔKth. In a crack growth model the threshold
stress intensity factor range, ΔKth, can be taken into account
considering the effective part of the SIF rangeΔKeff , as given
by the Eq. (10).
DK eff = DL - DK th .
m
m
da
= C db eff × (DJ eff ) db eff = C db eff × (DJ - DJ th ) db eff . (14)
dN
The crack growth model based on ΔCTOD parameter,
which includes threshold ΔCTODth values, is represented by
Eq. (15).
m
da
= C ctod eff × (DCTODeff ) ctod eff =
dN
= C ctod eff × (DCTOD - DCTOD th )
(10)
mctod
(15)
eff
.
Considering the Paris equation (1), the number of
constant amplitude loading cycles due to which a crack
grows from an initial crack length, a0, to a final crack length,
afin, can be determined by the integration of the equation
(16).
N=
afin
da
.
ò
m
a0 C [DK I ]
(16)
The integration of the Paris equation (16) can be
performed numerically. For discrete crack lengths, a, the
SIF values are calculated by FEA. Between the two discrete
SIF values, a linear interpolation is used. The segmental
crack growth life, ΔN, between the two discrete crack
lengths, a and a+Δa, is calculated by equation (17).
DN =
a + Da
ò
a
In LEFM the correlation between ΔKth and ΔJth is given
by the Eq. (11).
Technical Gazette 18, 3(2011), 459-466
The modified Dowling and Begley model (2) which
takes account of the J-integral threshold, ΔJth, is represented
by Eq. (14).
da
C [DK I (a )]m
.
(17)
The total fatigue life of a specimen is calculated as a
sum of segmental fatigue lives, ΣΔN. For the other crack
growth equations the integration is performed in a similar
manner.
461
Application of the ΔK, ΔJ and ΔCTOD parameters in fatigue crack growth modelling
3
Experimental results of fatigue crack growth in a
centrally cracked plate
Eksperimentalni rezultati rasta pukotine u ploči sa
središnjom pukotinom
Ž. Božić, M. Mlikota, S. Schmauder
Table 2 Material properties of the specimen
Tablica 2. Svojstva materijala uzorka
Yield strength
Tensile strength
Elastic modulus
Poisson ratio
235 MPa
≥ 400 MPa
206 GPa
0,3
By using a hydraulic fatigue testing machine a plate
specimen with a central crack was exposed to constant
amplitude cyclic tension load until failure occurred, [20].
The specimen geometry is shown in Fig. 3.
Figure 4 Experimentally determined fatigue life curve, a-N.
Slika 4. Eksperimentalno utvrđena krivulja zamora a-N
It is to observe that the crack propagated at a higher
growth rate after a crack length of 30 mm up to a final crack
length ≈ 80 mm, where rapid and unstable crack
propagation took place prior to the final failure.
4
Numerical determination of the K and J-integral and
CTOD parameters
Numeričko utvrđivanje parametara K, J-integral i CTOD
Figure 3 Fatigue test specimen
Slika 3. Uzorak za ispitivanje zamora
Fatigue test conditions applied in the experiment are
given in Tab. 1. The applied average stress range related to a
cross-section in the intact area was Δσo = 80 MPa. The
loading frequency was 5 Hz. The force range and the stress
ratio are denoted by ΔF = Fmax − Fmin and R = Fmin/Fmax,
respectively. The initial notch length was 2a = 8 mm. The
material used for the specimens is conventional mild steel
for welded structures with the material properties specified
in Tab. 2.
Table 1 Loading conditions and geometry characteristics
of the fatigue test specimen
Tablica 1. Uvjeti opterećenja i karakteristike geometrije uzorka
za ispitivanje zamora
ΔF/ N
76800
Ao / mm
960
2
Δσ o / MPa
80
R
0,0253
Crack length data presented here were measured by
using an optical microscope. Obtained crack length values,
a, with respect to the number of applied loading cycles, N,
are given in the a-N diagram shown in Fig. 4. The measured
crack lengths represent the averaged half crack lengths. The
crack lengths given in Fig. 4, start from the first measured
values in the experiment.
462
Fracture mechanics uses concepts from applied
mechanics to develop an understanding of the stress and
deformation fields around a crack tip when a crack is present
in a structure. A sound knowledge of these stress and
deformation fields helps in calculating fracture mechanics
parameters which together with fatigue crack growth
models enable developing fail-safe and safe-life designs for
structures such as aerospace, shipbuilding, nuclear, civil,
and mechanical engineering.
In this section is discussed numerical determination of
fracture mechanics parameters such as the SIF, K, J-integral
and the Crack Tip Opening Displacement, CTOD, by using
FE software, [29].
In order to discretize the specimen geometry the second
order 8-node plane stress elements PLANE183 is
employed. Owning to the double-symmetry only one
quarter of the specimen is modelled. The typical FE mesh of
the centrally notched specimen, with applied symmetry
boundary conditions is given in Fig. 5.
The SIF, K, is normally determined in a linear elastic FE
analysis. In the FEM modelling the crack tip region is
meshed by singular elements. The procedure for the
calculation of SIFs is based on the application of wellknown "quarter-point" elements introduced by Barsoum,
[21]. Barsoum showed that the proper crack tip
displacement and the stress and strain fields are modelled by
standard quadratic order isoparametric finite elements if
one simply moves the element mid-side node to the position
one quarter of the way from the crack tip to the far end of the
element. This procedure introduces a singularity into the
mapping between the element's parametric coordinate
space and Cartesian space.
Tehnički vjesnik 18, 3(2011), 459-466
Primjena ΔK, ΔJ i ΔCTOD parametara u modeliranju rasta zamornih pukotina
Ž. Božić, M. Mlikota, S. Schmauder
observed that the ΔJ reaches a stabilized value by getting
slightly far from the crack tip. In other words, they are
independent of path. The mean value of the calculated ΔJ
parameters was determined, considering the stabilized
values.
Figure 7 J-integral values stabilize with distance increase
of the contour path from the crack tip
Slika 7. Vrijednosti J-integrala stabiliziraju se porastom
udaljenosti putanje konture od vrha pukotine
The J-integral, in its simplest form, can be defined as a
path-independent line integral that measures the strength of
the singular stresses and strains near a crack tip. The
magnitude of J-integral has been evaluated using the
expression suggested by Rice [22].
du y
æ du
J = ò Wdy - ò çç t x × x + t y ×
Γ
dx
dy
è
ö
÷ ds.
÷
ø
The magnitudes of CTOD for various crack lengths are
estimated by 90°-intercept method introduced by Rice [22],
as shown in Fig. 8.
90°
(b)
d
(a)
Figure 5 The finite element mesh model of the centrally notched
plate specimen: a) model of one quarter of the specimen,
b) the crack tip region.
Slika 5. Model mreže konačnog elementa centralno zarezanog uzorka:
a) model jedne četvrtine uzorka, b) područje vrha pukotine
(18)
In the equation the meaning of the used symbols is as
follows: Γ – any path surrounding the crack tip, W – strain
energy density, ti = σij·nj – traction vector, σ – component
stress, n – unit outer normal vector to path Γ, ui –
displacement vector, s – distance along the path Γ. The Jintegral contour path surrounding a crack-tip is illustrated in
Fig. 6.
Figure 8 Definition of the CTOD parameter, δ
Slika 8. Definicija parametra CTOD, δ
y
n
Crack
G
x
ds
Figure 6 J-integral contour path surrounding a crack-tip
Slika 6. Putanje konture J-integrala oko vrha pukotine
It was observed in the analysis, that there exists some
deviation between the magnitudes of estimated ΔJ values
for the paths to close to the crack tip, due to numerical
accuracy. Hence, ΔJ has been calculated over 14 different
contours around the crack tip, as shown in Fig. 7. It is
Technical Gazette 18, 3(2011), 459-466
Figure 9 Estimation of the CTOD by 90° intercepts method
for the specific crack length, a ≈ 68,5 mm
Slika 9. Procjena CTOD-a metodom 90° segmenta pravca
za specifičnu duljinu pukotine, a ≈ 68,5 mm.
For an analyzed crack length, the displacement of each
node along the crack face is listed with the help of ANSYS
post processor [29] and plotted using graphic software.
Such a typical plot for a central notched specimen for the
specific value of crack length is shown in Fig. 9. The
intercept of y-displacement of crack face with the 45° lines
463
Application of the ΔK, ΔJ and ΔCTOD parameters in fatigue crack growth modelling
drawn from the crack-tip is taken as half part of a CTOD
value.
Linear elastic and elastic-plastic FE analysis was
carried out for the considered specimen, assuming the same
loading conditions as implemented in the experiment. The
material properties used in the numerical model correspond
to those given in Tab. 2. For elastic-plastic FE analysis the
material behaviour has been considered to be bilinear
isotropic hardening type pertaining to the mild steel as given
in Fig. 10. Once static analysis is completed, the general
postprocessor is used to calculate fracture mechanics
parameters, [29].
Tensile stress σ /MPa
σu = 400 MPa
σY = 235 MPa
ß
F = tanß
Ž. Božić, M. Mlikota, S. Schmauder
Figure 12 ΔJ-integral range values calculated by using
the LE and EP analysis and threshold values
Slika 12. Vrijednosti raspona ΔJ-integrala korištenjem analize
LE I EP i graničnih vrijednosti
increase faster. This indicates that small scale yielding
conditions prevail only for smaller crack lengths and for
longer cracks a larger plastic zone occurs. Fig. 13 shows the
values of the calculated ΔCTOD as a function of the crack
length, obtained by using an EP FE analysis. The threshold
ΔCTODth values are given in the figure as well.
E = tanα
α
α
23 Strain ε /%
Figure 10 Bilinear isotropic hardening material characteristic
Slika 10. Karakteristika bilinearnog izotropnog očvršćivanja materijala
5
Results and discussion
Rezultati i diskusija
The Mode I stress intensity factors, KI, were determined
for the considered specimen by using linear elastic analysis,
as described in the previous section. The calculated stress
intensity factor range values, ΔKI, with respect to the half
crack length are given in Fig. 11.
Figure 13 Values of ΔCTOD and ΔCTODth as a function of crack length
Slika 13. ΔCTOD i ΔCTODth vrijednosti u funkciji duljine pukotine
Figure 14 Simulated fatigue life curves in comparison
with experimental results
Slika 14. Simulirane krivulje životnog vijeka u usporedbi
s eksperimentalnim rezultatima
Figure 11 Calculated stress intensity factors as a function
of crack length.
Slika 11. Izračunati faktori intenziteta naprezanja kao funkcija
duljine pukotine
ΔJ-integral range was calculated based on both, the
LEFM and EPFM assumptions. Fig. 12 shows the ΔJ
–integral range values with respect to crack length, obtained
by the LE analysis, ΔJLE, and the EP analysis, ΔJEP.
Threshold ΔJth values are illustrated in the figure as well.
Initially, up to a half crack length a ≈ 30 mm, the calculated
values in the LE and EP analysis give close results and for
longer cracks ΔJEP values calculated in the EP analysis
464
The integration of models has been performed by using
MATLAB software. For the LE model (13) the threshold
stress intensity range is constant and is equal to: ΔKth = 2,9
MPa m , [23]. The constants of the crack growth model are:
Cp = 1,43×10⁻¹¹ and mp = 2,75. The units for ΔK and da/dN
are MPa m and m, respectively. For modified Dowling and
Begley model, represented by Eq. (14), the crack growth
-4
model parameters are taken as Cdb = 2,8967×10 , mdb =
1,375. The units for ΔJ and da/dN are MPa·m and m,
respectively. The integration is performed for the model
taking into account the values ΔJLE and ΔJEP, and threshold
Tehnički vjesnik 18, 3(2011), 459-466
Ž. Božić, M. Mlikota, S. Schmauder
values ΔJth given in Fig. 12. For the model given by (15) the
integration is performed using the ΔCTOD and threshold
ΔCTODth values given in Fig. 13. For this model the crack
growth parameters are: Cctod = 0,6012 and mctod = 1,375. The
units for ΔCTOD and da/dN are m and m, respectively. Fig.
14 shows the simulated fatigue life curves for the
considered models in comparison to the experimental
fatigue life curve.
Linear elastic analysis models based on the parameters
ΔK and ΔJLE provide identical fatigue life curves. The
models provide a very good agreement with experiential
data up to a crack length a ≈ 30 mm. However, these models
predict a slower crack growth in the last part of the total
fatigue life, and provide a too long fatigue life, compared to
experimental results. The elastic-plastic analysis based
models, with the parameters ΔJEP and ΔCTOD, provided
very close fatigue life curves, where the simulated fatigue
life is slightly shorter compared with the experiment.
6
Conclusion
Zaključak
Fatigue crack growth test on a mild steel centrally
cracked plate specimen subjected to constant load
amplitude showed high crack growth rates in the last part of
the specimen's total fatigue life. Crack growth models
which take LEFM parameters ΔK and ΔJLE, and EPFM
parameters ΔJEP and ΔCTOD as a crack driving force, were
developed in order to simulate fatigue crack growth life for
the test specimen. The calculated ΔJLE and ΔJEP values
obtained by linear elastic and elastic plastic FE analysis,
respectively, are close initially, for shorter crack lengths.
For longer cracks the ΔJEP values are higher as compared
with the ΔJLE values. Initially, for shorter crack lengths
small scale yielding conditions prevailed, and for longer
cracks a larger plastic zone occurs. The LE models predicted
a slower crack growth in the last part of the total fatigue life,
and provided a too long fatigue life, compared to
experimental results. The models based on EPFM
parameters ΔJEP and ΔCTOD provided better agreement
with experimental results for higher crack growth rates,
compared with the LEFM models based on parameters ΔK
andΔJLE.
7
References
Literatura
[1] Broek, D. The Practical Use of Fracture Mechanics. Kluwer
Academic Publishers, Dordrecht, 1988.
[2] Schijve, J. Fatigue of Structures and Materials. Springer
Science+Business Media, B. V., 2009.
[3] Santus C., Taylor D. Physically short crack propagation in
metals during high cycle fatigue. // International Journal of
Fatigue, 31, 8(2009), 1356–1365.
[4] Schijve, J. Fatigue of structures and materials in the 20th
century and the state of the art. // International Journal of
Fatigue, 25, 1( 2003), 679-702.
[5] Schijve, J.; Campoli, G.; Monaco, A. Fatigue of aircraft
materials and structures. // International Journal of Fatigue,
16, 1(1994), 21-32.
[6] Vasudevan, A. K.; Sadananda, K.; Glinka, G. Critical
parameters for fatigue damage. // International Journal of
Fatigue, 23, 1(2001), 39–54.
Technical Gazette 18, 3(2011), 459-466
Primjena ΔK, ΔJ i ΔCTOD parametara u modeliranju rasta zamornih pukotina
[7] Sadananda, K.; Vasudevan, A. K. Crack tip driving forces and
crack growth representation under fatigue, International
Journal of Fatigue, 25, (2003), 899–914.
[8] Palmgren, A. The endurance of ball bearings. Z. Ver Deut Ing,
68, (1923), 339-341.
[9] Miner, M. A. Cumulative damage in fatigue. Journal of
Applied Mechanics, 12, (1945), 159–164.
[10] Paris, P.; Erdogan, F. A critical analysis of crack propagation
laws. Journal of Basic Engineering, 85, (1963), 528–534.
[11] Walker, E. K. The effect of stress ratio during crack
propagation and fatigue for 2024-T3 and 7076-T6 aluminum.
In: Effect of environment and complex load history on fatigue
life. ASTM STP 462. Philadelphia: American Society for
Testing and Materials, 1970.,1–14.
[12] Forman, R. G. Study of fatigue crack initiation from flaws
using fracture mechanics theory. Engineering Fracture
Mechanics, 4, 2(1972), 333–345.
[13] Dowling, N. E.; Begley J. A. Fatigue crack growth during
gross plasticity and the J-integral. Mechanics of Crack
Growth. ASTM STP 590, American Society for Testing and
Materials, Philadelphia, PA, 1976., 82-105.
[14] Branco, C. M.; Radon, J. C.; Culver, L. E. Elastic-plastic
fatigue crack growth under load cycling. // The Journal of
StrainAnalysis for Engineering Design, 12, 2(1977), 71-80.
[15] Chow, C. L.; Lu, T. J. On the Cyclic J-integral Applied to
Fatigue Cracking. // International Journal of Fracture, 40,
1989., 53–59.
[16] Gasiak, G.; Rozumek, D. ΔJ-integral range estimation for
fatigue crack growth rate description. // International Journal
of Fatigue, 26, 2(2004), 135–140.
[17] Liu, Y.; Mahadevan, S. Threshold stress intensity factor and
crack growth rate prediction under mixed-mode loading. //
Engineering Fracture Mechanics, 74, (2007), 332–345.
[18] Pook, L. P. The fatigue crack direction and threshold behavior
of mild steel under mixed-mode I and III loading. //
International Journal of Fatigue, 7, (1985), 21–30.
[19] Zheng, X.; Hirt, M. A. Fatigue crack propagation in steels. //
Engineering Fracture Mechanics, 18, 5(1983), 965–973.
[20] Sumi, Y.; Bozic, Z.; Iyama, H.; Kawamura, Y. Multiple
Fatigue Cracks Propagating in a Stiffened Panel. // Journal of
the Society of Naval Architects of Japan, 179, (1996), 407412.
[21] Barsoum, R. Further application of quadratic isoparametric
elements to linear fracture mechanics of plate bending and
general shells. // International Journal for Numerical
Methods in Engineering, 11, (1976), 167-169.
[22] Rice, J. R. A Path Independent Integral and the Approximate
Analysis of Strain Concentration by Notches and Cracks. //
Journal ofApplied Mechanics, 35, (1968), 379–386.
[23] Okawa, T.; Sumi, Y.; Mohri, M. Simulation-based fatigue
crack management of ship structural details applied to
longitudinal and transverse connections. // Marine
Structures, 19, (2006).
[24] Shih, C. F. Relationship between the J-integral and the Crack
Tip Opening Displacement for Stationary and Extending
Cracks. // Journal of the Mechanics and Physics of Solids,
29, (1981), 305–326.
[25] Klesnil, M.; Lukáš, P. Fatigue of metallic materials. Materials
Science Monographs, 7, 1980.
[26] Tada, H.; Paris, P. C.; Irwin, G.R. The Stress Analysis of
Cracks Handbook. American Society of Mechanical
Engineers, 2000.
[27] Božić, Ž.; Wolf, H.; Semenski, D. Fatigue Growth of Multiple
Cracks in Plates under Cyclic Tension. // Transactions of
FAMENA, 34, 1(2010), 1 – 12.
[28] Shahani, A. R.; Moayeri Kashani, H.; Rastegar, M.;
Botshekanan Dehkordi, M. A unified model for the fatigue
crack growth rate in variable stress ratio, Fatigue & Fracture
of Engineering Materials & Structures, 32, 2(2009), 105-118.
[29] Swanson Analysis System, Inc. ANSYS User's Manual
Revision 11.0, 2009.
465
Application of the ΔK, ΔJ and ΔCTOD parameters in fatigue crack growth modelling
Ž. Božić, M. Mlikota, S. Schmauder
[30] McEvily, A. J. Phenomenological and Microstructural
Aspects of Fatigue. Presented at the Third International
Conference on the Strength of Metals andAlloys, Cambridge,
England; published by the Institute and The Iron and Steel
Institutes, Publication, W33, 1974., 204-213.
[31] Beden¸ S. M.; Abdullah, S.; Ariffin, A. K. Review of Fatigue
Crack Propagation Models for Metallic Components //
European Journal of Scientific Research. The Web version
(2009).
URL:http://www.eurojournals.com/ejsr.htm. (21.12.2010.).
URL:http://onlinelibrary.wiley.com/journal/10.1111/%28IS
SN%291460-2695. (21.12.2010.).
Authors' addresses
Adrese autora
Željko Božić, PhD, Professor
Deptartment of Aeronautical Engineering
Faculty of Mechanical Engineering and Naval Architecture
University of Zagreb
Ivana Lucica 5, HR-10000 Zagreb, Croatia
Tel.: +385-(0)1-6168 536
Fax.: +385-(0)1-6156 940
Email: [email protected]
Marijo Mlikota, Mag. Ing. Mech.
Faculty of Mechanical Engineering and Naval Architecture
University of Zagreb
Ivana Lucica 5, HR-10000 Zagreb, Croatia
Email: [email protected]
Siegfried Schmauder, Prof. Dr. rer. nat.
Institute for Materials Testing, Materials Science
and Strength of Materials (IMWF)
University of Stuttgart
Pfaffenwaldring 32, D-70569 Stuttgart, Germany
Tel.: 0711/685-62556
Fax: 0711/685-62635
Email: [email protected]
466
Tehnički vjesnik 18, 3(2011), 459-466
© Copyright 2026 Paperzz