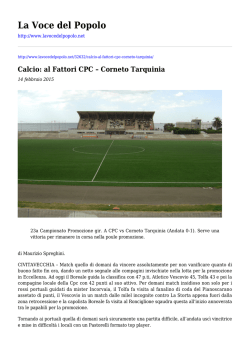
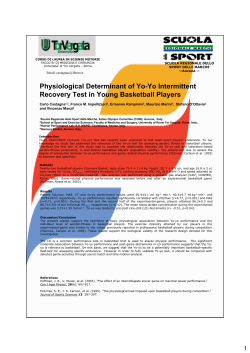
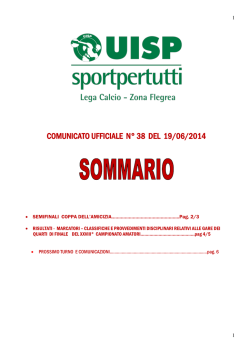
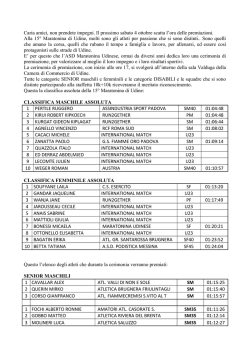
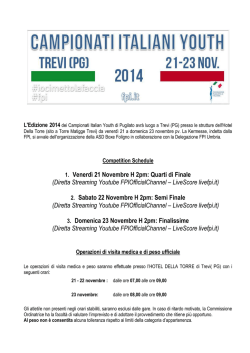
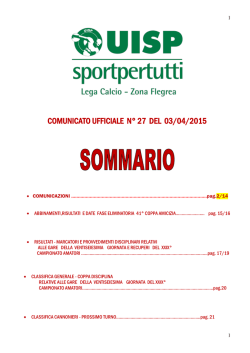
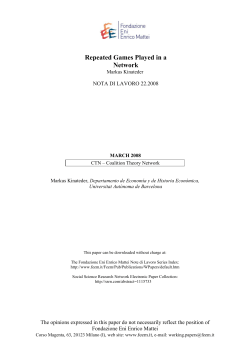
AIPAC Lombardia e Scuola di Scienze Motorie - Università degli Studi Milano presentano:
SEMINARIO DI AGGIORNAMENTO
“L’ALLENAMENTO DEL GIOVANE CALCIATORE: DALLA TEORIA ALLA PRATICA”
Lunedì 27 gennaio 2014 - aula “A. Miani” - via Mangiagalli, 31 - 20133 - Milano
(Ore 13,30: Accredito partecipanti)
Il modello prestativo in età evolutiva
PROGRAMMA:
Ore 14,15: Saluto autorità e presentazione programmi:
E. Rampinini
C. Sforza (Unimi) - A. Veicsteinas (Unimi) - A. Fiorilli (Unimi) - E. Arcelli (Unimi)
Interverranno rappresentanti di Settori Giovanili professionistici
Ore 14,55: PRIMA SESSIONEMapei
Sport Research Center, Italy
Università degli studi di Milano, Italy
Crescita e sviluppo del giovane calciatore
ANNI '70-'80
Distanza totale percorsa
in una partita: 7-8 km
Reilly T, 1976
OGGI
Distanza totale percorsa
in una partita: 10-11 km (+40%)
Bradley PS et al, 2013
~25% (~2.5 km) corsa >15 km/h
~10% (~1 km) corsa >20 km/h
In una stagione:
Fino a ~ 45 partite
In una stagione:
Fino a ~ 65 partite (+40%)
Il modello prestativo in età evolutiva, E. Rampinini
La Performance Fisica dei Giovani in Partita
Il modello prestativo in età evolutiva, E. Rampinini
tracting the chronological age at the time of measureme
(as evidenced
field tests
results),
andperformance
3) evaluate
the magniTable
1 Physicalvia
capacities
and match
running
according
to age. data
anthropometric,
maturity
and physical capacities
n =the
10 age at estimated
n = 12 PHV [28]n.= 17
n = 14
U13 a,b,c,d,e
U14 c,d,e
U15 d,e
U16
U17
U18
d,e
e
0.7 ± 0.5
0.1 ± 0.7
0.6 ± 0.8
1.6 ± 0.6
2.2 ± 0.4
year from PHV
1.7 ± 0.4
anthropometric,
maturity 161
data
Experimental
procedures
height (cm)
150 ± 6a,b,c,d,e
159 ± 7d,e
±and
6d,e physical capacities
163
±9
170 ± 7
171 ± 9
b,c,d,e
d,e
danalyses
number
of
players
n
=
7
n
=
17
n
=
10
n
=
12
n
=
17
n56.3
= 14against
Methods
Match
were
performed
on
42
matches
i
body mass (kg)
39.3 ± 5.1
43.9 ± 5.2
48.8 ± 9.8
52.0 ± 7.2
58.1 ± 4.7
± 7.5
a,b,c,d,e
c,d,e
d,e
d,e
e
d,e
0.7±±3.1
0.5b,c,d,e
0.1±±4.1
0.7club
0.6played
0.8d,e over42.6
1.6
0.6
2.2±±5.2
0.4
year(cm)
from PHV
1.7±±2.5
0.4a,b,c,d,e
tional
teams,
a 4-month
period.
Each
CMJ
27.5
32.0
39.2
37.9
±±3.7
±±4.0
44.5
Training
&
Testing
a,b,c,d,ea,b,c,d,e
d,e
d,e
b,c,d,e
d,e
e
height
(cm)
150
±
6
159
±
7
161
±
6
163
±
9
170
±
7
171
±
9
Acc (s)
1.96 ± 0.07
1.89 ± 0.06
1.79 ± 0.08
1.77 ± 1
0.05
± 0.04
1.71
Subjects
player
was assessed
–9 times.1.74
The
high level
of± 0.06
the op
b,c,d,e
d,e
d
1 (kg)
a,b,c,d,e
b,c,d,e
d,e
d,e
e
body
mass
39.3
±
5.1
43.9
±
5.2
48.8
±
9.8
52.0
±
7.2
58.1
±
4.7
56.3
±
7.5
PV (km.h )
25.4
± 0.7was collected
27.0
± 1.8 and the 29.4
± 1.0
31.3 ±format
0.7
32.3 reduced
± 1.9
Time-motion
match analysis
data
on± 1.5
99 young 29.0
teams
same
competition
likely
a,b,c,d,e
b,c,d,e
d,ed,e
d,ee
a,b,c,d,e
b,c,d,e
CMJ
(cm)
27.5
±
2.5
32.0
±
3.1
39.2
±
4.1
37.9
±
3.7
42.6
±
4.0
44.5
RSAmean players belonging to 65.15
0.08 age groups
4.88
± 0.16 from
4.60 ± 0.20
4.51 ± 0.12
4.39 ± 0.12
4.31±±5.2
0.17
football
di ±erent
ranging
a,b,c,d,e
b,c,d,e
d,e
e
1
a,b,c,d,e
d,e
e
e
Acc
(s)
1.96
±
0.07
1.89
±
0.06
1.79
±
0.08
1.77
±
0.05
1.74
±
0.04
1.71
±
0.06
VVam-eval (km.h )
13.7 ± 0.8
15.3 ± 1.4
15.8 ± 1.3
15.8 ± 1.1
16.6 ± 0.9
17.4 ± 0.9
1
a,b,c,d,e
b,c,d,e
d,e
d,e
e
PV (km.h )
25.4 ± 0.7
27.0 ± 1.5match running
29.0
± 1.8
29.4 ± 1.0
31.3 ± 0.7
32.3 ± 1.9
performance
Table 1 Physical capacities and match running performance according
to age.
a,b,c,d,e
b,c,d,e
d,e
e
RSAmean of files
± 0.08
± 0.16
± 0.20
± 0.12
± 0.12
± 0.17
number
n = 5.15
18 files
n = 4.88
40 files
n =4.60
25 files
n =4.51
21 files
n =4.39
29 files
n = 4.31
53 files
1
a,b,c,d,e
d,e
e
e
VVam-evaltime
(km.h )
± 0.8
± 1.4
± 1.3
± 1.1
± 0.9
± 0.9
U15
U16
U18
playing
2 ×13.7
35U13
min
2 ×15.3
35U14
min
2 15.8
× 40
min
2 ×15.8
40 min
2 16.6
×U17
40 min
2 ×17.4
45
min
e
match
running
7383 ± 640b,c,d,e
8129
±
879physical
8312 ± 1054
8707 ± 1101
8867 ± 859
TD (m)
6549 ± 597a,b,c,d,e
anthropometric,
maturity
dataperformance
and
capacities
b,c,d,e
b,c,d,e
number
of
fi
les
n
=
18
fi
les
n
=
40
fi
les
n
=
25
fi
les
n
=
21
fi
les
n
=
29
fi
les
nn==53
les
LIR
(m) of players
5370
5799
6288
6480
6749
6650
number
n = 7 ± 470
n = 17± 454
n = 10± 610
n = 12± 845
n = 17± 768
14±fi565
b,c,d,e
playing
time
2 ×1.7
35
min
2821
×0.7
35±min
2954
×0.1
40±±
min
2968
×0.6
40±min
2991
×1.6
40±min
2976
×2.2
45±min
HIR
671
± 180
297
±231
0.5c,d,e
0.7d,e
±258
0.8d,e
±370
0.6e
±240
0.4
year(m)
from
PHV
± 0.4a,b,c,d,e
a,b,c,d,e
b,c,d,e
e
Authors
M. Buchheit, A. Mendez-Villanueva
, B. M. Simpson, P.d,e
C. Bourdon
b,c,d,e
e
a,b,c,d,e
d,e
7383
±
640
8129
±
879
8312
±
1054
8707
±
1101
8867
±
859
TD
(m)
6549
±
597
VHIR
(m)
323
446± 7162
477±±6156
479±±9180
519± 7155
574± 9134
height
(cm)
150±±87
6
159
161
163
170
171
b,c,d,e
b,c,d,e
b,c,d,e
ed,e
ed for Sports Excellence,
eQatar
e
A liations
Physiology5799
Unit, Sport
Science
Department, 6288
ASPIRE, ±
Academy
Doha,
b,c,d,e
LIR
(m)
5370
±
470
±
454
610
6480
±
845
6749
±
768
6650
565
Sprinting
(m)
186
± 92
318
410
384
449
666
body mass
(kg)
39.3
± 5.1
43.9±±183
5.2
48.8±±204
9.8
52.0± ±163
7.2
58.1 ±147
4.7
56.3±±±256
7.5
b,c,d,e
a,b,c,d,e
d,e
e
e
e
a,b,c,d,e
b,c,d,e
d,e
d,e
HIR
671
180
821±±±307
231
954±±±311
297
968
258
991±±±221
370
976±±±337
240
VHIA
(m)
509
±±156
763
887
864
967
1239
CMJ(m)
(cm)
27.5
± 2.5
32.0
3.1
39.2
4.1
37.9±±±314
3.7
42.6
4.0
44.5
5.2
b,c,d,e
eb,c,d,e
1
a,b,c,d,e
e
e
e
a,b,c,d,e
b,c,d,e
d,e
e
VHIR
(m) speed (km.h )
323
± 87
446
± ±162
477
± 156
479
± ±180
519
±±
155
574
± 134
peak
game
22.3
±±1.4
24.4
26.0
±±2.4
26.3
26.6
28.3
± 2.2
Acc (s)
1.96
0.07
1.89
±1.8
0.06
1.79
0.08
1.77
±2.3
0.05
1.74
±2.2
0.04
1.71
0.06
b,c,d,e
e
e
ed,e
e
1
a,b,c,d,e
b,c,d,e
d,e
e
Sprinting
186
± 92
318 ±±183
410
±±204
384
±±163
449
±±147
666 ±14
PV (km.h
)
25.4
± 0.7 running performances
27.0
1.5
1.8
29.4capacities
1.0 of the31.3
0.7
32.3
±256
1.9
Mean
( ± SD)(m)
values
of anthropometric
and
match
and least squared29.0
means
( ± SE) of physical
Under
13 (U13), Under
(U14), U
a,b,c,d,e
d,e b,c,d,e
e d,e
e e
e
a,b,c,d,e
VHIA
(m)
5095.15
± 156
763
± 307PHV peak height
887
± 311
± 314
±±
221
1239
± 337
(U15),
Under 16 (U16), Under 17 (U17)
and
Under
soccer
players.
velocity.
Field tests:864
counter
movement967
jump
(CMJ),
(Acc),
RSAmean
± 0.0818 (U18)
4.60
± 0.20
4.51
± 0.12
4.39
0.12 acceleration
4.31
±
0.17pe
Abstract 4.88 ± 0.16
eta-squared ( 2): 0.20–0.45). When adjusted for
Key words
1
a,b,c,d,e
b,c,d,e
e
e
e
1
a,b,c,d,e
d,e
e
e
peak
game
speed
) football
22.3sprint
1.4 test (RSAmean) and
24.4
1.8
26.0
± 2.4
2.3
26.6
±running
2.2 performance:
28.3
± 2.2
ity
(PV),
mean
sprint
time on the
repeated
peak
running
speed during
incremental
fi26.3
eld test
(VVam-eval
). 16.6
Match
running
total d
VVam-eval
(km.h
) (km.h
13.7
±±0.8
15.3
± ±1.4
15.8
±the
1.3
15.8
±±1.1
± 0.9
17.4
± 0.9
age and individual
playing
time,
match
tude
of these
relationships for
separate playing
number
of players
n = each
7
n = 17position.
Nei giovani calciatori, la performance fisica nel corso delle
partite aumenta con l’aumentare dell’età
Match Running Performance and Fitness in Youth
Soccer
Tempo di gioco:
70’
70’
80’
80’
80’
90’
high-intensity running
1 les of highly trained young socactivity
profi
performance
position-dependent
covered
low-intensity
running
(LIR; running speed The
< 13.0
km · h
), high-intensity
running
(HIR;
speedwas
from
13.1 to
· h(P1<13
),0.001,
very
high-intensity
runni
match
running
performance
Mean ( ±(TD),
SD) values
of anthropometric
least squared
means
( ±running
SE)
of physical
capacities
of 16
thekm
Under
(U13),
Under 14 (U14),
field tests and match running performances and
2
:
0.13
–
0.40).
MD
covered
the
greater
TD;
CB the
cer
players
were
examined
in
relation
to
age,
1
1
adolescents
(VHIR;
running
speed
from
16.117to(U17)
19
· hfiUnder
) and18
sprinting
distance
(Sprinting;
running
> 19.1Field
km · tests:
h n).=Very
(VHIA)
=nVHIR
(U15),
Under
(U16),
Under
and
(U18) soccer
players.
height
velocity.
counter
jump
(CMJ),
acceleration
(Acc), pe
number
of fi16
les
n km
= 18
les
n = 40
files PHV peak
n speed
= 25
files
21 fihigh-intensity
les movement
n =activities
29 files
= 53+fiSprinting
les
lowest (P < 0.05). Distance for VHIA was lower for
playing position and physical capacity. Time2
CB compared with all other
positions (P < 0.05); W
motion
meananalyses (global positioning system) were
Vam-eval
1 players
1 Relaa,b,c,d,e performed on 77
b,c,d,e(U13–U18; fullbacks e and S displayed the highest VHIA (P < 0.05).
tionships between match running performance
[FB], centre-backs [CB], midfielders [MD], wide
1 b,c,d,e
1
b,c,d,e
and physical capacities were position-dependmidfielders [W], second strikers [2ndS] and strik2 non-significant correlations
b,c,d,e
ers [S]) during 42 international club games. Total
ent, with poor or
distance covered (TD)e and very high-intensity
within FB, CB, MD and W (e. g., VHIA vs. VVam-eval:
323 ± 87b,c,d,e
446 ± >162
± 156 r = 0.06 in 479
± 180
519within
± 1552ndS
computed
FB) but
large associations
activities (VHIA;
16.1 km · h 1) were 477
b,c,d,e
e
e
e
= 0.70e in
during 186318
entire
Physical
g., VHIA vs. VVam-eval
186 ± 92
±player-matches.
183
410capac± 204 and S positions
384 ±(e.163
449 :±r147
nd
ity was
via field
(e.Med
g., peak e 2 S). In highly trainede young soccer players, ethe
Performance
and Fitness
inassessed
Youth
Intmeasures
J Sports
509 ± 156a,b,c,d,e
763 ±Soccer.
307d,etest
887
± 311
864 ± 314
967 ± 221
importance of fitness level as a determinant of
running speed during an incremental field test,
a,b,c,d,e
b,c,d,e
e
e
22.3 ± 1.4
24.4 running
± 1.8 performance 26.0
± 2.4 match running
26.3
± 2.3
26.6
± 2.2e
showed
performance
should
be regarded
VVam-eval). Match
global positioning system
VHIR (m)
Sprinting (m)
Buchheit
M et al. Match Running
VHIA (m)
peak game speed (km.h 1)
ded by: Aldo Sassi. Copyrighted material.
TD = U18 vs U13 +33%
age-group
e ect:
all Ptime
< 0.001.
a: signifi
di erence
vs. U14 ()P2and
<×0.05),
b:running
vs. U15,speed
c: vs.2during
U16,
vs.incremental
U17, e: vs.2VHIA,
U18.
: e(Vect
size2
ity
(PV), mean
sprint
on the
repeated
sprint
test (RSA
peak
the
eld min
test
). ×Match
running
performance:
playing
time
2 ×cant
35 min
35
min
× 40d:
min
×fi40
40 min
2 × 45
min total
distance
> 16.1
km/h
VHIA
=
U18
vs
U13
+90%
covered
(LIR; running
· h ± ),
high-intensity running
13.1 to 16
km ·±h1101
), very high-intensity
7383
640
8129 ±(HIR;
879 running speed
8312 ±from
1054
8707
8867 ± 859 runn
TD (m) (TD), low-intensity running 6549
± 597 speed < 13.0 km
Sprinting,
distance
>
19.1
km/h
(VHIR;
km ·±h470
) and sprinting distance
running
speed
> 19.1 km · h 6480
). Very
high-intensity
activities
VHIR
Sprinting
LIR (m)running speed from 16.1 to 19
5370
5799 ±(Sprinting;
454
6288
± 610
± 845
6749
± 768 (VHIA) =6650
±+565
Sprinting
=
U18
vs
U13
+141%
Buchheit
M
et
al.
Match
Running
Performance
and
Fitness
in
Youth
Soccer.
Int
J
Sports
Med
age-group
e
ect:
all
P
<
0.001.
a:
signifi
cant
di
erence
vs.
U14
(
P
<
0.05),
b:
vs.
U15,
c:
vs.
U16,
d:
vs.
U17,
e:
vs.
U18.
:
e
ect
size
HIR (m)
671 ± 180
821 ± 231
954 ± 297
968 ± 258
991 ± 370
976 ± 240
134
Buchheit et574
al., ±2010
Il modello prestativo in età evolutiva,
666 ± 256
1239 ± 337
E. Rampinini
28.3 ± 2.2
tude of these relationships for each separate playing position.
Methods
the age at estimated PHV [28].
Experimental procedures
Match analyses were performed on 42 matches against in
tional club teams, played over a 4-month period. Each o
Match analyses were performed on 42 matches against in
player was assessed 1–9 times. The high level of the op
tional club teams, played over a 4-month period. Each o
teams and the same competition
Training format
& Testing likely reduced m
player was assessed 1–9 times. The high level of the op
teams and the same competition format likely reduced m
Experimental procedures
Nei giovani calciatori, parallelamente si sviluppano anche le
Time-motion match analysis data was collected
on 99 young
qualità
atletiche
Subjects
football players belonging to 6 di erent age groups ranging from
Methods
Subjects
Time-motion match analysis data was collected on 99 young
football
belonging
6 di running
erent
age
groups
ranging
Match
Running
Performance
Table 1 players
Physical capacities
andtomatch
performance
accordingfrom
to age.
Soccer
U14
Table 1 Physical capacities and matchU13
running performance according
to age.
and Fitness in Youth
U15
U16
U17
U18
anthropometric, maturity data and physical capacities
U13
U14
U15
U16
U17
U18
number of players
n=7
n = 17
n = 10
n = 12
n = 17
n = 14
d,e
maturity data
physical
capacities
0.7 ± 0.5c,d,e
0.1and
± 0.7
0.6 ± 0.8d,e
1.6 ± 0.6e
2.2 ± 0.4
year from PHV
1.7 ± 0.4a,b,c,d,e anthropometric,
a,b,c,d,e
d,e
d,e
number
of
players
n
=
7
n
=
17
n
=
10
n
=
12
n
=
17
n
=
height (cm)
150 ± 6
159 ± 7
161 ± 6
163 ± 9
170 ± 7
17114
±9
a,b,c,d,e
c,d,e
d,e
d,e
e
b,c,d,e
d,e
d
0.7
±
0.5
0.1
±
0.7
0.6
±
0.8
1.6
±
0.6
2.2
year
from
PHV
1.7
±
0.4
body mass (kg)
43.9
± 5.2
48.8 ±, 9.8
52.0 ± 7.2
58.1 ± 4.7
56.3±±0.4
7.5
Authors 39.3 ± 5.1
M. Buchheit
, A. Mendez-Villanueva
, B. M. Simpson
P. C. Bourdon
a,b,c,d,e
d,e
d,e
a,b,c,d,e
b,c,d,e
d,e
d,e
height
(cm)
150
±
6
159
±
7
161
±
6
163
±
9
170
±
7
171
±
9
CMJ (cm)
27.5 ± 2.5
32.0 ± 3.1
39.2 ± 4.1
37.9 ± 3.7
42.6 ± 4.0
44.5 ± 5.2
A liations
Physiology Unit, Sport Science Department, ASPIRE, Academy for Sports Excellence, Doha, Qatar
b,c,d,e
d,e b,c,d,e
d d,e
a,b,c,d,e
e
body
mass
(kg)
39.3
±
5.1
43.9
±
5.2
48.8
±
9.8
52.0
±
7.2
58.1
±
4.7
56.3
±±
7.5
Acc (s)
1.96 ± 0.07
1.89 ± 0.06
1.79 ± 0.08
1.77 ± 0.05
1.74 ± 0.04
1.71
0.06
a,b,c,d,e
b,c,d,e
d,e
d,e
1
a,b,c,d,e
b,c,d,e
d,e
d,e
e
CMJ
(cm)
27.5
±
2.5
32.0
±
3.1
39.2
±
4.1
37.9
±
3.7
42.6
±
4.0
44.5
±
5.2
PV (km.h )
25.4 ± 0.7
27.0 ± 1.5
29.0 ± 1.8
29.4 ± 1.0
31.3 ± 0.7
32.3 ± 1.9
a,b,c,d,e
b,c,d,e
d,e
ee
a,b,c,d,e
b,c,d,e
d,e
Acc
(s)
1.96
±
0.07
1.89
±
0.06
1.79
±
0.08
1.77
±
0.05
1.74
±
0.04
1.71
RSAmean
5.15 ± 0.08
4.88 0.16
4.60 0.20
4.51 ± 0.12
4.39 0.12
4.31±±0.06
0.17
1
a,b,c,d,e
b,c,d,e
d,e
d,e
e
1
a,b,c,d,e
d,e
e
e
PV
(km.h
)
25.4
±
0.7
27.0
±
1.5
29.0
±
1.8
29.4
±
1.0
31.3
±
0.7
32.3
±
1.9
VVam-eval (km.h )
13.7 ± 0.8
15.3 ± 1.4
15.8 ± 1.3
15.8 ± 1.1
16.6 0.9
17.4 ± 0.9
a,b,c,d,e
b,c,d,e
d,e
e
2
RSAmean
4.60
± 0.20 eta-squared
4.51
± 0.12
4.39adjusted
± 0.12 for
4.31 ± 0.17
Abstract 4.88 ± 0.16
( ):
0.20–0.45). When
Key words 5.15 ± 0.08
match running
performance
football
age and individual playing
time, match running
1
a,b,c,d,e
d,e
e
e
V
±fi0.8
number
of files )
n13.7
= 18running
les
n15.3
= 40 ±fi1.4
les
n15.8
= 25±fi1.3
les
n15.8
= 21 ±fi1.1
les
n16.6
= 29±fi0.9
les
n17.4
= 53 ±fi0.9
les
Vam-eval (km.h
high-intensity
The activity profiles of highly trained young socperformance was position-dependent (P < 0.001,
fi
eld
tests
2
match inrunning
performance
playing time
2 × 35 min
2 × 35
minexamined
2 × 40
× 40 min
× 40 min
: 0.132
–0.40).
MD covered the2greater
TD; CB the 2 × 45 min
cer players
were
relation
tomin
age,
adolescents
a,b,c,d,e
b,c,d,e
e
lowest
(
P
<
0.05).
Distance
for
VHIA
was
lower for n
playing
position
and
physical
capacity.
Timenumber
= 18±fi597
les
n7383
= 40±fi640
les
n8129
= 25±fi879
les
n8312
= 21±fi1054
les
n8707
= 29±fi1101
les
= 53±fi859
les
8867
TD (m) of files
6549
globaln
positioning
system
CB
compared
with
all
other
positions
(
P
<
0.05); W
motion
analyses
(global
positioning
system)
were
b,c,d,e
b,c,d,e
playing
25370
× 35±min
25799
× 35
min
26288
× 40
26480
× 40±min
26749
× 40
min
× 45 ±
min
LIR (m) time
470
454
±min
610 and S displayed
845
768 Rela- 26650
565
the highest VHIA
(P <±0.05).
performed
on ±77
players (U13–U18;
fullbacks
a,b,c,d,e
b,c,d,e
e
b,c,d,e
between
[FB], centre-backs
[CB], midfielders8129
[MD],±
7383
879
8312
±±1054
8707
±±1101
8867
TD
6549
597
HIR(m)
(m)
671 ±±180
821±±640
231
954
±wide
297 tionships
968
258match running
991performance
370
976±±859
240
nd
and physical capacities were position-dependmidfielders [W], second
b,c,d,e
b,c,d,e
b,c,d,e
e strikers [2 S] and strikLIR
(m)
5370
470
5799
6288
6480
6749
6650
VHIR
(m)
323 ±±87
446±±454
162
477±±610
156
479±±845
180
519±±768
155
574±±565
134
ers [S]) during 42 international club games. Total
ent, with poor or non-significant correlations
b,c,d,e
b,c,d,e
e
e
e
e
HIR
(m) (m)
671
954
968
258
991
976
Sprinting
186±±180
92
318±±231
183
410±±297
204 within FB,
384
±
163
449±vs.
±370
147
666±±240
256
distance 821
covered
(TD) and very high-intensity
CB,±
MD
and W (e. g., VHIA
VVam-eval:
a,b,c,d,e activities (VHIA; > 16.1
e associations withine2ndS
b,c,d,e
ed,ekm · h 1) were computed e r = 0.06 in FB) but large
VHIA (m)
(m)
509±±87
156
763±±162
307
887±±156
311
864±±180
314
967±±155
221
1239
337
vam
VHIR
323
446
477
479
519
574 ±±134
Physical capac-e e and S positions (e. g., eVHIA
vs. VVam-eval: r = 0.70
1
a,b,c,d,e during 186 entire player-matches.
b,c,d,e
e
e in
b,c,d,e
e
e
peak game
speed (km.h )
22.3
± 1.4
24.4
± 1.8
26.0
± 2.4 2ndS). In 384
26.3
± 2.3
26.6
± 2.2 the 666
28.3
± 2.2
Sprinting
(m)
186
± 92
318
± 183
410
± 204
± 163
449
± 147
± 256
highly trained young soccer players,
ity was assessed via field test measures (e. g., peak
Buchheit
et al., 2010
a,b,c,d,e
d,e
e
e
e
fi314
tness level
a Under
determinant
of 1239
running
speed
incremental
fi
eld
test,
VHIA
509and
± 156
763 ±during
307
887
± 311
864of±capacities
967
± 221
337
Mean (m)
( ± SD) values of anthropometric
match running
performances
andan
least
squared
means
( ± SE)importance
of physical
of as
the
13 (U13),
Under±14
(U14), U
performance showed e match running performance
should be regarded
1
a,b,c,d,e VVam-eval). Match running
b,c,d,e
e
e
peak
(km.h
22.3
1.4 18 (U18) soccer24.4
± 1.8PHV peak height
26.0
± 2.4
± 2.3
±(CMJ),
2.2 acceleration
28.3 ±(Acc),
2.2 pe
(U15),game
Underspeed
16 (U16),
Under) 17 (U17)
and±Under
players.
velocity.
Field tests:26.3
counter
movement
jump
Il modello
prestativo
in età26.6
evolutiva,
E. Rampinini
70’
70’
80’
Altezza = U18 vs U13 +14%
Peso = U18 vs U13 +43%
CMJ = U18 vs U13 +62%
an increasing trend with age (P < 0.001, partial
80’
80’
90’
nloaded by: Aldo Sassi. Copyrighted material.
Tempo di gioco:
PV = U18 vs U13 +27%
RSA = U18 vs U13 +19%
V = U18 vs U13 +27%
as a function of playing position.
ity (PV),
mean
sprint
on the repeated
sprint test
(RSAperformances
running
during
the( ±incremental
fieldcapacities
test (VVam-eval
). Match
performance:
totalUd
mean) and peakand
Mean
( ± SD)
values
oftime
anthropometric
and match
running
least speed
squared
means
SE) of physical
of the
Underrunning
13 (U13),
Under 14 (U14),
test followed by Dunn’s post hoc tests. For each ANCOVA, partial
eta-squared ( 2) was calculated as a measure of e ect size. Values of 0.01, 0.06 and above 0.15 were considered as small,
medium and large, respectively [17]. Di erences between the
first and second halves were examined using Student’s independent t-test. The relationships between match running
speeds, match HR and physical fitness variables (MSS, MAS and
Age-related di erences
Age-related match play intensity distribution during the first
and second halves, adjusted for individual playing time, are presented in Fig. 1. During the first half, there was a trend for the
older players to cover greater total distance ( 2 = 0.09). U16, U17
and U18 players covered more distance at S1 than the other 3
Le qualità atletiche dei giovani calciatori divisi per ruolo
tattico non sempre risultano diverse
Table 2
Players’ physical characteristics and performance measures according to playing position.
FB
CB
MD
W-MD
2ndS
S
p-value
n = 20
n = 15
n = 19
n = 24
n = 11
n = 14
2
Age (y)
Height (cm)
Body mass (kg)
MAS (km · h 1)
MSS (km · h 1)
ASR (km · h 1)
14.5 ± 1.6
14.6 ± 1.7
14.3 ± 1.5
14.9 ± 1.7
14.6 ± 1.7
14.4 ± 1.7
0.80
0.02
159.6 ± 9.8
166.3 ± 9.7
162.0 ± 9.4
162.6 ± 11.7
161.9 ± 8.1
166.6 ± 11.2
0.30
0.05
46.8 ± 8.6
54.9 ± 9.9
48.6 ± 9.8
49.9 ± 11.8
48.5 ± 7.6
56.7 ± 15.7
0.06
0.09
16.0 ± 1.3
15.6 ± 2.4
16.0 ± 1.7
16.4 ± 1.1
16.1 ± 1.7
15.9 ± 2.0
0.69
0.02
28.4 ± 2.5
29.9 ± 2.3
28.7 ± 2.9
29.0 ± 2.8
28.7 ± 1.8
29.6 ± 2.9
0.32
0.04
12.3 ± 2.2a
14.3 ± 2.5
12.7 ± 2.1
12.6 ± 2.3
12.6 ± 1.3
13.7 ± 1.7
0.02
0.10
Mean ± SD. FB – Full backs, CB – centre backs, MD – midfielders, W-MD – wide midfielders, 2ndS – second strikers and S – strikers. MAS, maximal aerobic speed (see Methods);
MSS, maximal sprinting speed; ASR, anaerobic speed reserve. a : significant di erence vs. CB (P < 0.05), 2 : e ect size
Mendez-Villanueva et al., 2012
5 000
4 500
Distance Covered (m)
4 000 b,c,d,e
3 500
3 000
2 500
e
c
#
e
b,e
e
e
#
e
e
#
#
e
#
#
e
#
#
#
#
#
c,d
#
2 000
1 500
#
d
Fig. 1 Least squared means for match play running intensity distribution in U13, U14, U15, U16,
U17 and U18 soccer players. Values are adjusted
on total playing time. a: significant di erence
vs. U14 (P < 0.05), b: vs. U15, c: vs. U16, d: vs.
U17, e: vs. U18. # Significant lower vs. first half.
MAS, maximal aerobic speed (see Methods). ASR,
anaerobic speed reserve.
a,b,c,
Il modello prestativo in età evolutiva, E. Rampinini
a,b,c,
Table 2
Training & Testing
Physical capacities and match running performance according to playing positions.
FB
CB
MD
W
2ndS
S
2
P
Mentre come per gli adulti, esistono differenze nella
performance fisica della partita tra giocatori di diverso ruolo
tattico
anthropometric
maturity
data and physical capacities
Table 2 Physical capacities and match running performance
accordingand
to playing
positions.
number of players
n = 15
n = 16
n = 13
n = 13
n=9
n = 11
nd
S
P
height (cm)
163FB
± 11
166CB
±8
164MD
±9
163W
±9
1592± 10
163S± 10
0.35
body mass (kg)
50.6 ± 9.8
53.8
± 8.6
51.6
7.4
53.2physical
± 10.0 capacities
50.1 ± 7.8
51.3 ± 13.4
0.63
anthropometric
and ±
maturity
data and
year
fromofPHV
0.20
number
players
n =0.5
15 ± 1.5
n =0.4
16 ± 1.1
n = 0.6
13 ± 1.3
n =0.6
13 ± 1.3
n =0.6
9 ± 1.2
n =0.1
11 ± 1.5
a,c,e
e
e
e
CMJ
(cm)
36.0
±
0.7
38.7
±
0.6
36.8
±
0.6
40.3
±
1.0
37.6
±
1.0
42.4
±
0.9
<
0.001
Training
&
Testing
height (cm)
163 ± 11
166 ± 8
164 ± 9
163 ± 9
159 ± 10
163 ± 10
0.35
Acc
1.81±±9.8
0.01
1.78±±8.6
0.01
1.81±±7.4
0.01
1.79±±10.0
0.01
1.82±±7.8
0.01
1.78±±13.4
0.01
0.16
body(s)mass (kg)
50.6
53.8
51.6
53.2
50.1
51.3
0.63
Training
&
1
a,c,e
b
e
e
)
28.7
30.0
29.0
30.0
29.0
30.7
< 0.001
PV
year(km.h
from PHV
0.5 ± 0.2
1.5
0.4 ± 0.2
1.1
0.6 ± 0.2
1.3
0.6 ± 0.4
1.3
0.6 ± 0.3
1.2
0.1 ± 0.3
1.5
0.20
a,c,e
a,c,e
e
e c,e
e
RSA
4.73±±0.7
0.03
4.59±±0.6
0.02
4.65±±0.6
0.03
4.51±±1.0
0.04
4.60±±1.0
0.04
4.51±±0.9
0.03
< 0.001
CMJmean
(cm)
36.0
38.7
36.8
40.3
37.6
42.4
1
c
V
15.8
±±
0.2
15.6
±±
0.2
16.3
16.8
16.0
16.1
0.01
Acc
(s) (km.h )
1.81
0.01
1.78
0.01
1.81± ±0.2
0.01
1.79± ±0.3
0.01
1.82± ±0.3
0.01
1.78± ±0.3
0.01
0.16
Vam-eval
1
a,c,e
b
e
e
match
running
performance
)
28.7
± 0.2running performance
30.0 ± 0.2 according29.0
± 0.2
30.0 ± 0.4
29.0 ± 0.3
30.7 ± 0.3
< 0.001
PV (km.h
Table
2 Physical
capacities and
match
to playing
positions.
a,c,e
c,e
number
of
fi
les
n
=
36
fi
les
n
=
54
fi
les
n
=
40
fi
les
n
=
16
fi
les
n
=
19
fi
les
n
=
21
fi
les
RSAmean
4.73 ± 0.03
4.59 ± 0.02
4.65 ± 0.03
4.51 ± 0.04
4.60 ± 0.04
4.51 ± 0.03
< 0.001
a,b
b,c,d
e
e
e
S143
S ±±136
P
FB±±103
CB±±84
MD
W±±155
2nd±±
7675
8665
± ±98
8469
8429
7834
< 0.001
TD
(m) (km.h 1)
8118
VVam-eval
15.8
0.2
15.6
0.2c
16.3
0.2
16.8
0.3
16.0
0.3
16.1
0.3
0.01
b
b
e
e
LIR (m)
6197 ± 81
6197anthropometric
± 66
6638
77runningdata
6231
122 capacities
6524 ± 112
5867 ± 106
< 0.001
match
performance
and± maturity
and ±
physical
a,b
b,c,d,e
d,e
e
e
HIR
(m)
909
±
33
732
±
27
1150
±
32
1037
±
50
988
±
46
766
±
44
< 0.001
number of fiplayers
les
n = 36
n = 54
n = 40
n = 16
n = 19
n = 21
15 files
16 files
13 files
13 files
9 files
11 files
aa,b
b,c,d,e
b,c,d
e
e
e
VHIR
(m)
525
±103
20
363±±±816
552±±998
19
612±±930
514±±10
27
516±±10
26
< 0.001
7675
84
8665
8469
155
8429
143
7834
136
TD
(m)
8118
height
(cm)
163
±±11
166
164
163
159
163
0.35
a,b,e
c,e
c,e
d
ee
b
b
e
Sprinting
(m)
487 ±±27
384
325
26
581
403
686
< 0.001
LIR
(m)
6197
81
6197
±±22
66
6638
6231
122
112
5867
106
body
mass
(kg)
50.6
9.8
53.8±M.
8.6 , A. Mendez-Villanueva
51.6± ±77
7.4 , B. M. Simpson
53.2
10.0
50.1±±38
7.8
51.3±±36
13.4
0.63
Authors
Buchheit
,±
P.±41
C.
Bourdon 6524
a,e
c,e
c,e
de
e
a,b
b,c,d,e
d,e
VHIA
(m)
1012
±
41
747
±
33
877
±
38
1200
±
61
917
±
56
1202
±
53
<
0.001
HIR
909
732
1150
1037
988
766 44
year(m)
from PHV
0.5 ± 33
1.5
0.4Physiology
±27
1.1 Unit, Sport
0.6 ±32
1.3
0.6
±50
1.3 for Sports Excellence,
0.6 ±46
1.2
0.20
A liations
Science
Department, ASPIRE,
Academy
Doha, Qatar 0.1 ± 1.5
1
b,e
aa,c,e
b,c,d,e
eb,e
ec,e
ee
peak
game
speed
(km.h
)
25.9
±
0.3
26.4
±
0.2
24.6
±
0.3
27.0
±
0.5
25.6
±
0.4
28.0
±
0.4
<
0.001
VHIR
(m)
525
±
20
363
±
16
552
±
19
612
±
30
514
±
27
516
±
26
CMJ (cm)
36.0 0.7
38.7 ± 0.6
36.8 ± 0.6
40.3 ± 1.0
37.6 ± 1.0
42.4 ± 0.9
< 0.001
Match Running Performance and Fitness in Youth
Soccer
2
0.06
0.04
0.07
0.21
0.06
0.05
0.04
Testing
0.21
0.07
0.20
0.21
0.09
0.05
0.21
0.20
2
0.29
0.09
0.20
0.40
0.35
0.29
0.06
0.33
0.20
0.04
0.32
0.40
0.07
0.13
0.35
0.21
a,b,e
c,e
c,e
d
e
Sprinting
(m)
487
±±
27
384
±(22
325
± 26
581
±
41
403
± 38
686
±
36
< 0.001
0.33
Mean
( ± SD) values
and
least
squared means
±±SE)
for counter
movement
acceleration
peak
velocity (PV),
mean
sprint time
on the repeated
Acc
(s)anthropometric
1.81
0.01
1.78
0.01
1.81
± 0.01jump (CMJ),
1.79
± 0.01 (Acc),
1.82
± 0.01
1.78
± 0.01
0.16
0.05
a,e
c,eb
c,ee
d
ee
1
a,c,e
sprint
test
(RSA
)
and
peak
running
speed
during
the
incremental
fi
eld
test
(V
),
total
distance
(TD),
low-intensity
running
(LIR),
high-intensity
running
(HIR),
very-highVHIA
(m)
1012
±
41
747
±
33
877
±
38
1200
±
61
917
±
56
1202
±
53
<
0.001
0.32
28.7 0.2
30.0 ± 0.2
29.0
± 0.2
30.0 ± 0.4
29.0 ± 0.3
30.7 ± 0.3
< 0.001
0.21
PV (km.h ) mean
Vam-eval
1
b,e
b,e running activities c,e
e function of playing position (fullbacks (FB),
a,c,e very-high-intensity
c,e
intensity
running
(VHIR),
sprint
running
(Sprinting),
(VHIA)
and
peak
game
speed
reached
as
a
peak
game
speed
(km.h
)
25.9
±
0.3
26.4
±
0.2
24.6
±
0.3
27.0
±
0.5
25.6
±
0.4
28.0
±
0.4
<
0.001
0.13
RSAmean
4.73 ± 0.03
4.59 ± 0.02
4.65 ± 0.03
4.51 0.04
4.60 0.04
4.51 ± 0.03
< 0.001
0.20
Centrocampisti ed esterni > TD e Alta Intensità
Difensori centrali < TD e Alta Intensità
nd
ldo Sassi. Copyrighted material.
1 midfi
c for counter
(CB),
(MD),
wide
midfi
elders (W),
second
(2 16.3
S)movement
and
strikers
(S)).(CMJ),
Values
for
age
and
playing(PV),
time.mean
signifi
cant
di on
erence
vs.
CB
Mean
anthropometric
( ±elders
SD) values
and
least
squared
means
(±±0.2
SE)strikers
jump
(Acc),
peak
sprint
time
the repeated
Vcentre-backs
(km.h
)
15.8
± 0.2
15.6
± 0.2
16.8acceleration
±are
0.3adjusted
16.0
16.1
±a:0.3
0.09
Vam-eval
Abstract
eta-squared
(± 20.3
): velocity
0.20–0.45).
When
adjusted
for0.01
Key words
nd
2
(sprint
P < 0.05),
vs. mean
MD,) c:
vs.peak
W, d:running
vs.football
2 S,
e: vs.during
S. : the
e ect
size
testb:
(RSA
and
speed
incremental
field testmatch
(VVam-eval
), total distance
(TD), low-intensity
runningplaying
(LIR), high-intensity
running (HIR), very-highrunning
performance
age and individual
time, match running
high-intensity running
The
activity
profi
les
of
highly
trained
young
socperformance
was
position-dependent
(
P
0.001, (fullbacks (FB),
intensity
running
(VHIR),
sprint
running
(Sprinting),
very-high-intensity
running
activities
(VHIA)
and
peak
game
speed
reached
as
a
function
of
playing
number of files
n =field
36tests
files
n = 54 files
n = 40 files
n = 16 files
n = 19 files
n = 21 files <position
2
:
0.13
–
0.40).
MD
covered
the
greater
TD;
CB
the
cer
players
were
in
relation
to
age,
nd examined
a,b
b,c,d
e
e
e
centre-backs
(CB), midfielders (MD),
wide
midfielders (W),
second
S) and
Values± are
for age
and playing
time.
a: significant
erence vs.
CB
adolescents
7675
± 84 strikers (2
8665
± 98strikers (S)).8469
155adjusted8429
± 143
7834
± 136
< di
0.001
0.29
TD
(m)
8118
± 103
lowest (P < 0.05). Distance for VHIA was lower for
playing position and physical capacity. Timend
2
global
positioning
bvs. S.system
b
e
e
(
P
<
0.05),
b:
vs.
MD,
c:
vs.
W,
d:
vs.
2
S,
e:
:
e
ect
size
Fig.
2
Correlation
coe
cients
(90
%
confi
dence
TD
LIR (m)
6197 ± 81
6197motion
± 66 analyses6638
± 77
6231were
± 122 CB compared
6524 ±with
112all other5867
± 106
0.20
VHIA
positions
(P < 0.05);<W0.001
(global
positioning system)
FB e and S displayed
a,b
b,c,d,e on 77 players d,e
eCI)highest
FB
*
intervals,
between
match
running
performthe
VHIA
(
P
<
0.05).
Relaperformed
(U13
–
U18;
fullbacks
HIR (m)
909 ± 33
732 ± 27
1150 ± 32
1037 ± 50
988 ± 46
766 ± 44
< 0.001
0.40
CB
tionships
between
match running
performance
[FB], b,c,d,e
[CB], midfielders [MD], wide
CB et al., 2010
Buchheit
ance
and
performance
in
fi
eld tests,
adjusted 0.35
for
VHIR
(m)
525 ± 20a
363 ±
16 centre-backs552
± 19
612
±
30
514
±
27
516
±
26
<
0.001
nd
capacities
were position-dependmidfic,e
elders [W], second strikers
[2
* S] and strikMD d and physical
MD
a,b,e
c,e
e
age
and
individual
playing
time.
Match
running
Fig.
2
Correlation
coe
cients
(90
%
confi
dence
Sprinting (m)TD
487 ± 27
384 ±
22[S]) during 42325
± 26
581Total
± 41 ent, with
403poor
± 38or non-signifi
686cant
± 36correlations
< 0.001
0.33
VHIA
ers
international
club games.
W
FB d
W
performance:
total
distance
(TD),
very-high-ina,e
c,e
c,e
eCI) between
FB
*
intervals,
match
running
performVHIA (m)
1012 ± 41
747 ±
33
1200 ± 61 within FB,
917
± 56
1202
± 53vs. VVam-eval
< 0.001
0.32
:
distance
covered877
(TD)± 38
and very high-intensity
CB,
MD and W (e.
g., VHIA
nd
**
1
nd adjusted
*
**
2CB
S
tensity
running
activities
(VHIA),
sprint
running
S
2nd
e
CB
* computed
ance
and
performance
in
fi
eld
tests,
for
) were
S
r
=
0.06
in
FB)
but
large
associations
within
2
activities
16.1 km
· h c,e
Il
modello
prestativo
in
età
evolutiva,
E.
Rampinini
**
peak game
speed (km.h 1)
25.9 ± 0.3b,e
26.4
± 0.2b,e(VHIA; >24.6
± 0.3
27.0
±
0.5
25.6
±
0.4
28.0
±
0.4
<
0.001
0.13
**
*
: r = 0.70
in running
during 186 entire player-matches. *Physical
capacand S positions
(e.
g.,
VHIA
vs.
Vgame
**
SMD
(Sprinting)
and
peak
speed
reached
during
S
Vam-evaltime.
*
MD
age
and
individual
playing
Match
*
Mean anthropometric ( ± SD) values and least squared means ( ± SE) for counter movement jump (CMJ), acceleration (Acc), peak velocity (PV), mean sprint time on the repeated
Diversi autori hanno comunque suggerito che anche nei giovani
la performance ad alta intensità nel corso delle partite è correlata
alla performance nel test Yo-Yo (come per gli adulti)
Fitness and Match
Performance
in Youth
EFFECTS OF INTERMITTENT
-ENDURANCE
FITNESS
ONSoccer
MATCH PERFORMANCE IN YOUNG MALE SOCCER
PLAYERS
5. High-in
(HIR, s
San Marino Football Federation (FSGC), Department of Research, San Marino; Corso di Laurea in Scienze Motorie, Facolta`
di Medicina e Chirurgia, Universita` di Roma Tor Vergata, Roma, Italy; Neuromuscular Research Laboratory, Schulthess Clinic,
18.0 km
Zurich, Switzerland; Human Performance Laboratory, S. S. MAPEI srl, Via Don Minzoni 34, Castellanza, Varese, Italy; and
Facultad de Educacio´n y Humanidades de Melilla, Departamento de Educacio´n Fı´sica y Deportiva Universidad de Granada,
6. Sprintin
Melilla, Spain
km!h21)
A
players. Consequently, the Yo-Yo IR1 test may be
Journal of Strength and Conditioning Researchsoccer
| www.nsca-jscr.org
7. High-int
regarded as a valid test to assess game readiness and guide
Castagna, C, Impellizzeri, F, Cecchini, E, Rampinini, E, and
training
prescription
in
male
youth
soccer
players.
Barbero Alvarez, JC. Effects of intermittent-endurance fitness
HIR+SP
on match performance
in young male
players. J Strength
K
W evidence)
association football, fitness, match analysis,
activities)
and Yo-Yo
IR1soccer
performance
(convergent
Cond Res 23(7): 1954–1959, 2009—The purpose of this study
The com
(28).
Evidence for the construct validity of coaching,
a fieldYo-Yo
testtestis of
was to examine the effect of specific endurance (Yo-Yo Intergreat
importance
in sport
science
because it assesses the
mittent recovery
test level 1, Yo-Yo
IR1) on match
performance
vs. 11) wer
in male youth soccer.
soccersport
players discipline in special
relevance
of a Twenty-one
field testyoung,
to amale
given
I
(age 14.1 6 0.2 years) were involved in the study. Players were
hour of t
occer is a multifaceted sport that requires wellpopulations
(test specificity)
observed during international
championship(5,23).
games of corredeveloped physical fitness to be successfully played
sponding
age categories
and completeda thenonexperimental,
Yo-Yo IR1 on a
In this
investigation,
descriptive–
(28). Although no comparative studies have been
a regular
separate occasion. Physical (distance coverage) and physiocorrelation
design was used to examine the relationship
performed, physiological match demands (% of
logical match demands were assessed using Global Positioning
maximal heart rate and maximal aerobic power) have been
soccer pit
between
Yo-Yo
physical
match
performance
in young
System technology
andIR1
heartand
rate (HR)
short-range
telemetry,
reported to be similar across competitive levels and gender
respectively.
Duringplayers.
the match (two
30-minutes
halves), players
male
soccer
Players’
physical
load, measured
time
in soccer (28),as
with
any differences being attributable mainly
lasting 30
covered 6,204 6 731 m, of which 985 6 362 m (16%) were
to game
intensity
(distance covered at high intensity) as a
and
distance spent in selected match activities,
was
assessed
reflection of players’ fitness level (17,28).
performed at high intensities (speed .13 km!h , HIA). A
interval). A
using
Position
System
technology
(GPS,
The abilitySPElite,
to perform intermittent, high-intensity exercise
significantGlobal
decrement (3.8%,
p = 0.003)
in match coverage
was
for
prolonged
periods
plays
a
key
role
in
competitive
soccer
evident during the
second half. Physiological
No significant (p = stress
0.07)
GPsports,
Australia).
was assessed by
relative hu
(15–17,19,20). As a consequence, training and testing
difference between halves was observed for HIA (p = 0.56) and
monitoring
heart rate (HR) during competitions
strategies(11,12).
have been proposed to monitor and enhance
sprint (speed .18 km!h , SPR) distances. During the first and
players’ ability to perform high-intensity activities during the
matches w
second halves, players attained the 86 6 5.5 and 85 6 6.0% of
match (12,14,23).
HRmax
(p
=
0.17),
respectively.
Peak
HR
during
the
first
and
Subjects
Recently, with the aim to assess the intermittent endurance
35 6
second halves were 100 6 4 and 99.4 6 4.7% of HRmax,
HIA, > 13and
km/h
abilityyears,
of soccer
players in field condition, the Yo-Yo
Twenty-one
soccer
players
(age
14.1
6
0.2
height
respectively. Yo-Yo IR1 performance (842 6 352 m) was
intermittent recovery test (Yo-Yo IR1) has been developed
To avoid d
significantly
to match
HIA (r =mass
0.77, p 52.5
, 0.001)
totalkg)(4).
1.65
6 related
5.1 cm,
body
6and25
were
randomly
The construct
validity of the Yo-Yo intermittent recovery
distance (r = 0.65, p = 0.002). This study’s results showed that
test
(level
1,
Yo-Yo
IR1)
as
a
measure
of
match-related
chosen among members of a national youth soccer academy
tum drinki
Il (HIA)
modello
prestativo
in età
evolutiva,
specific endurance, as determined by Yo-Yo IR1 performance,
physical performance has been demonstrated by studies
Figure
1. Individual
relationship
between match high-intensity activity
and Yo-Yo
intermittent
recovery
test E. Rampinini
(Federazione
Sammarinese
Giuoco
Calcio,
Sana significant
Marino).
showing
correlation between the Yo-Yo IR1 and
positively affects physical
match performance
in male young
the player
the distance covered at high intensity during the match (15–
CARLO CASTAGNA,1,2 FRANCO IMPELLIZZERI,3 EMILIO CECCHINI,1 ERMANNO RAMPININI,4
´ CARLOS BARBERO ALVAREZ5
AND JOSE
1
2
3
4
5
the
BSTRACT
TM
EY
ORDS
NTRODUCTION
S
21
21
Normalizzazione per il tempo di gioco
Il modello prestativo in età evolutiva, E. Rampinini
Normalizzando per il tempo di gioco le differenze tendono a
diminuire ma restano
Distanza$Totale$(m/min)$
120#
115#
110#
105#
100#
95#
90#
Tempo di gioco:
U13$
U14$
U15$
U16$
U17$
U18$
70’
70’
80’
80’
80’
90’
PRO$
TD = U18 vs U13 +15%
Buchheit et al., 2010 (mod)
Il modello prestativo in età evolutiva, E. Rampinini
Normalizzando per il tempo di gioco le differenze tendono a
diminuire ma restano
Distanza$Totale$(m/min)$
120#
115#
110#
105#
100#
95#
90#
U13$
U14$
U15$
U16$
U17$
U18$
PRO$
Ma restano le differenze rispetto agli adulti
Buchheit et al., 2010 (mod)
Il modello prestativo in età evolutiva, E. Rampinini
Lo stato di maturazione: età cronologica vs età biologica
Il modello prestativo in età evolutiva, E. Rampinini
Heights and
cent male
average, abo
the general
and young
average, mo
may reflect
mass. The in
is related, in
logical mat
Interrelation
and functio
implication
soccer are o
selection an
chronologic
soccer playe
ier and mo
delayed [15
based on cr
changes in
functional c
limited. Fo
dribbling a
Ad esempio RSA strettamente legata all’età biologica dei ragazzi
Training & Testing
Modelling Developmental Changes in Repeated-Sprint
Ability by Chronological and Skeletal Ages in Young
Soccer Players
Correspondence
Prof. Manuel J Coelho-e-Silva,
PhD
University of Coimbra
Estadio Universitario de
Coimbra
3040-156 Coimbra
Portugal
Tel.: + 351/239/802 770
Fax: + 351/239/802 779
[email protected]
b
J. Valente-dos-Santos1, M. J. Coelho-e-Silva1, R. A. Martins1, A. J. Figueiredo1, E. S. Cyrino2, L. B. Sherar3,
R. Vaeyens4, B. C. H. Huijgen5, M. T. Elferink-Gemser5, R. M. Malina6, 7
Authors
60
A liations
A liation addresses are listed at the end of the article
62
60
58
58
56
Abstract
Key words
youth soccer
longitudinal analysis
skeletal age
multilevel modelling
growth
skeletal maturation
54
52
50
11
12
This study investigated the influence of chronological (CA) and skeletal ages (SA), anthropometry, aerobic endurance and lower limb explosive
strength on developmental changes in repeatedsprint ability (RSA) in soccer players aged 11–17
years. Participants were annually followed over 5
years, resulting in 366 measurements. Multilevel
regression modelling analysed longitudinal data
aligned by CA and SA (Model 1 and 2, respectively). After diagnosing for multicollinearity, it
13 possible
14 to 15
17 2-level hier-10
was
predict16
RSA with
archical
models [Model 1 (CA as Level 2 predicCA (years)
tor): Log-Likelihood = 1 515.29, p < 0.01; Model 2
RSA Real Score
Valente dos Santos et al., 2012
Introduction
Heights and weights of early- and mid-adoles-
(SA as Level 2 predictor): Log-Likelihood = 1 513.89,
p < 0.01]. Estimating sum of sprints for young
soccer players are given by equations: sum of
sprints = 84.47 1.82 × CA + 0.03 × CA2 0.05 × aerobic endurance 0.10 × lower limb explosive strength
0.09 × fat-free mass + 0.13 × fat mass (Model 1);
73.58 0.43 × SA 0.05 × aerobic endurance 0.10 ×
lower limb explosive strength 0.08 × fat-free
mass 0.45 × training experience + 0.13 × fat mass
(Model 2). The models produced performance
curves that may be used to estimate individual
performance across adolescent years. Finally, the
11 of 12
13 was
14confi15
16 on17
validity
each model
rmed based
corresponding measurements
taken on an indeSA (years)
pendent cross-sectional sample.
RSA Predicted Score
ented soccer players aged 12–19 years were
followed annually for 7 years, but interactions
with growth and maturity status were not con-
56
54
RSA Score (s)
RSA Score (s)
Bibliography
DOI http://dx.doi.org/
10.1055/s-0032-1308996
Published online:
April 12, 2012
Int J Sports Med 2012; 33:
773–780 © Georg Thieme
Verlag KG Stuttgart · New York
ISSN 0172-4622
loaded by: Università degli Studi di Milano. Copyrighted material.
62
a
accepted after revision
773
January 16, 2012
Fig. 1
scores
skelet
52
50
18
Il modello prestativo in età evolutiva, E. Rampinini
La Fatica
Il modello prestativo in età evolutiva, E. Rampinini
p-value
0.80
0.02
2
0.30
0.05
0.06
0.09
0.69
0.02
0.
0.
± SD. FB – Full backs, CB – centre backs, MD – midfielders, W-MD – wide midfielders, 2 S – second strikers and S – strikers.
ComeMean
per
gli adulti, nelle partite c’è calo di performance tra
MSS, maximal sprinting speed; ASR, anaerobic speed reserve. : significant di erence vs. CB (P < 0.05), 2 : e ect size
primo e secondo tempo
nd
a
5000
4500
Distance Covered (m)
4000 b,c,d,e
3500
3000
2500
#
d
e
b,e
e
#
e
e
#
e
e
#
c
1000
#
#
#
#
#
#
c,d
#
2000
1500
#
e
e
#
Fig. 1 Lea
ning intens
U17 and U1
on total pla
vs. U14 (P <
U17, e: vs. U
MAS, maxim
anaerobic s
a,b,c,
d,e
cde
cde
U14
U15
a,b,c,
d,e
#
d,e
#
d,e
#
e
#
#
#
U13
U14
U15
U16
U17
U18
500
0
U13
U16
U17
U18
First Half
0–60% MAS
61–80% MAS
Second Half
81–100% MAS
101% MAS–30% ASR
> 31% ASR
Mendez-Villanueva et al., 2013
Il modello prestativo in età evolutiva, E. Rampinini
Physical Fitness and Performance
Effect of Match-Related Fatigue on
Short-Passing Ability in Young Soccer Players
ERMANNO RAMPININI1, FRANCO M. IMPELLIZZERI1,2, CARLO CASTAGNA3, ANDREA AZZALIN1,
DUCCIO FERRARI BRAVO1, and ULRIK WISLKFF4
Human Performance Laboratory, Mapei Sport Research Center. Castellanza, Varese, ITALY; 2Neuromuscular Research
Laboratory, Schulthess Clinic, Zurich, SWITZERLAND; 3School of Sport and Exercise Sciences, Faculty of Medicine and
Surgery, University of Rome Tor Vergata, Rome, ITALY; and 4Department of Circulation and Medical Imaging,
Norwegian University of Science and Technology, Faculty of Medicine, Trondheim, NORWAY
1
ABSTRACT
RAMPININI, E., F. M. IMPELLIZZERI, C. CASTAGNA, A. AZZALIN, D. F. BRAVO, and U. WISLKFF. Effect of Match-Related
Fatigue on Short-Passing Ability in Young Soccer Players. Med. Sci. Sports Exerc., Vol. 40, No. 5, pp. 934–942, 2008. Purpose: To
examine whether the fatigue accumulated during match play or determined by short bouts of high-intensity intermittent activities affect
short-passing ability in junior soccer players. A further aim was to examine the influence of physical fitness as measured using the YoYo Intermittent Recovery Test (YYIRT) on the changes in short-passing ability after a 5-min simulation of high-intensity activities
(HIS). Methods: Sixteen players (mean T SD: age 17.6 T 0.5 yr, height 174 T 7 cm, body mass 68 T 6 kg) participated in the study. A
quasi-experimental control-period design was used for the study. Short-passing ability was measured using the Loughborough Soccer
Passing Test (LSPT). Players completed the LSPT in two sessions during the 1-wk control period, followed by two unofficial matches
during which the LSPT was performed during and after the first and the second halves of the game. Furthermore, the change in LSPT
performance was determined after 5 min of HIS. Results: A decline in LSPT performance was found during and after the game (P G
0.01). The accuracy of the LSPT decreased after the HIS. A significant correlation was found between the YYIRT scores and the
decline in LSPT performance (accuracy, total time, total time with penalties) after HIS (r = j0.51 to j0.65; P G 0.05). Conclusions:
This study showed that the fatigue developed during a match and after relatively short bouts of high-intensity intermittent activities has
a detrimental effect on short-passing ability, and that the fatigue-related decline in technical proficiency for a given intensity is
associated with the fitness level of the players. Key Words: EFFORT, PHYSICAL FITNESS, DETERIORATION, GAME,
TECHNICAL SKILLS
The Loughborough
Soccer
Passing
Test (LSPT)
S
hort-passing ability is considered a relevant skill for
soccer players (4,15,19,23). Sajadi and Rahnama (23)
showed that 61% of 2006 FIFA World Cup goals
were scored by direct shots, of which 47% were via short
passes. This finding confirms previous results from the
analysis of the 1986 FIFA World Cup during which 57% of
goals were scored after passes shorter or equal to 3 m (19).
Indeed, short-passing accuracy as measured using the two
versions of the Loughborough Soccer Passing Test (LSPT)
Rampinini et al., 2008
Address for correspondence: Franco M. Impellizzeri, MSc, Neuromuscular
Research Laboratory, Schulthess Clinic, Lengghalde 2, 8008 Zurich,
is able to discriminate players of different competitive level
(2,3). A recent study (21) has also shown that the players of
the best teams in the Italian Serie A performed more short
passes and had more involvement with the ball during
official matches than the players belonging to the worst
teams, as determined by the final ranking. Furthermore,
these technical skills were the only skills showing a
decrease between the first and second halves probably as
a consequence of physical fatigue.
Several studies have shown a decrement in physical
performance during the match (12,16,20,22). In particular,
some studies have shown that high-intensity running and
sprinting decrease between the first and second
halves
Il modello
(12,16,20) and following 5 min of very-high-intensity
prestativo in età evolutiva, E. Rampinini
Nei giovani, anche le abilità tecniche (e.g. precisione passaggio)
possono deteriorarsi nel corso di una partita
FIGURE 4—Total performance in the Loughborough SoccerFIGURE
Passing 2—Penalties in the Loughborough Soccer Passing Tes
Test (LSPT) during the control period and during the soccer
matchduring the control period and during the soccer match (N
(LSPT)
2
PG
N = 11). Significant main effect for time (P G 0.001; G = 0.46).
11). *Significant
main effect for time (P G 0.001; G2 = 0.53). * P G 0.05
0.05,
significant
difference from the control period; # Psignificant
G 0.05, difference from the control period; # P G 0.05, significan
Rampinini
et al., 2008
ignificant difference from the LSPT completed during the first
half; from the LSPT completed during the first half; ‡ P G 0.05
difference
‡, P G 0.05, significant difference from the LSPT completed at
the
end difference from the LSPT completed at the end of the firs
significant
of the first half.
Il modello prestativo in età evolutiva, E. Rampinini
half.
Il Livello Competitivo
Il modello prestativo in età evolutiva, E. Rampinini
I giovani di diverso livello competitivo sostengono un’intensità di
esercizio diversa nel corso delle partite
Physiological Profile and Activity Pattern of
Young Soccer Players during Match Play
JESPER STRØYER1, LONE HANSEN2, and KLAUS KLAUSEN3
1
Department of Work Physiology, National Institute of Occupational Health Denmark, Copenhagen, DENMARK; and
Institute of Medical Anatomy and 3Institute of Sports Science, University of Copenhagen, Copenhagen, DENMARK
2
ABSTRACT
STRØYER, J., L. HANSEN, and K. KLAUSEN. Physiological Profile and Activity Pattern of Young Soccer Players during Match
1. 168
Anthropometric
data, The
maturity
and physiological
Play. Med. Sci. Sports Exerc., Vol. 36,TABLE
No. 1, pp.
–174, 2004. Purpose:
purposestatus,
of this study
was to examine parameters.
aerobic demands
and activity patterns during match play in young soccer players with respect to competition level, age, and biological maturity.
NbP
Methods: Ten nonelite players (NbP) and nine elite players (EbP) in their early puberty (12 yr), and seven elite players (EeP) in their
Age
(yr) pattern were recorded during match play, whereas corresponding V˙O12.1
$ 0.7
late puberty (14 yr) were studied. Heart rate (HR) and
activity
2
mass
(kg) tests in the laboratory. The maturity status was assessed from
40.6 $ 6.6
and HR values were obtained during submaximal andBody
maximal
treadmill
˙ O2max was
testicular volume. Results: No difference in V
observed
Height
(cm)between the nonelite and the elite players in the beginning of puberty
153.1 $ 5.1
(58.7 ! 5.3 vs 58.6 ! 5.0 mL O2·min"1·kg"1), whereas
elite "2
players
BMIthe(kg!m
17.2 $ 2.2
) in the end of puberty were significantly more fit (63.7 ! 8.5
"1
"1
mL O2·min ·kg ). During match play, a higher HRTesticle
was recorded
in the
elite players in the beginning of puberty than their nonelite5.3 $ 2.9
volume
(mL)
"1 1st half/2nd half—NbP: 162/157; EbP: 177/174; EeP:
counterparts, whereas the two elite groups showed theV˙O
same HR
responses (HR
2352 $ 261
)
2max (mL O2!min
˙ O2 (V
˙ O2·min"1 and mL
"1
"1
178/173). The elite players in the end of pubertyV˙O
thus performed
a higher
and relative V
58.7 $ 5.3
(mL O2!min
!kgabsolute
)
2max
"1
"1
"1
O2·min ·kg ) compared with the nonelite players during
both halves,
to more time spent in standing/walking in the
BMR (mL
O2!mincorresponding
201 $ 16
)
˙ 2 values
"1
"1
nonelite group. The elite players in the end of puberty
showedeconomy
higher absolute
Running
(mL V
OO
233 $ 24
!kmduring
) match play than the young elite
2!kg
˙ O2max and was performing
players but identical relative aerobic loads. It seems that the midfield/attack group had the highest absolute V
HRmax (bpm)
198.0 $ 5.7
at the highest HR during the matches. Conclusion: The present study shows that young soccer players are highly specialized both
HRrest (bpm)
65.5 $ 5.1
according to playing level and position on the field. Key
Words: PUBERTY, OXYGEN UPTAKE, TIME-MOTION ANALYSIS,
Values
are means $ SD. NbP (nonelite players at the beginning of puberty), EbP (elite players
TESTICLE VOLUME, MALE, HEART
RATE
EbP
12.6 $ 0.6
42.5 $ 7.2
154.1 $ 8.2
17.8 $ 2.0
6.7 $ 2.6
2466 $ 281
58.6 $ 5.0
206 $ 18
205 $ 31
202.1 $ 3.8
66.8 $ 6.0
at the beginning of puberty), EeP (elite
# Denotes significant difference (P %0.05) between EeP and EbP.
BMI, body mass index; V˙O2max, maximal oxygen uptake; BMR, basal meta-bolic rate. BMR is subtracted from the submaximal
everal professional soccer schoolseconomy.
for talented young
players, surprisingly few studies have been published replayers have in recent years been established in Eugarding the physiological demand and the activity pattern of
rope. More attention is being paid to the development
young soccer players (6,8,13). Moreover, these studies fail
of young talented players in the soccer clubs, and the physto couple the observed activity pattern and the aerobic load
exhaustion were present. The
beginning
of puberty,
!play.
end
ofet puberty).
Alltheteams
ical training and the tactical organization
in the field seems
duringeP
match
Klimt
al. (14) measured
HR during
to˙ be implemented
much
earlier.
Methods
for
analysis
durcompetition
and
noncompetition
games
in
11to
12-yr-old
submaximal
employed
a
regular
4-4-2
formation,
using
four
defenders,
FIGURE
4
—HR
during
the
first
and
second
halves.
Values are running
means velociti
˙ O2 match " BMR)/
GURE 3—Relative aerobic load (%V
O2 !play
(V
ing match
have been developed and
include
heart
rate
boys
but
did
not
relate
these
measurements
to
the
level
and
y-bars
illustrate
SD.
Group
codes
are
as
in
Figure
1.
*Denotes
gen uptake per body mass pe
midfielders, and two attackers. Twelve of the subjects
O2max " BMR)) during the first and
second halves.
Values four
are
(HR) measurements,
and observational
studies of motion
of competition.
significant
differences
(P
<
0.05)
between
groups.
#Denotes
bolic ratesignificant
(BMR). The BMR
were
defenders,
13
played
midfield,
and
3
were
attackers.
analysis
and
running
pattern
(3,9,23).
Activity
registration
The
purpose
of
the
present
study
was
to
record
the
aerobic
eans and y-bars illustrate SD. Group codes are as in Figure 1.
differences
between
halves.
has
become
easier
and
inexpensive
by
the
use
of
small
energy
demand
during
match
play
and
relate
it
to
maturity
mula
of
Schofield
(22): [0.0
Because
the
attackers
often
played
in
the
midfield,
the
enotes significant differences (P < 0.05) between groups. #Denotes
microcomputers in field studies (19). The activity patterns
status and competition level (elite vs nonelite) of young
2.157]MJ based on measure
midfielders
and attackers
were treated as one group. The
nificant differences (P < 0.05) between
halves. demands have therefore
and physiological
been well-resoccer players. Furthermore, the activity pattern and the
boys (mean 13.7 yr). Only the
elitetoplayers
were defined
asspecialization
subjects playing
on the
clubs
ported in adult soccer players with regard
competition
influence of
due to playing
position
on the
S
Stroyer et al., 2004
Il modello prestativo in età evolutiva, E. Rampinini
HIM m min '
14.5 ±2.3
11.5 ±3.7*
0.032
VHIM m min '
±0.7
3.2 ± 1.4 avere una
0.068
I giovani calciatori di diverso livello3.4competitivo
sembrano
Sprints min' fisica e un’intensità di esercizio
0.4 ± 0.2differente 0.4
0.2 delle0.254
performance
nel±corso
partite
Mean sprint distance (m)
Pédiatrie Exercise Science, 2013, 25, 423-434
© 2013 Human Kinetics, Inc.
8.7 ± 4.3
6.5 ± 1.7
0.115
Peak sprint
distancePerformance
(m)
31.4 ±9.7
27.1
±7.3 Abilities
0.129
Table
1 Match
Characteristics
and
Physical
A Comparison of Physical Abilities and
ofPeak
thespeed
Elite(km
andh')Subelite
Under-14Characteristics
Soccer
(Mean
Match Performance
Among
26.8
± 4.3 Players
25.8
± 2.2 ± SD) 0.260
Elite and Subelite Under-14 Soccer Players
Successful
ball retention
min' Mark Waldron
0.41
Elite
(n±0.11
= 15) and
0.18
± (n
0.02*
0.000
Subelite
= 16)Abilities
Sig.
Table
1 Match
Performance
Characteristics
Physical
and Aron Murphy
University of New England
ofTotal
themElite
Subelite
Under-14
Soccer
(Mean
Unsuccessful
ball retention
min'
0.14
±0.04
min' and
0.06
±±7.7*
0.02*± SD) 0.001
115.7
±6.6 Players
0.000
105.4
Successful
LIM
m min"'passes min'
This study aimed to identify characteristics of match performance and physical
ability that discriminate between elite and subelite under-14 soccer players. Players
were assessed for closed performance and movement, physiological responses, and
technical actions during matches. Elite players covered more total m min' (115.7
±6.6cf. 105.4±7.7m min') and high-intensity m min' (elite= 14.5±2.3c/. 11.5
± 3.7 m min') compared with subelite players. Elite players also attempted more
successful (0.41 ±0.11 ef. 0.18 ±0.02) and unsuccessful ball retentions min ' (0.14
± 0.04 cf. 0.06 ± 0.02) compared with subelite players. Elite players were faster
over 10 m (1.9 ± 0.1 c/. 2.3 ± 0.2 s) and faster dribblers (16.4 ± 1.4 c/. 18.2 ± 1.1
s) compared with subelite players. Speed (10m) and successful ball retention min '
contributed to a predictive model, explaining 96.8% of the between-group variance.
The analysis of match performance provides a more thorough understanding of
the factors underlying talent among youth soccer players.
0.47
46.5(n±0.19
± =4.5
Elite
15)
0.21
42.4 ±0.08*
±(n
3.8*
Subelite
= 16)
0.000
0.039
Sig.
Unsuccessful
MIM
Total
m min' passes min'
0.18
0.06
51.2 ±±3.0
115.7
±6.6
0.07
0.03*
48.3±±7.7*
±7.1
105.4
0.000
0.272
0.001
Successful
tackling
min'
HIM
m min
'
LIM
min"'
0.39
14.5 ±0.13
±2.3
46.5
±
4.5
0.18
11.5 ±0.07*
±3.7*
42.4
± 3.8*
0.001
0.032
0.039
0.14
±0.06
3.4 ±0.7
51.2
±3.0
0.06
0.02*
3.2 ±±±7.1
1.4
48.3
0.000
0.272
0.068
Unsuccessful
VHIM
min 'tackling min'
MIM
mmmin'
%HRpeak
Sprints
HIM
m min'
min '
The identification of young talented soccer players is traditionally a subjective
process, whereby scouts and sports coaches are responsible for recognizing players
with the capacity to perform at the elite level (19,25). However, talent identification
in soccer is complicated by the growing number of participants and the vague concept of "talent" in team sports (13). More recently, the merits of integrating physical
testing procedures into the talent identification process have been recognized. For
example, it has been shown that under-14 Flemish youth players contracted to first
or second division teams (elite), are faster over 30 m and perform better in dribbling
and ball juggling skill tests than players competing at a regional level (nonelite;
24). However, compared with players of a higher standard (third and fourth division; subelite), there were no differences in speed, skill, agility or endurance until
the under-16 age group (24). These results are consistent with research in French
soccer, where a retrospective comparison between players reaching the international,
professional, or amateur standard found no differences in physical performance in
86.7
2.4
0.4 ±±
0.2
14.5
±2.3
83.8
±3.5
0.4 ±
0.2
11.5
±3.7*
0.051
0.254
0.032
RPE(O-IO)
Mean
sprint
(m)
VHIM
m mindistance
'
4.9 ±±0.7
±2.1
8.7
4.3
3.4
4.97
1.0
6.5
3.2 ±± 1.7
1.4
0.504
0.115
0.068
lO-msprint
sprint
time (s) (m)
Peak
Sprints
min'distance
1.9 ±±0.1
31.4
±9.7
0.4
0.2
HIM, > 13 km/h
2.3
0.2*
27.1
0.000
0.4 ±±±7.3
0.2
0.129
0.254
30-mspeed
timeh')
(s) (m)
Peak
Mean
sprint(km
distance
età evolutiva, 0.260
E. Rampinini
4.3 ±±0.1
5.1
26.8
± 4.3
4.3 Il modello prestativo
0.000
8.7
25.8
2.2
6.5 ±0.2*
±± in1.7
0.115
Peak speed (km h')
26.8 ± 4.3
25.8 ± 2.2
0.260
Successful ball retention min'
0.41 ±0.11
0.18 ± 0.02*
0.000
Successful passes min'
0.47 ±0.19
0.21 ±0.08*
0.000
0.18 ± 0.06
0.07 ± 0.03*
0.000
I giovani calciatori di diverso livello competitivo sembrano avere una
Unsuccessful ball retention min'
0.14 ±0.04
0.06 ± 0.02*
performance fisica e un’intensità di esercizio
differente
nel corso delle0.000
partite
Pédiatrie Exercise Science, 2013, 25, 423-434
© 2013 Human Kinetics, Inc.
Unsuccessful passes min'
A Comparison of Physical Abilities and
Successful tackling min'Match Performance 0.39
±0.13 Among
0.18 ±0.07*
Characteristics
0.001
Elite and Subelite Under-14 Soccer Players
Table
1 Match
Performance
Characteristics
and
Physical
Unsuccessful
tackling
min'
0.14 ±0.06
0.06
± 0.02* Abilities
0.000
Mark Waldron and Aron Murphy
of%HRpeak
the Elite and Subelite Under-14
Soccer Players (Mean ± SD)
University of New England
86.7 ± 2.4
83.8 ±3.5
0.051
Elite
= 15)
4.9(n
±2.1
Subelite
= 16)
4.97 ±(n1.0
Sig.
0.504
115.7
±6.6
1.9 ±0.1
46.5
± 4.5
4.3 ±0.1
105.4
2.3 ±±7.7*
0.2*
42.4
± 3.8*
5.1 ±0.2*
0.001
0.000
51.2
41.1 ±3.0
±4.4
48.3
±7.1
40.7 ±
4.3
This study aimed to identify characteristics of match performance and physical
ability that discriminate between elite and subelite under-14 soccer players. Players
were assessed for closed performance and movement, physiological responses, and
technical actions during matches. Elite players covered more total m min' (115.7
±6.6cf. 105.4±7.7m min') and high-intensity m min' (elite= 14.5±2.3c/. 11.5
± 3.7 m min') compared with subelite players. Elite players also attempted more
successful (0.41 ±0.11 ef. 0.18 ±0.02) and unsuccessful ball retentions min ' (0.14
± 0.04 cf. 0.06 ± 0.02) compared with subelite players. Elite players were faster
over 10 m (1.9 ± 0.1 c/. 2.3 ± 0.2 s) and faster dribblers (16.4 ± 1.4 c/. 18.2 ± 1.1
s) compared with subelite players. Speed (10m) and successful ball retention min '
contributed to a predictive model, explaining 96.8% of the between-group variance.
The analysis of match performance provides a more thorough understanding of
the factors underlying talent among youth soccer players.
RPE(O-IO)
Total
min'time (s)
lO-m m
sprint
LIM
min"'time (s)
30-m msprint
MIM jump
m min'
CMJ
height (cm)
0.039
0.000
0.272
0.393
The identification of young talented soccer players is traditionally a subjective
HIM
m min
'
14.5 ±2.3
11.5 ±3.7*
Predicted
vertical
powerprocess,
(W)
whereby scouts and sports2816.2±4I4.7
coaches are responsible for recognizing
players
2759.5
± 382.5*
0.032
0.000
VHIM
min ' (s)
Slalom m
dribble
Sprintspassing
min' test (n)
Cone
0.068
0.039
0.254
0.378
with the capacity to perform at the elite level (19,25). However, talent identification
in soccer is complicated by the growing number of participants and the vague concept of "talent" in team sports (13). More recently, the merits of integrating physical
testing procedures into the talent identification process have been recognized. For
example, it has been shown that under-14 Flemish youth players contracted to first
or second division teams (elite), are faster over 30 m and perform better in dribbling
and ball juggling skill tests than players competing at a regional level (nonelite;
24). However, compared with players of a higher standard (third and fourth division; subelite), there were no differences in speed, skill, agility or endurance until
the under-16 age group (24). These results are consistent with research in French
soccer, where a retrospective comparison between players reaching the international,
professional, or amateur standard found no differences in physical performance in
3.4 ±0.7
16.4
± 1.4
Ma anche abilità
atletiche
0.4 ± 0.2
Mean
distance
(m)
Slalomsprint
agility
(s)
Peak sprint distance (m)
4.7 ± 1.3
8.7 ±±0.5
4.3
10.3
3.2 ± 1.1*
1.4
I8.2±
diverse
0.4
4.2 ±
± 0.2
1.5
6.5 ±
1.7
0.115
11.6
±
1.4*
0.043
Il modello prestativo in età evolutiva, E. Rampinini
CONCLUSIONI
✓ La performance fisica nelle partite aumenta con l’età in maniera
simile a quanto succede alle abilità atletiche
✓ Non sempre esistono delle strette correlazioni tra livelli atletici
(risultati test) e performance fisica nelle partite (ruoli)
✓ Il livello di maturazione biologica influenza pesantemente la
capacità atletica dei ragazzi (test) e la prestazione fisica in partita
✓ Come per gli adulti, la fatica che si genera nel corso delle partite
sembra influenzare negativamente la prestazione fisica e l’abilità
tecnica dei giovani calciatori
✓ I giovani calciatori di più alto livello competitivo nel corso delle
partite mostrano un’intensità di esercizio maggiore e una
performance atletica maggiore (grazie anche alla maggior
maturazione biologica)
Il modello prestativo in età evolutiva, E. Rampinini
Grazie per l’attenzione…
Domande…
Il modello prestativo in età evolutiva, E. Rampinini
Il modello prestativo in età evolutiva, E. Rampinini
© Copyright 2026 Paperzz