Physics Letters B 732 (2014) 65–74
Contents lists available at ScienceDirect
Physics Letters B
www.elsevier.com/locate/physletb
Study of the K ± → π ± γ γ decay by the NA62 experiment
The NA62 Collaboration
C. Lazzeroni 2 , A. Romano
University of Birmingham, Edgbaston, Birmingham B15 2TT, United Kingdom
A. Ceccucci, H. Danielsson, V. Falaleev, L. Gatignon, S. Goy Lopez 3 , B. Hallgren 4 , A. Maier,
A. Peters, M. Piccini 5 , P. Riedler
CERN, CH-1211 Genève 23, Switzerland
P.L. Frabetti, E. Gersabeck 6 , V. Kekelidze, D. Madigozhin, M. Misheva, N. Molokanova,
S. Movchan, Yu. Potrebenikov, S. Shkarovskiy, A. Zinchenko
Joint Institute for Nuclear Research, 141980 Dubna (MO), Russia
P. Rubin 7
George Mason University, Fairfax, VA 22030, USA
W. Baldini, A. Cotta Ramusino, P. Dalpiaz, M. Fiorini, A. Gianoli, A. Norton, F. Petrucci,
M. Savrié, H. Wahl
Dipartimento di Fisica e Scienze della Terra dell’Università e Sezione dell’INFN di Ferrara, I-44122 Ferrara, Italy
A. Bizzeti 8 , F. Bucci 9 , E. Iacopini 9 , M. Lenti, M. Veltri 10
Sezione dell’INFN di Firenze, I-50019 Sesto Fiorentino, Italy
A. Antonelli, M. Moulson, M. Raggi, T. Spadaro
Laboratori Nazionali di Frascati, I-00044 Frascati, Italy
K. Eppard, M. Hita-Hochgesand, K. Kleinknecht, B. Renk, R. Wanke, A. Winhart 4
Institut für Physik, Universität Mainz, D-55099 Mainz, Germany 11
R. Winston
University of California, Merced, CA 95344, USA
V. Bolotov 1 , V. Duk 5 , E. Gushchin
Institute for Nuclear Research, 117312 Moscow, Russia
F. Ambrosino, D. Di Filippo, P. Massarotti, M. Napolitano, V. Palladino 12 , G. Saracino
Dipartimento di Fisica dell’Università e Sezione dell’INFN di Napoli, I-80126 Napoli, Italy
http://dx.doi.org/10.1016/j.physletb.2014.03.016
0370-2693/© 2014 The Authors. Published by Elsevier B.V. This is an open access article under the CC BY license (http://creativecommons.org/licenses/by/3.0/). Funded by
SCOAP3 .
66
The NA62 Collaboration / Physics Letters B 732 (2014) 65–74
G. Anzivino, E. Imbergamo, R. Piandani 13 , A. Sergi 4
Dipartimento di Fisica dell’Università e Sezione dell’INFN di Perugia, I-06100 Perugia, Italy
P. Cenci, M. Pepe
Sezione dell’INFN di Perugia, I-06100 Perugia, Italy
F. Costantini, N. Doble, S. Giudici, G. Pierazzini 1 , M. Sozzi, S. Venditti 12
Dipartimento di Fisica dell’Università e Sezione dell’INFN di Pisa, I-56100 Pisa, Italy
S. Balev 1 , G. Collazuol 14 , L. DiLella, S. Gallorini 14 , E. Goudzovski ∗,2,4 , G. Lamanna,
I. Mannelli, G. Ruggiero 12
Scuola Normale Superiore e Sezione dell’INFN di Pisa, I-56100 Pisa, Italy
C. Cerri, R. Fantechi
Sezione dell’INFN di Pisa, I-56100 Pisa, Italy
S. Kholodenko, V. Kurshetsov, V. Obraztsov, V. Semenov, O. Yushchenko
Institute for High Energy Physics, 142281 Protvino (MO), Russia 15
G. D’Agostini
Dipartimento di Fisica, Sapienza Università di Roma and Sezione dell’INFN di Roma I, I-00185 Roma, Italy
E. Leonardi, M. Serra, P. Valente
Sezione dell’INFN di Roma I, I-00185 Roma, Italy
A. Fucci, A. Salamon
Sezione dell’INFN di Roma Tor Vergata, I-00133 Roma, Italy
B. Bloch-Devaux 16 , B. Peyaud
DSM/IRFU – CEA Saclay, F-91191 Gif-sur-Yvette, France
J. Engelfried
Instituto de Física, Universidad Autónoma de San Luis Potosí, 78240 San Luis Potosí, Mexico 17
D. Coward
SLAC National Accelerator Laboratory, Stanford University, Menlo Park, CA 94025, USA
V. Kozhuharov 18 , L. Litov
Faculty of Physics, University of Sofia, 1164 Sofia, Bulgaria 19
R. Arcidiacono 20 , S. Bifani 4
Dipartimento di Fisica dell’Università e Sezione dell’INFN di Torino, I-10125 Torino, Italy
C. Biino, G. Dellacasa, F. Marchetto
Sezione dell’INFN di Torino, I-10125 Torino, Italy
T. Numao, F. Retière
TRIUMF, 4004 Wesbrook Mall, Vancouver, British Columbia, V6T 2A3, Canada
The NA62 Collaboration / Physics Letters B 732 (2014) 65–74
a r t i c l e
i n f o
a b s t r a c t
A study of the dynamics of the rare decay K ± → π ± γ γ has been performed on a sample of 232 decay
candidates, with an estimated background of 17.4 ± 1.1 events, collected by the NA62 experiment at
CERN in 2007. The results are combined with those from a measurement conducted by the NA48/2
Collaboration at CERN. The combined model-independent branching ratio in the kinematic range z =
(mγ γ /m K )2 > 0.2 is BMI (z > 0.2) = (0.965 ± 0.063) × 10−6 , and the combined branching ratio in the full
kinematic range assuming a Chiral Perturbation Theory description is B ( K π γ γ ) = (1.003 ± 0.056) × 10−6 .
A detailed comparison of the results with the previous measurements is performed.
© 2014 The Authors. Published by Elsevier B.V. This is an open access article under the CC BY license
(http://creativecommons.org/licenses/by/3.0/). Funded by SCOAP3 .
Article history:
Received 19 February 2014
Received in revised form 10 March 2014
Accepted 11 March 2014
Available online 17 March 2014
Editor: W.-D. Schlatter
0. Introduction
Experimental studies of radiative non-leptonic kaon decays allow crucial tests of Chiral Perturbation Theory (ChPT) describing
weak low energy processes: the first non-trivial contribution to
their decay rates stems from next-to-leading order ChPT. For the
rare decay K ± → π ± γ γ (K π γ γ ), considerable phenomenological understanding [1–4] is not matched by sufficient experimental
data.
The K π γ γ decay can be described by two kinematic variables:
z=
(q1 + q2 )2
m2K
=
mγ γ
mK
2
,
y=
p (q1 − q2 )
m2K
,
where p and q1,2 are the 4-momenta of the kaon and the two photons respectively, mγ γ is the di-photon invariant mass, and m K is
the charged kaon mass. The allowed region of the kinematic variables is [3]
0 z zmax = (1 − rπ )2 = 0.515,
1
0 y y max ( z) =
λ 1, rπ2 , z ,
2
*
67
Corresponding author.
E-mail address: [email protected] (E. Goudzovski).
1
Deceased.
2
Supported by a Royal Society University Research Fellowship, grant numbers
are: UF031023, UF100308 and UF0758946.
3
Present address: CIEMAT, E-28040 Madrid, Spain.
4
Present address: School of Physics and Astronomy, University of Birmingham,
Birmingham, B15 2TT, UK.
5
Present address: Sezione dell’INFN di Perugia, I-06100 Perugia, Italy.
6
Present address: Ruprecht-Karls-Universität Heidelberg, D-69120 Heidelberg,
Germany.
7
Funded by the National Science Foundation under award No. 0338597.
8
Also at Dipartimento di Fisica, Università di Modena e Reggio Emilia, I-41125
Modena, Italy.
9
Also at Dipartimento di Fisica, Università di Firenze, I-50019 Sesto Fiorentino,
Italy.
10
Also at Istituto di Fisica, Università di Urbino, I-61029 Urbino, Italy
11
Funded by the German Federal Minister for Education and Research (BMBF) under contract 05HA6UMA.
12
Present address: CERN, CH-1211 Genève 23, Switzerland.
13
Present address: Sezione dell’INFN di Pisa, I-56100 Pisa, Italy.
14
Present address: Dipartimento di Fisica dell’Università e Sezione dell’INFN di
Padova, I-35131 Padova, Italy.
15
Partly funded by the Russian Foundation for Basic Research grant 12-02-91513.
16
Present address: Dipartimento di Fisica dell’Università di Torino, I-10125 Torino,
Italy.
17
Funded by Consejo Nacional de Ciencia y Tecnología (CONACyT) (grant number
54988) and Fondo de Apoyo a la Investigación (UASLP) (grant number 54988).
18
Present address: Laboratori Nazionali di Frascati, I-00044 Frascati, Italy.
19
Funded by the Bulgarian National Science Fund under contract DID02-22.
20
Present address: Università degli Studi del Piemonte Orientale, I-13100 Vercelli,
Italy.
where rπ = mπ /m K , mπ is the charged pion mass and λ(a, b, c ) =
a2 + b2 + c 2 − 2(ab + ac + bc ).
The K π γ γ decay was first observed by the BNL E787 experiment in 1997 [5]: 31 K + decay candidates were reported in the
kinematic region 100 MeV/c < p ∗π < 180 MeV/c or 0.157 < z <
0.384 (p ∗π is the π + momentum in the K + rest frame). An analysis
of 149 K π±γ γ decay candidates in the kinematic region z > 0.2 was
published by the NA48/2 Collaboration at CERN in 2014 [6]. A related decay mode K ± → π ± γ e + e − (K π γ ee ) has been measured
from 120 candidates in the kinematic region mγ ee > 260 MeV/c 2
or z = (mγ ee /m K )2 > 0.277 at the NA48/2 experiment [7].
A measurement of the K π±γ γ decay based on a minimum bias
data sample collected by the NA62 experiment in 2007 is reported
here. The results are combined with those from the NA48/2 measurement [6] and compared to the earlier measurements [5,7].
1. Beam and detector
The beam line and setup of the earlier NA48/2 experiment [8]
were used for the NA62 data taking in 2007. However, the beam
line parameters and transverse momentum kick provided by the
spectrometer magnet were significantly different. Secondary beams
of positive and negative hadrons with a central momentum of
74 GeV/c and a momentum spread of 1.4 GeV/c (rms) were derived from the primary 400 GeV/c protons extracted from the
CERN SPS and interacting with a beryllium target. These beams
were dominated by π ± ; the K ± component was about 6%. They
were delivered, either alternately or simultaneously, into a 114 m
long cylindrical vacuum tank containing the fiducial decay region
at angles of ±0.23 mrad with respect to the detector axis, so as to
compensate for the opposite ∓3.58 mrad deflections by the downstream spectrometer magnet. These deflections were regularly reversed during data taking. The fraction of beam kaons decaying in
the vacuum tank was 18%.
The momenta of charged decay products of K ± were measured
by a magnetic spectrometer, housed in a tank filled with helium at
nearly atmospheric pressure, located downstream of the decay vacuum tank and separated from it by a thin (0.3% X 0 ) Kevlar® composite window. An aluminium beam pipe of 158 mm outer diameter and 1.1 mm thickness traversing the centre of the spectrometer
(and all the following detectors) allowed the undecayed beam particles and the muon halo from beam pion decays to continue their
path in vacuum. The spectrometer consisted of four drift chambers
(DCHs) with a radial extension of 1.35 m, and a dipole magnet
located between the second and the third DCH, which provided
a horizontal momentum kick of 265 MeV/c. The nominal spectrometer momentum resolution was σ p / p = (0.48 ⊕ 0.009 · p )%,
where the momentum p is expressed in GeV/c. A hodoscope
(HOD) consisting of two planes of 64 plastic scintillator strips,
with each plane arranged in four quadrants, was placed downstream of the spectrometer. The HOD provided trigger signals and
68
The NA62 Collaboration / Physics Letters B 732 (2014) 65–74
time measurements of charged particles with a resolution of about
150 ps. Following the hodoscope was a quasi-homogeneous liquid
krypton electromagnetic calorimeter (LKr) with an active volume
of 7 m3 , 27 X 0 deep, segmented transversally into 13 248 projective
∼2 × 2 cm2 cells (with no longitudinal
segmentation). The LKr en√
ergy resolution was σ E / E = (3.2/ E ⊕ 9/ E ⊕ 0.42)%, and its spatial
resolution for the transverse coordinates √
x, y of an isolated electromagnetic shower was σx = σ y = (4.2/ E ⊕ 0.6) mm, where E
is expressed in GeV. A plane of scintillating fibres located in the
LKr calorimeter volume at a depth of about 9.5 X 0 , close to the
maxima of showers initiated by 10 GeV photons, formed the “neutral hodoscope” (NHOD) which also provided trigger signals. The
LKr was followed by a hadronic calorimeter and a muon detector,
neither being used in the present analysis. A detailed description
of the detector can be found in Ref. [9].
2. Data sample and trigger
The data were obtained from about 3.5 × 10⁵ SPS spills
recorded during 4 months of operation in 2007 with low intensity beams at an instantaneous kaon decay rate in the vacuum
tank of ∼105 Hz. The total number of K ± decays in the vacuum
tank was ∼2 × 10¹⁰ . About 27% of them were collected with simultaneous K + and K − beams, with a K + / K − flux ratio of 2.0
and an angle of ∼0.5 mrad between the K + and K − beam directions. The remaining 65% (8%) of the sample correspond to K +
(K − ) decays collected in single-beam mode. About half of the data
sample was recorded with a 9.2 X 0 thick lead (Pb) bar installed between the two HOD planes and shadowing about 10% of the LKr
area. This latter setup was used for another study, as described in
Ref. [10].
The main data set was recorded with a trigger requiring the
presence of an electron [10], which has marginal efficiency for
K π γ γ decays. Therefore a sample collected using downscaled minimum bias trigger branches requiring at least one charged particle
and/or a minimum calorimetric energy deposit is used for this
measurement. At least one of the following trigger conditions was
required:
• a time coincidence of signals in the two HOD planes within
the same quadrant combined with loose lower and upper limits on DCH hit multiplicity, signaling a charged particle traversing the spectrometer (∼20% of the data sample);
• the above condition in coincidence with an LKr energy deposit
of at least 10 GeV, signaling e nergy release from charged pions, electrons, or photons (∼60% of the data sample);
• a signal from the NHOD detector, similarly signaling electromagnetic shower energy release (∼20% of the data sample).
The resulting data sample used for this measurement corresponds
to about 6% of the total beam flux.
3. Data analysis
3.1. Measurement method
The K π γ γ decay rate is measured with respect to the normalization decay chain collected simultaneously with the same trigger logic: K ± → π ± π 0 decay (K 2π ) followed by π 0 → γ γ decay
(πγ0 γ ). As a consequence, the measurement does not depend on
the beam flux and composition, nor the downscaling factors of
the individual trigger branches and their variations throughout the
data taking, provided that the time variations of the geometrical
acceptances are taken into account. The similarity of the signal and
normalization decay final states leads to first order cancellation of
several systematic effects.
The branching ratio of K π γ γ decay can be computed as
B( K π γ γ ) =
Nπ
γγ
N
2π
·
A 2π
Aπ γ γ
·
ε2π
· B( K 2π )B πγ0 γ ,
επ γ γ
where N π
γ γ and N 2π are numbers of reconstructed signal and
normalization events (after background subtraction), A π γ γ and
A 2π are the acceptances of the signal and normalization selections, and επ γ γ and ε2π are the corresponding trigger efficiencies. The normalization mode branching ratio B ( K 2π )B (πγ0 γ ) =
0.204 ± 0.001 is large and known to a good precision [11].
The acceptances for the signal, normalization and background
decays are evaluated with a detailed GEANT3-based [12] Monte
Carlo (MC) simulation. The signal acceptance A π γ γ is not uniform
over the kinematical space, and therefore depends in general on
the assumed kinematic distribution. Acceptances varied over time
due to the presence of the Pb bar during part of data taking (see
Section 2), groups of LKr cells temporarily masked for hardware
reasons, as well as small variations of the beam positions, directions and momenta.
Trigger efficiencies have been measured with control data samples. Due to the minimum bias trigger conditions applied and
the identity of the signal and normalization final state topologies,
these efficiencies have high and similar values for the signal, normalization and background decay modes. Therefore they cancel to
first order, as quantified in Section 3.6.
3.2. Event reconstruction and selection
The event reconstruction is similar to that reported in Ref. [6].
However it is modified when needed to match the different beam
and detector properties. Most of the selection criteria are common
to the signal and normalization decay modes, due to their similar
topologies.
• A π ± candidate track geometrically consistent with originating
from a beam K ± decay is required. The decay vertex, reconstructed as the point of closest approach of the track and the
axis of the kaon beam of the corresponding charge, should be
located within a 98 m long fiducial volume contained in the
vacuum tank.
• Track impact points in the DCH, HOD and LKr calorimeter
should be within their fiducial acceptances. The LKr acceptance definition includes separation by at least 6 cm from
the detector edges and groups of non-instrumented or temporarily disabled cells, to reduce lateral energy leakage effects.
For the data sample collected with the Pb bar installed, LKr
calorimeter cells shadowed by the bar (rows 6 to 16 below
the centre line) are excluded from the track geometrical acceptance, as the pions (π ± ) traversing the bar cannot be efficiently separated from electrons (e ± ) by energy deposition in
the calorimeter.
• The reconstructed track momentum is required to be between
8 and 50 GeV/c, which does not decrease the K π γ γ acceptance
while inducing a relative loss of 5% on the K 2π acceptance.
The upper momentum cut is equivalent to a lower limit on
the total energy of the two photons and ensures the high efficiency of the LKr and NHOD trigger conditions; the lower
momentum cut decreases the background in the K π γ γ sample.
• The π ± is identified by the ratio of energy release in the
LKr calorimeter to momentum measured by the spectrometer: E / p < 0.85. This decreases the electron contamination
The NA62 Collaboration / Physics Letters B 732 (2014) 65–74
69
Fig. 1. (Colour online.) Reconstructed invariant mass distributions of (a) π ± γ γ and (b) π ± π 0 candidates compared with the sums of estimated signal and background
components. The estimated K π γ γ signal corresponds to the result of a ChPT O ( p 6 ) fit. Signal region limits are indicated with vertical arrows. The K ± → π ± π 0 γ background
contributes below, within and above the signal mass region through different mechanisms: photons missing the geometric acceptance (below), merging of photon LKr clusters
(within), both combined with photon conversions in the spectrometer (above). Systematic errors on the background distributions are not indicated. The relative uncertainty
on the background estimate in the K π γ γ sample is about 10%, as discussed in Section 3.6.
•
•
•
•
in the pion sample by at least a factor of 200, as measured
with a sample of K ± → π 0 e ± ν decays, and reduces the backgrounds from K ± decays to electrons to a negligible level.
The π ± identification efficiency averaged over momentum is
98.4%. The corresponding systematic effects are discussed in
Section 3.6.
Clusters of energy deposition in the LKr calorimeter in time
with the track, separated by at least 25 cm from the track
impact point and not located in the shadow of the Pb bar
are considered as photon candidates. Exactly two photon candidates are required. They should be within the LKr fiducial
acceptance, which is defined in the same way as for the π ±
candidate, except for larger separation (8 cm) from detector
edges and groups of non-instrumented or temporarily disabled cells. The distance between the two candidates should
be larger than 20 cm, and their energies should be above
3 GeV. These two requirements do not reduce the K π γ γ acceptance (due to the mγ γ cut discussed below) and lead to a
relative loss of 4% on the K 2π acceptance.
The backgrounds result mainly from LKr cluster merging, as
discussed in Section 3.3, and are characterized by larger mean
lateral width of the photon candidate LKr clusters. An energydependent upper limit is imposed on that variable, based on
measurements of width distributions of isolated electromagnetic clusters separately for data and MC simulated events.
This reduces background in the K π γ γ sample by about a factor of 2, while the relative acceptance loss is below 1% for both
K π γ γ and K 2π decays.
The reconstructed π ± γ γ momentum is required to be between 70 and 78 GeV/c, and its component orthogonal to the
axis of the kaon beam of the corresponding charge should be
p 2T < 0.5 × 10⁻³ (GeV/c )2 , which is consistent with the beam
momentum spectrum, divergence and resolution. This leads to
1% relative acceptance loss for both K π γ γ and K 2π decays.
The reconstructed π ± γ γ (π ± π 0 ) invariant mass should be
between 480 and 510 MeV/c 2 . The corresponding mass resolutions for the K π γ γ (K 2π ) samples are 5.4 (3.3) MeV/c 2 .
The K π γ γ and K 2π selections differ only in the di-photon invariant
mass requirement.
• For K π γ γ , the signal kinematic region is defined as z > 0.2.
Assuming a O ( p 6 ) ChPT kinematic distribution [3] and using the experimental input [6], the expected relative K π γ γ
acceptance loss is 3%. The low z region is dominated by the
π 0 monochromatic line at z = (mπ 0 /m K )2 = 0.075, which is
widened by the resolution on photon energies (due to LKr energy resolution) and directions (due to LKr and spectrometer
spatial resolution and beam transverse profile). As a result, the
signal is not observable at low z, including the region below
the π 0 peak. This was also the case for the previous K π γ γ
[5,6] and K π γ ee [7] measurements. The resolution on the z
variable increases from δ z = 0.005 at z = 0.2 to δ z = 0.03 at
zmax = 0.515.
• For K 2π , the di-photon is required to be consistent with originating from a π 0 decay: |mγ γ − mπ 0 | < 10 MeV/c 2 (0.064 <
z < 0.086). The mass resolution is δmγ γ = 1.6 MeV/c 2 (corresponding to δ z = 0.002).
The
π ± γ γ and π ± π 0 invariant mass spectra of the selected
K π γ γ and K 2π candidates, with the expected signal and background contributions evaluated with MC simulations, are shown in
Fig. 1. The number of K π γ γ candidates is N π γ γ = 232, of which
179 (53) are K + (K − ) decay candidates. The number of K 2π candidates is N 2π = 5.488 × 10⁷ , of which 4.431 (1.057) × 107 are K +
(K − ) decay candidates. The kaon charge composition of the sample
is determined mainly by the durations of data taking periods with
single K + and single K − beams. The reconstructed z spectrum of
the K π γ γ candidates is displayed in Fig. 2.
3.3. Backgrounds
The only sizeable background to the normalization mode (K 2π ,
πγ0 γ ) comes from K ± → π 0 μ± ν decays (K μ3 ) followed by πγ0 γ
decays. The background contamination is
R=
B ( K μ3 ) A ( K μ3 )
= 0.115%,
B ( K 2π ) A ( K 2π )
70
The NA62 Collaboration / Physics Letters B 732 (2014) 65–74
Table 1
Bin definition, numbers of signal and background events N j and N Bj , signal acceptances A j and model-independent branching ratios B j evaluated in z bins. The
quoted uncertainties are statistical. The signal acceptance reduces to zero at the
endpoint zmax = 0.515, because the π ± remains too close to the beam pipe to be
detected by the drift chambers.
Fig. 2. (Colour online.) Reconstructed z = (mγ γ /m K )2 spectrum of the K π γ γ candidates compared with the estimated contributions from the signal and the largest
background K ± → π ± π 0 γ . The K ± → π ± π 0 π 0 background, which is an order of
magnitude smaller, is not shown. The estimated signal corresponds to the result of
a ChPT O ( p 6 ) fit. Signal region limits are indicated with vertical arrows.
where B ( K 2π ), B ( K μ3 ) are the nominal branching ratios of the K ±
decay modes [11], and A ( K 2π ) = 16.88%, A ( K μ3 ) = 0.12% are the
acceptances of the K 2π event selection for the two decay chains
evaluated with MC simulation. The quoted acceptances are obtained by averaging over the whole data sample; acceptances for
the subset collected with the Pb bar (with a reduced LKr fiducial
area, see Section 3.2) are about two times lower than those for the
subset collected without the Pb bar. The product N K of the number of K ± decays in the fiducial decay volume in the analyzed data
set and the trigger efficiency for K 2π sample is computed as
NK =
N 2π
B( K 2π )B(πγ γ ) A ( K 2π )(1 + R )
0
= (1.592 ± 0.006) × 109 ,
where the uncertainty is due to the limited precision on the external input B ( K 2π ). The number N B of background events in the
K π γ γ sample is then evaluated as
NB = NK ×
BiB A iB ,
i
where the sum runs over the background kaon decay modes, and
BiB and A iB are the corresponding branching ratios and geometrical acceptances within the K π γ γ selection. This approach relies on
cancellation of the trigger efficiencies, as pointed out in Section 3.1.
The principal background in the K π γ γ sample comes from
K ± → π ± π 0 γ decays followed by πγ0 γ decays. It is due to the
merging of LKr energy deposition clusters produced by a photon from the π 0 decay and a photon from the parent K ± decay,
as detailed in Ref. [6]. This mechanism does not involve particles missing detector acceptance, therefore the relative background
contamination is similar for data subsets collected with and without the Pb bar. This background is estimated with MC simulations as described in Ref. [6]. In particular, the dominant inner
bremsstrahlung (IB) process is simulated according to Ref. [13],
while the smaller contributions from direct emission (DE) and interference between DE and IB are simulated using the expected
ChPT phase space distributions [14,15] and the measured decay
rates [16]. The total background from K ± → π ± π 0 γ decays is estimated to be 15.3 ± 1.1 events, where the uncertainty is due to
limited MC statistics.
Bin z range
Nj
N Bj
Aj
B j × 106
0.20–0.24
0.24–0.28
0.28–0.32
0.32–0.36
0.36–0.40
0.40–0.44
0.44–0.48
z > 0.48
14
20
30
54
56
29
22
7
7.32
3.83
1.97
1.93
1.00
0.57
0.54
0.25
0.177
0.175
0.169
0.160
0.146
0.124
0.087
0.026
0.024 ± 0.013
0.058 ± 0.016
0.104 ± 0.020
0.204 ± 0.029
0.237 ± 0.032
0.144 ± 0.027
0.155 ± 0.034
0.162 ± 0.064
Another source of background in the K π γ γ sample is due to
K ± → π ± π 0 π 0 decays followed by πγ0 γ decays. They contribute
via photons missing the LKr acceptance as well as LKr cluster
merging. This background is estimated to be 2.1 ± 0.3 events,
where the uncertainty is also due to limited MC statistics.
3.4. Model-independent rate measurement
Model-independent partial K π γ γ branching ratios B j in bins of
the z variable defined in Table 1 are computed as
B j = N j − N Bj /( N K A j ),
where N j is the number of reconstructed K π γ γ candidates, N Bj
is the estimated number of background events, A j is the signal
acceptance in bin j, and N K is defined in Section 3.3. Trigger efficiencies nearly cancel at this stage, as discussed Section 3.1.
The dependence of the acceptances A j on the assumed K π γ γ
kinematical distribution can be neglected with respect to the statistical uncertainties, due to the sufficiently small bin width. The
y-dependence of the differential decay rate expected within the
ChPT framework [3,4] arises at next-to-leading order only, and is
weak (for a fixed z, the relative variation of ∂Γ /∂ z∂ y over y is below 14% for z > 0.2 and below 6% for z > 0.25). The y-dependence
of the acceptance is also weak (for a fixed z, the relative variation
over y in the range y / y max < 0.9 is below 10%). As a result, the
measurements of B j are model-independent to a good approximation.
The values of N j , N Bj and A j and the calculated B j with
their statistical uncertainties are listed in Table 1. The modelindependent branching ratio in the kinematic region z > 0.2 is
evaluated as a sum over z bins:
BMI ( z > 0.2) =
8
B j = (1.088 ± 0.093stat ) × 10−6 .
(1)
j =1
3.5. Measurement of ChPT parameters
In the framework of the ChPT description [3,4], the K π γ γ decay
receives no tree-level O ( p 2 ) contribution. The differential decay
rate at leading order O ( p 4 ) and including O ( p 6 ) contributions can
be written as follows:
2 2 ∂Γ
mK
(ˆc , y , z) = 9 3 z2 A cˆ , z, y 2 + B ( z) + C ( z)
∂ y∂ z
2 π
2
1 B ( z)2 .
+ y 2 − λ 1, rπ2 , z
4
2
Here A (ˆc , z, y ) and B ( z) are loop amplitudes (the latter appears at
next-to-leading order and dominates the differential rate at low z),
The NA62 Collaboration / Physics Letters B 732 (2014) 65–74
71
the “negative solution” values cˆ 4 ≈ −8, cˆ 6 ≈ −6. These negative
solutions are however excluded on the basis of a likelihood ratio
test.
3.6. Systematic effects
Fig. 3. Dependence of the K π γ γ branching ratio on the cˆ parameter predicted
within ChPT [3].
and C ( z) is a pole amplitude. The decay rate and spectrum are
determined by a single a priori unknown O (1) parameter cˆ . The
formulation of Ref. [3] is used in this study, as it involves fewer
external parameters than a similar formulation of Ref. [4].
The ChPT expectations for the differential decay rate are illustrated in Refs. [3,4,6]: they include a cusp in the differential
2
decay rate at the di-pion threshold zth = 4rπ
= 0.320 generated
6
by the pion loop amplitude. At O ( p ), a non-zero differential rate
is expected at z = 0, and this is generated by the B ( z) amplitude. The branching ratio in the full kinematic range is expected to
be B ( K π γ γ ) ∼ 10−6 , and its dependence on cˆ is shown in Fig. 3.
A number of external parameters of the ChPT description are extracted from fits to experimental data [3]. These are fixed in this
study in the same way as for the NA48/2 K π γ γ measurement [6].
To measure the cˆ parameter in the ChPT O ( p 4 ) and O ( p 6 )
frameworks [3], fits to the reconstructed z spectrum (Fig. 2) have
been performed by maximizing the log-likelihood
ln L =
17
ni ln mi − mi − ln(ni !) .
i =1
The sum runs over bins of the reconstructed z variable in the range
0.2 < z < 0.54 (the bin width is δ z = 0.02); ni are the numbers of
observed data events in the bins, and mi (ˆc ) = miS (ˆc ) + miB are the
expected numbers of events for a given value of cˆ , including signal
and background components miS (ˆc ) and miB . The quantities mi (ˆc )
are computed using the number N K of K ± decays in the fiducial
volume measured from the normalization sample (Section 3.3), the
expected K π γ γ differential decay rate for a given value of cˆ [3],
and the acceptances of the K π γ γ selection for signal and backgrounds evaluated from MC simulations. The highest bin is above
the K π γ γ kinematic endpoint and is populated due to resolution
effects. The fits to the O ( p 4 ) and O ( p 6 ) descriptions [3] yield the
following results:
cˆ 4 = 1.93 ± 0.26stat ,
cˆ 6 = 2.10 ± 0.28stat .
A binned Kolmogorov–Smirnov test [17] yields p-values of 30% and
98% for the O ( p 4 ) and O ( p 6 ) descriptions, respectively. The data
are consistent with both ChPT descriptions. The z spectrum corresponding to the O ( p 6 ) fit result is shown in Fig. 2.
Within ChPT, the total decay rate has an approximately parabolic
dependence on cˆ (Fig. 3), with a minimum at cˆ = cˆ 0 ≈ −2. This dependence leads to a second (local) maximum of the likelihood at
The largest systematic effect comes from the background estimate in the K π γ γ sample. As discussed in Section 3.3, the background is primarily due to LKr electromagnetic cluster merging.
The effects of the possible differences in merging of clusters between data and MC have been studied by the variation of the cluster lateral width cut, including the removal of the cut, which approximately doubles the background. An additional stability check
involving artificial merging of adjacent LKr clusters resolved by
the reconstruction has been performed, as described in Ref. [6].
These tests have not revealed any systematic effects within their
statistical sensitivity. Maximum variations of the results are conservatively considered as systematic uncertainties: δ BMI ( z > 0.2) =
0.027 × 10⁻⁶ , δˆc 4 = 0.08, δˆc 6 = 0.18. The assigned uncertainties
are of a statistical nature.
The signal and normalization samples have been collected with
the same set of minimum bias trigger conditions. As a result, the
systematic uncertainties due to trigger inefficiency are negligible as
detailed below. The HOD trigger inefficiency measured with a control K 2π sample collected with the NHOD trigger is (0.4 ± 0.1)%,
mainly localized along the scintillator counter boundaries and with
no particular pattern otherwise. Therefore it partially cancels between the K π γ γ and K 2π samples, and the residual uncertainty
is O (0.1%) or below. The upper track momentum (50 GeV/c) and
lower total momentum (70 GeV/c) selection conditions constrain
the LKr energy deposit to be above 20 GeV, significantly above
the LKr trigger threshold of 10 GeV. The corresponding LKr trigger inefficiency has been measured from a K ± → π 0 e ± ν sample
collected with the HOD trigger condition to be below 0.1%. The
inefficiency of the NHOD trigger has been measured as a function of photon energies from a K 2π sample collected with HOD or
LKr trigger conditions. The inefficiencies integrated over the data
samples have been computed to be 0.15% (0.25%) for the K π γ γ
(K 2π ) decays. The difference is due to the higher mean photon energy and therefore higher NHOD energy deposit for K π γ γ events.
A correction for this difference has been introduced for the data
collected with the NHOD trigger; the residual uncertainty is negligible.
The π ± identification efficiency due to the E / p < 0.85 condition (see Section 3.2) has been measured from samples of K 2π and
K ± → 3π ± decays to decrease from 98.6% at p = 8 GeV/c to 98.2%
at p = 50 GeV/c. It is higher for the MC simulated events due to
the limited precision of hadronic shower description. However it
largely cancels separately for data and MC simulated samples between the signal, normalization and background channels due to
its geometric uniformity and weak momentum dependence. The
residual systematic bias is negligible.
The systematic uncertainties on the geometrical acceptances
evaluated with MC simulations are negligible. Accidental activity
effects can be neglected due to the low beam intensity. The uncertainty on the number of kaon decays in the fiducial volume due
to the limited precision on the external input B ( K 2π )B (πγ0 γ ) [11]
leads to negligible uncertainties on the results: δ BMI ( z > 0.2) =
0.004 × 10⁻⁶ , δˆc 4 = δˆc 6 = 0.01.
4. Results
A sample of 232 K π γ γ decay candidates with an estimated
background contamination of 17.4 ± 1.1 events collected with minimum bias trigger conditions by the NA62 experiment at CERN in
72
The NA62 Collaboration / Physics Letters B 732 (2014) 65–74
2007 has been analyzed. The model-independent K π±γ γ branching
ratio in the kinematic region z > 0.2 is measured to be
BMI ( z > 0.2) = (1.088 ± 0.093stat ± 0.027syst ) × 10−6 .
Measurements performed separately for K + and K − decays are
consistent within 1.5 standard deviations:
+
BMI
( z > 0.2) = (1.010 ± 0.098stat ) × 10−6 ,
−
BMI
( z > 0.2) = (1.417 ± 0.256stat ) × 10−6 .
The observed decay spectrum agrees with the ChPT expectations.
The values of the cˆ parameter in the framework of the ChPT O ( p 4 )
and O ( p 6 ) parameterizations [3] have been obtained from fits to
the data z spectrum:
Table 2
Combined results of this analysis and NA48/2 values [6] for the model-independent K π γ γ branching ratio B j in z bins. The quoted errors are statistical only.
Bin z range
B j × 106
0.20–0.24
0.24–0.28
0.28–0.32
0.32–0.36
0.36–0.40
0.40–0.44
0.44–0.48
z > 0.48
0.030 ± 0.011
0.046 ± 0.011
0.097 ± 0.015
0.194 ± 0.022
0.207 ± 0.023
0.123 ± 0.019
0.164 ± 0.025
0.104 ± 0.036
cˆ 4 = 1.93 ± 0.26stat ± 0.08syst ,
cˆ 6 = 2.10 ± 0.28stat ± 0.18syst .
The data are insufficient to discriminate between the O ( p 4 ) and
O( p 6 ) parameterizations. The measured value of cˆ 6 translates into
the following model-dependent branching ratio in the full kinematic range, obtained by integration of the ChPT O ( p 6 ) differential
decay rate:
BChPT = (1.058 ± 0.066stat ± 0.044syst ) × 10−6 .
The statistical error of BChPT is smaller than that of BMI because
the low acceptance in the high z bins leads to large statistical
errors of B j (see Table 1), which propagate directly into BMI according to Eq. (1), while having a small influence on the fitting
procedure used to obtain BChPT .
5. Discussion
5.1. Combination with the NA48/2 K π γ γ results
A combination of the present results with those from the
NA48/2 K π±γ γ measurement [6] has been performed. Systematic
uncertainties on the combined results are dominated by those due
to background subtraction. They have been estimated by studying the stability of the combined results with respect to variation
of the selection conditions applied separately to the independent
NA48/2 and NA62 data samples.
The combined measurements of model-independent branching
ratios B j in z bins with their statistical uncertainties are presented
in Table 2. The NA48/2 and NA62 measurements of B j are in
agreement, as seen in Fig. 4. The model-independent branching ratio BMI ( z > 0.2) obtained by summing the combined values of B j
is
BMI ( z > 0.2) = (0.965 ± 0.061stat ± 0.014syst ) × 10−6 .
Fig. 4. (Colour online.) Measurements of the model-independent K π γ γ branching
ratios B j in z bins: NA48/2 [6], present result and the combination of the two.
The horizontal bars indicate the bin widths, while the vertical bars indicate the
statistical errors. The values of B j computed within ChPT O ( p 6 ) formulation [3],
obtained by integration of the ChPT differential decay rate for the central value of
the combined measurement cˆ 6 = 1.86 over the bin width, are also shown. The lines
connecting the markers are drawn to guide the eye.
cˆ 4 = 1.72 ± 0.20stat ± 0.06syst ,
cˆ 6 = 1.86 ± 0.23stat ± 0.11syst ,
where the second error is the experimental systematic uncertainty.
Integration of the O ( p 6 ) differential decay rate for the above value
of cˆ 6 over the whole physical region of the kinematic variables
leads to the following branching ratio:
BChPT = (1.003 ± 0.051stat ± 0.024syst ) × 10−6
= (1.003 ± 0.056) × 10−6 .
±
The combined BMI
(z > 0.2) measurements separately for K +
−
and K
decays, obtained by averaging the NA48/2 and NA62
±
BMI
(z > 0.2) results, are
The corresponding model-dependent values of BChPT in z bins are
displayed in Fig. 4.
+
BMI
( z > 0.2) = (0.951 ± 0.072stat ) × 10−6 ,
5.2. Comparison with earlier measurements of ChPT parameters
−
BMI ( z > 0.2) = (1.004 ± 0.127stat ) × 10
−6
.
These values are consistent: the charge asymmetry of the decay
+
−
+
−
rate is ( K π γ γ ) = (BMI
− BMI
)/(BMI
+ BMI
) = −0.03 ± 0.07, where
the sub-dominant systematic uncertainties are neglected.
The NA48/2 and NA62 measurements of the ChPT parameter cˆ
consider the same set of external parameters. The combination of
the two results is therefore straightforward, and the results are
The measurements of the cˆ parameter in the ChPT framework [3,18] published before this analysis and Ref. [6] are:
• cˆ 4 and cˆ 6 measurements from a sample of 31 K π+γ γ decay
candidates recorded by the BNL E787 experiment [5];
• cˆ 6 measurement from a sample 120 K π±γ ee decay candidates
recorded by the NA48/2 experiment [7].
The NA62 Collaboration / Physics Letters B 732 (2014) 65–74
Table 3
Values of the external parameters considered for cˆ measurements from K π γ γ and
K π γ ee decays. The notation is introduced in Refs. [3,19,20].
Measurement
BNL E787 [5]
NA48/2 [7]
NA48/2 [6] and
present analysis
Decay mode
K π+γ γ
K π±γ ee
K π±γ γ
2.24
91.71
−7.36
−25.68
−2.43
2.26
−0.47
−1.51
0
2.210
91.7
−7.4
−25.7
−2.4
2 .3
− 0.5
−1.5
0
2.202
93.16
−6.72
−27.06
−2.22
2.95
−0.40
−1.83
0
G 8 m2K
× 10
α1 × 10⁸
α3 × 10⁸
6
β1 × 10⁸
β3 × 10⁸
γ3 × 10⁸
ζ1 × 10⁸
ξ1 × 10⁸
ηi (i = 1; 2; 3)
The branching ratio in the full kinematic range BChPT obtained assuming the ChPT O ( p 6 ) description, reported in Section 5.1, has a negligible sensitivity to the above differences of
external parameters. It agrees with the E787 result BChPT = (1.1 ±
0.3 ± 0.1) × 10−6 [5], and is 5 times more precise. It is also
in agreement with an early prediction for the total decay rate
Γ ( K π γ γ ) = 76 s−1 [1] which, considering a mean K ± lifetime of
τ K = (1.2380 ± 0.0021) × 10−8 s [11], translates into B( K π γ γ ) =
τ K Γ ( K π γ γ ) = (0.941 ± 0.002) × 10−6 .
5.3. External uncertainties on ChPT parameters
The values of external parameters considered for these measurements differ from those used to obtain the results reported in
Section 5.1, as summarized in Table 3.21
The G 8 parameter enters both O ( p 4 ) and O ( p 6 ) descriptions. It
is fixed according to Ref. [19] in this study. Considering higher values of G 8 used for the earlier E787 (NA48/2) measurements modifies the results reported in Section 5.1 by ˆc 4 = −0.12(−0.02),
ˆc 6 = −0.04(−0.01), respectively. The shift is negative because
the ChPT decay rate for the experimentally established “positive solution” (cˆ > cˆ 0 ≈ −2) is characterized by ∂ B /∂ cˆ > 0 and
∂ B /∂ G 8 > 0.
The K 3π amplitude parameters enter the O ( p 6 ) formulation.
They are fixed according to Ref. [20] in this study. Both earlier
measurements employed a set of parameters obtained from another fit [21]. The corresponding shift of the result quoted in Section 5.1 is ˆc 6 = −0.26, primarily due to the sensitivity to the ξ1
parameter.
This study, similarly to the previous measurements, considers
zero values of the polynomial contributions entering the O ( p 6 )
formulation (ηi = 0). The parameter cˆ enters the differential decay rate via a linear combination
cˆ ∗ = cˆ − 2(mπ /m K )2 η1 − 2η2 − 2η3 .
73
(2)
Assuming ηi = 0 is equivalent to measuring cˆ ∗ . The value of cˆ can
be computed for any set of η from the measured cˆ ∗ using the
The expressions for the O ( p 4 ) loop amplitude A (ˆc , z) differ
between the ChPT formulations of Ref. [3] and Ref. [4]: the latter includes non-octet G 27 terms. The difference between the fit
results derived from the two formulations is δˆc 4 = 0.25. The expression for the O ( p 6 ) loop amplitude with non-octet terms is not
available in the literature.
Another difference between the two ChPT formulations lies in
the computation of the pole amplitude C ( z). Its contribution to
the total decay rate is sub-dominant (Bpole = 0.05 × 10⁻⁶ according to [3]; Bpole < 0.03 × 10⁻⁶ according to [4]), and the presently
available data sample is not large enough to distinguish between
the two formulations. The difference between the fit results with
and without inclusion of the C ( z) amplitude gives conservative
estimates of the corresponding external uncertainties: δˆc 4 = 0.16,
δˆc 6 = 0.18.
The uncertainties on the K 3π decay amplitude parameters induce an error on the measured cˆ 6 parameter. By far, the largest
contribution comes from ξ1 : an uncertainty of δξ1 = 0.30 ×
10−8 [20] translates into δˆc 6 = 0.30. The uncertainty on ξ1 could
be reduced by considering the precision measurements of the K 3π
decay amplitudes [22,23]. The errors on the measured cˆ 6 due to
the assumption ηi = 0 can be evaluated from Eq. (2). The uncertainties on the external parameters ηi are not available in the
literature.
The total external error is comparable to or larger than the
achieved experimental precision.
6. Summary
i
above relation.
The combined cˆ measurements from this analysis and Ref. [6]
obtained using the set of external parameters considered in Ref. [5]
are
cˆ 4 = 1.60 ± 0.20stat ± 0.06syst ,
cˆ 6 = 1.56 ± 0.23stat ± 0.11syst .
They agree with the E787 results cˆ 4 = 1.6 ± 0.6, cˆ 6 = 1.8 ± 0.6 [5].
Similarly, the combined cˆ 6 measurement obtained using the set of
external parameters considered in Ref. [7] is
cˆ 6 = 1.59 ± 0.23stat ± 0.11syst ,
which agrees to 1.3 standard deviations with the NA48/2 measurement cˆ 6 = 0.90 ± 0.45 from a K π±γ ee sample [7]. However, a comparison of cˆ measurements obtained from different decay modes
(K π γ γ and K π γ ee ) might be affected by additional external uncertainties.
21
The exact values of the external parameters considered for the earlier measurements are not explicitly given in Refs. [5,7], but were provided by the corresponding
authors.
A model-independent measurement of the K π γ γ decay rate
and fits to the ChPT description have been performed. The results
have been combined with those from a recent K π γ γ measurement
by the NA48/2 Collaboration. The results of the combination are as
follows. The model-independent branching ratio in a limited kinematic range is BMI ( z > 0.2) = (0.965 ± 0.063)× 10−6 and its charge
asymmetry is ( K π γ γ ) = −0.03 ± 0.07. The observed decay spectrum agrees with the ChPT description, and ChPT parameters measured within the considered formulations are cˆ 4 = 1.72 ± 0.21 and
cˆ 6 = 1.86 ± 0.25. The branching ratio in the full kinematic range
assuming the O ( p 6 ) description is BChPT = (1.003 ± 0.056) × 10−6 .
The uncertainties are dominated by the statistical errors while including a small experimental systematic contribution.
These results agree with earlier data and improve significantly
on previous experimental knowledge. The obtained experimental
precision (δˆc ≈ 0.2, δ BChPT /BChPT ≈ 5%) may prompt more refined
theoretical studies to constrain better the external parameters
whose uncertainties are now larger than the experimental errors.
Acknowledgements
It is a pleasure to express our appreciation to the staff of
the CERN laboratory and the technical staff of the participating
laboratories and universities for their efforts in the operation of
74
The NA62 Collaboration / Physics Letters B 732 (2014) 65–74
the experiment and data processing. We are grateful to Giancarlo
d’Ambrosio, John Fry and Jorge Portolés for fruitful discussions.
References
[1]
[2]
[3]
[4]
[5]
[6]
[7]
[8]
[9]
[10]
L.M. Sehgal, Phys. Rev. D 6 (1972) 367.
G. Ecker, A. Pich, E. de Rafael, Nucl. Phys. B 303 (1988) 665.
G. D’Ambrosio, J. Portolés, Phys. Lett. B 386 (1996) 403.
J.-M. Gérard, C. Smith, S. Trine, Nucl. Phys. B 730 (2005) 1.
P. Kitching, et al., Phys. Rev. Lett. 79 (1997) 4079.
J.R. Batley, et al., Phys. Lett. B 730 (2014) 141.
J.R. Batley, et al., Phys. Lett. B 659 (2008) 493.
J.R. Batley, et al., Eur. Phys. J. C 52 (2007) 875.
V. Fanti, et al., Nucl. Instrum. Methods A 574 (2007) 433.
C. Lazzeroni, et al., Phys. Lett. B 719 (2013) 326.
[11] J. Beringer, et al., Particle Data Group, Phys. Rev. D 86 (2012) 010001.
[12] GEANT detector description and simulation tool, 1994, CERN program library
long writeup W5013.
[13] C. Gatti, Eur. Phys. J. C 45 (2006) 417.
[14] N. Christ, Phys. Rev. 159 (1967) 1292.
[15] G. D’Ambrosio, M. Miragliuolo, P. Santorelli, DANE physics handbook,
LNF-92/066.
[16] J.R. Batley, et al., Eur. Phys. J. C 68 (2010) 75.
[17] F. James, Statistical Methods in Experimental Physics, 2nd edition, World Scientific, 2006.
[18] F. Gabbiani, Phys. Rev. D 59 (1999) 094022.
[19] V. Cirigliano, et al., Rev. Mod. Phys. 84 (2012) 399.
[20] J. Bijnens, P. Dhonte, F. Persson, Nucl. Phys. B 648 (2003) 317.
[21] J. Kambor, J.H. Missimer, D. Wyler, Phys. Lett. B 261 (1991) 496.
[22] J.R. Batley, et al., Phys. Lett. B 649 (2007) 349.
[23] J.R. Batley, et al., Eur. Phys. J. C 64 (2009) 589.
© Copyright 2026 Paperzz
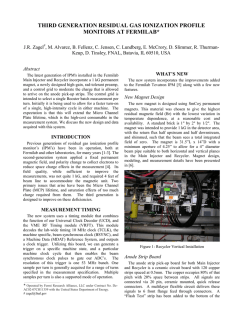
![arXiv:1501.03541v1 [hep-ex] 15 Jan 2015](http://s3.paperzz.com/store/data/003009444_1-fa955a5d4b7805fd4f2a5f6da7ace6a3-250x500.png)