平成25年
厚生労働統計のあらまし
Outline of Health, Labour and Welfare Statistics
2013
厚生労働省大臣官房統計情報部
Statistics and Information Department, Minister's Secretariat,
Ministry of Health, Labour and Welfare, Japan
まえがき
厚生労働行政は、人の誕生から老後まで、日々の国民生活全般にわたる
幅広いフィールドに関わっています。
厚生労働省大臣官房統計情報部においては、人々のライフサイクルの各
段階に対応して、様々な統計調査を実施することにより、人々の「安心」
と「活力」とをもたらすための政策を展開していくための基礎データを提
供しています。
本冊子は、統計情報部で実施している統計調査の結果をできるだけ平易
に分かりやすく紹介するものであり、厚生労働統計の理解を深める一助と
なれば幸いです。
平成26年2月
厚生労働省大臣官房統計情報部長
姉 崎 猛
Preface
Health, labour and welfare administration in Japan covers the wide
range of the nation’
s whole life from the birth to the elderly life.
Statistics and Information Department offers basic data in
promoting policies which bring people“secure”and“vital”life by
carrying out various statistical surveys corresponding to the each
stage of life cycle.
This booklet aims to illustrate the findings of the statistical
surveys carried out by our department briefly, and it would be our
pleasure that this booklet may deepen your understanding of health,
labour and welfare statistics.
February 2014
TAKESHI ANEZAKI
Director - General
Statistics and Information Department
Minister’
s Secretariat,
Ministry of Health, Labour and Welfare,
Japan
1
出生
Natality
出
生
数
1,037,231人(30秒に1人)
合計特殊出生率
1.41
児童
死亡
Children
Deaths
保育所入所人員数4月1日現在
2,177,158人
死 亡 数
1,256,359人(25秒に1人)
虐 待 相 談 対 応 件 数
66,701件
平均寿命
男 79.94年 女 86.41年
日々のくらし
Life
就職
全
国
世
帯
数
1世帯当たり平均所得金額
Employment
初 任 給(大 卒 男 子)
4,817万世帯
548万2千円
(※平成23年)
20万2千円
年次有給休暇取得日数
老後
Old age
高齢者世帯
8.6日
1,024万1千世帯
病気になったら
Medical care
結婚
医
数
17万7千施設
人口一人当たり国民医療費
療
施
設
29万2千円
Marriages
結
婚
平均初婚年齢
退職
Retirement
668,869組(47秒に1組)
退職給付額(大卒)
夫 30.8歳 妻 29.2歳
1,941万円
出産・育児
Childbirth・Child-rearing
第1子を持つ年齢
父 32.3歳
母 30.3歳
2
◇ 出生は30秒に1人、合計特殊出生率は1.41 ……………………………………………………
◇ 合計特殊出生率は沖縄県がトップ ……………………………………………………………
◇ 合計特殊出生率は近年、諸外国と比べて低率 ………………………………………………
7
8
8
◇ 保育所数、定員、入所人員ともに増加傾向 ………………………………………………… 9
◇ 児童相談所における相談の約5割が障害相談 ……………………………………………… 10
◇ 虐待相談対応件数は、「身体的虐待」がもっとも多い ……………………………………… 10
◇
◇
◇
◇
◇
◇
◇
◇
◇
◇
◇
◇
大学卒の初任給は、男性は20万1,800円、女性は19万6,500円 ………………………………
大企業の男性の賃金のピークは小企業の1.6倍 ………………………………………………
年間労働時間は1,765時間 ………………………………………………………………………
約9割の企業で何らかの週休2日制採用 ……………………………………………………
年次有給休暇の取得率は5割程度 ……………………………………………………………
パートを選んだ理由は「自分の都合の良い時間(日)に働きたいから」…………………
パートで仕事を続けたい男性は64.2%、女性は74.8% ………………………………………
派遣労働者が就業している事業所の割合は10.8%、就業させる理由は「欠員補充
等必要な人員を迅速に確保できるため」………………………………………………………
短時間労働者の女性の賃金のピークは35 ~ 39歳で1,056円 …………………………………
メンタルヘルス不調により連続1か月以上休業又は退職した労働者がいる事業所
の割合は8.1% ……………………………………………………………………………………
労働組合推定組織率は17.7% …………………………………………………………………
結婚して同一就業を継続しているのは男81.1%、女51.8% …………………………………
11
11
12
12
13
13
14
14
15
15
16
16
◇ 結婚は47秒に1組 ……………………………………………………………………………… 17
◇ 夫・妻ともに進む晩婚化 ……………………………………………………………………… 18
◇ 離婚は2分14秒に1組
………………………………………………………………………… 18
◇ 父母の平均年齢は上昇
3
………………………………………………………………………… 19
◇ 第1子出生時に有職の母の割合は34.5% ……………………………………………………… 19
◇「勤め(常勤)」の母の育児休業の取得割合は93.5% ………………………………………… 20
◇「勤め(常勤)」の父の育児休業の取得割合は2.0% ………………………………………… 20
◇
◇
◇
◇
男の約8割、女の約4割は正規の職員、従業員 ……………………………………………
悩みやストレスがある者の割合は男女ともに40 ~ 49歳が最も高い ………………………
男は約7割、女は約6割について健診や人間ドックを受診している ………………………
世帯の約6割は生活が苦しい(「大変苦しい」「やや苦しい」)………………………………
21
21
22
22
◇
◇
◇
◇
全国の病院・診療所は約10万9千施設、歯科診療所は約6万8千施設 …………………
全国の医療施設に従事する医師数(人口10万対)は、219.0人 ……………………………
全国の受療率(人口10万対)は、入院1,068、外来5,784 ……………………………………
人口一人当たり国民医療費は約29万2千円 …………………………………………………
23
23
24
24
◇ 一律定年制を定めている企業の9割強に、定年後の措置あり …………………………… 25
◇ 退職給付は、月給の約35 ~ 38 ヶ月分 ……………………………………………………… 26
◇ 退職給付制度のある企業は、全体の約8割 ………………………………………………… 26
◇
◇
◇
◇
単独世帯、夫婦のみの世帯の者の割合が上昇傾向 …………………………………………
65歳以上の同居の主な介護者が65歳以上の要介護者等を介護する割合は約46% ………
高齢者世帯の平均所得金額は約300万円 ………………………………………………………
訪問入浴介護、訪問看護ステーションの利用者では「要介護5」が最も多い …………
27
27
28
28
◇ 死亡は25秒に1人 ………………………………………………………………………………
◇「がん」が死因のトップ …………………………………………………………………………
◇ 平均寿命は、男は長野県松川村、女は沖縄県北中城村がトップ …………………………
◇ 日本人の平均寿命、男79.94年、女86.41年 ……………………………………………………
29
29
30
30
◆ 統計情報部で実施している統計調査一覧
…………………………………………………… 31
4
Contents
Natality
◇ We have one birth in every 30 seconds and total fertility rate is 1.41 …………………………
◇ Okinawa prefecture is the top in total fertility rate ……………………………………………
◇Total fertility rate in recent years has a lower rate than other countries ………………………
7
8
8
Children
◇ The number of facility, capacity and enrollment of nursery centers are all increasing ……… 9
◇ About 50% of cases handled by child guidance center are counseling on mental and
physical disabilities ………………………………………………………………………………… 10
◇ The most child abuse consultation cases are“physical abuse” ……………………………… 10
Employment
◇
◇
◇
◇
◇
◇
Starting salary of university graduate is 201,800 yen for male, 196,500 yen for female ………
A peak of wages of male at big enterprises is 1.6 times of small enterprises ………………
Annual total hours worked are 1,765 hours ……………………………………………………
About 90% of enterprises adopt some type of weekly two days off …………………………
Acquisition rate of paid annual leave is around 50% ……………………………………………
The reason why people chose part-time employment was because they prefered to
work the hours (days) that suit themselves ……………………………………………………
◇ 64.2% of men and 74.8% of women want to continue working in a part-time job …………
◇10.8% of establishments use dispatched workers and the reason for using them was
because they can smoothly secure necessary manpower for vacant posts etc. ……………
◇ A peak of wages of part-time females is 1,056 yen at 35-39 years old ………………………
◇ Ratio of establishments where employees took leave from work for one continuous
month or more, or retired due to mental health disorders was 8.1% …………………………
◇ Estimated unionization rate is 17.7% ……………………………………………………………
◇ 81.1% of male and 51.8% of female continue the same job before and after marriage ……
11
11
12
12
13
13
14
14
15
15
16
16
Marriages
◇ We have one newly-married couple in every 47 seconds ……………………………………… 17
◇ Mean age of first marriage are getting higher for both sexes ………………………………… 18
◇ We have one divorced couple in every 2 minutes 14 seconds ……………………………… 18
Childbirth・Child-rearing
◇
◇
◇
◇
5
Mean age of both parents are rising ……………………………………………………………
Working mothers accounted for 34.5% of all mothers who gave birth to their first child ……
Working (permanent) mothers who take child care leave is 93.5% ……………………………
Working (permanent) fathers who take child care leave is 2.0% ………………………………
19
19
20
20
Life
◇ About 80% of men and 40% of women are regular employees and staffs …………………
◇ The age group having the highest share of people with worry or stress is 40-49 years
old for both men and women ……………………………………………………………………
◇ About 70% of men and 60% of women receive health checkups or thorough medical
checkups …………………………………………………………………………………………
◇ About 60% of households feel their living condition is difficult
("very difficult" and "somewhat difficult") ………………………………………………………
21
21
22
22
Medical care
◇ The number of hospitals and medical clinics is about 109,000 and the number of dental
clinics is about 68,000 ……………………………………………………………………………
◇ The total number of physicians practicing in medical institutions (hospitals or clinics) per
100,000 population is 219.0 ………………………………………………………………………
◇ The rates of estimated patients (per 100,000 population, per day) is 1,068 for inpatients
and 5,784 for outpatients …………………………………………………………………………
◇ The annual medical care expenditure per capita is about 292,000 yen ………………………
23
23
24
24
Retirement
◇ More than 90 % of enterprises which have fixed retirement age system have systems
after retirement …………………………………………………………………………………… 25
◇ Retirement benefit equals to about 35-38 month of salary …………………………………… 26
◇ About 80% of enterprises have retirement benefit system …………………………………… 26
Old age
◇ The share of one-person households and households of a couple only are increasing ………
◇ About 46% of the main carer living with a cared person aged 65 years and over is 65
years old and over …………………………………………………………………………………
◇ The average income of an aged household is about 3 million yen ……………………………
◇ The largest user of Home-visit bathing service and Home-visit nursing are "care level 5" ……
27
27
28
28
Deaths
◇ We have one death in every 25 seconds ………………………………………………………
◇ Cancer is the leading cause of death ……………………………………………………………
◇ Matsukawa village (in Nagano Prefecture) is the highest in the life expectancy at birth
for male, Kitanakagusuku village (in Okinawa Prefecture) for female …………………………
◇ Life expectancy at birth in Japanese for male is 79.94 years, for female is 86.41 years ……
29
29
30
30
List of statistical surveys
◆ A list of statistical surveys implemented by Statistics and Information Department
……… 31
6
出 生
Natality
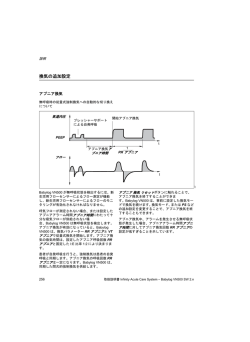
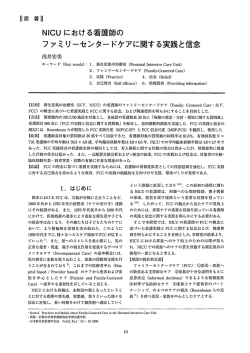
◇出生は30秒に1人、合計特殊出生率は1.41
We have one birth in every 30 seconds and total fertility rate is 1.41
出生数及び合計特殊出生率の年次推移 −昭和22∼平成24年−
Trends in number of live births and total fertility rates,1947−2012
(万人)
300
Number of live births
合計特殊出生率
Total fertility rate
第2次べビーブーム
Second baby boom
昭和46∼49年
(1971−1974)
4.32
3
平成24年(2012)
1,037,231人
(30秒に1人)
One birth in every 30 seconds
150
2
100
2.14
1.58
1.41
50
0
0
昭和22 ・
1947 30
'55'
・
40
'65
・
50
'75'
・
60
'85'
・ 平成 7
'95'
・
17
2005'
・ 24
'12
(年)Year
注:「合計特殊出生率」とは、その年次の15歳から49歳までの女性の年齢別出生率を合計したもので、1人の女性が仮にその年次の年齢別出生率で
一生の間に生むとしたときの子ども数に相当する。
Note“Total Fertility Rate”the sum of live birth rate by age for women aged 15 to 49 ; the average number of children born to a
woman over the course of her lifetime, assuming a consistent live birth rate by age in the future.
資料「人口動態統計」
Source :“Vital Statistics”
7
1
Total fertility rate
ひのえうま
Hinoeuma
昭和41年
(1966)
4
合計特殊出生率
出 生 数
Number of live births (Ten thousands)
250
200
5
出生数
第1次ベビーブーム
First baby boom
昭和22∼24年
(1947−1949)
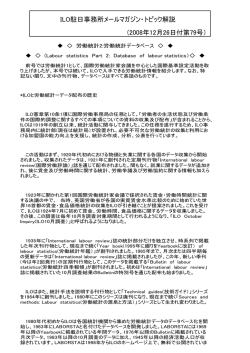
◇合計特殊出生率は沖縄県がトップ
Okinawa prefecture is the top in total fertility rate
都道府県別にみた合計特殊出生率 −平成24年−
Total fertility rates by prefecture, 2012
全国値
All Japan 1.41
1.51以上 1.51 and over
1.41 ∼ 1.50
1.31 ∼ 1.40
1.21 ∼ 1.30
1.20以下 1.20 and under
資料「人口動態統計」
Source :“Vital Statistics”
沖縄県 1.90
Okinawa
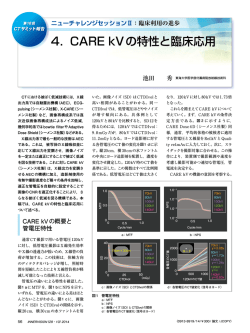
◇合計特殊出生率は近年、諸外国と比べて低率
Total fertility rate in recent years has a lower rate than other countries
合計特殊出生率の年次推移−諸外国との比較 −1947∼2012年−
Trends in total fertility rates in selected countries,1947−2012
5
オランダ
Netherlands
シンガポール
Singapore
4
Total fertility rate
合計特殊出生率
フランス
France
韓国
アメリカ合衆国
Korea
3
U.S.A.
2.00
1.91
1.90
1.89
1.76
2
イギリス
United Kingdom
1.42 1.41
1.36
1.30
1.29
スウェーデン
Sweden
1
ドイツ
イタリア
Germany
日本
Italy
Japan
0
昭和22
1947
・
30
'55
・
40
'65
注1):点線は数値なし。
2):ドイツは1990年までは旧西ドイツの数値である。
3):イギリスは1981年まではイングランド・ウェールズの数
値である。
Note 1. Dotted line means no data.
2. Germany : Former West Germany until 1990.
3. U.K. : England and Wales until 1981.
・
50
'75
・
60
'85
・
平成7
'95
・
17
2005
・ 24
'12
(年)Year
資料:UN「Demographic Yearbook」
U.S.Department of Health and Human Services「National Vital Statistics Report」
Eurostat「Population and Social Conditions 」
Council of Europe「Recent demographic developments in Europe」
韓国統計庁資料
国立社会保障・人口問題研究所資料
Source : UN“Demographic Yearbook”
U.S.Department of Health and Human Services“National Vital Statistics Report”
Eurostat“Population and Social Conditions”
Council of Europe“Recent demographic developments in Europe”
Korea National Statistical Office
National Institute of Population and Social Security Research
8
児 童
Children
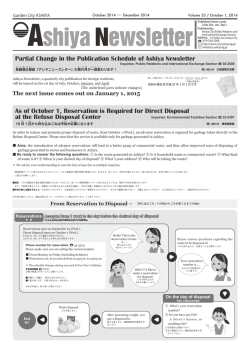
◇保育所数、定員、入所人員ともに増加傾向
The number of facility, capacity and enrollment of nursery centers are all increasing
保育所数、定員、入所人員の年次推移 −平成15 ∼平成24年−
Trends in the number of facility, capacity and enrollment of nursery centers, 2003−2012
平成24年(2012)
保 育 所 数 23,685所
(万人)
24,000
定 員 2,240,424人
定員
Admission capacity
230
Admission capacity
入所人員数 2,177,158人
入所人員数
Number of enrollment
Number of enrollment
23,500
保育所数
Number of facility
220
23,000
200
22,500
190
180
Number of facility
210
保育所数
定員・入所人員
Number of capacity and enrollment (Ten thousands)
(施設)
Number of facility
240
22,000
170
21,500
160
0
平成15
2003
16
'04
17
'05
18
'06
19
'07
20
'08
21
'09
22
'10
23
'11
0
24
'12
(年)Year
注1):各年4月1日現在
2):東日本大震災の影響により、平成23年4月1日現在は、宮城県(仙台市以外)及び福島県(郡山市及びいわき市以外)を除いて集計した数値である。
Note 1. As of April 1st, each year
2. As of April 1st, 2011, Miyagi Prefecture (with the exception of Sendai-shi) and Fukushima Prefecture (with the exceptions of
Koriyama-shi and Iwaki-shi) are excluded from the data due to the impact of the Great East Japan Earthquake.
資料「福祉行政報告例」
Source :“Report on Social Welfare Administration and Services”
9
◇児童相談所における相談の約5割が障害相談
About 50% of cases handled by child guidance center are counseling on mental and
physical disabilities
児童相談所における相談の種類別対応件数 −平成24年度−
Number of handled cases by child guidance center, 2012
その他の相談
保健相談
Counseling on others
Counseling on health
20,891件
(5.4%)
2,538件
(0.7%)
非行相談
Counseling on deliquency
16,640件
(4.3%)
総 数
Total
384,261件
(100.0%)
育成相談
Counseling on rearing children
52,182件
(13.6%)
障害相談
Counseling on mental and
physical disabilities
175,285件
(45.6%)
養護相談
Counseling on protective care
116,725件
(30.4%)
資料「福祉行政報告例」
Source :“Report on Social Welfare Administration and Services”
◇虐待相談対応件数は、「身体的虐待」が最も多い
The most child abuse consultation cases are“physical abuse”
児童相談所における児童虐待の相談種別対応件数の年次推移 −平成20 ∼24年度−
Trends in number of cases disposed about child abuse at child guidance center, 2008−2012
(件)Number of cases
虐待相談対応件数
Number of cases disposed about child abuse
80,000
70,000
性的虐待
Sexual abuse
心理的虐待
Psychological abuse
60,000
50,000
1,324
42,664
40,000
9,092
保護の怠慢・拒否(ネグレクト)
Neglect
身体的虐待
Physical abuse
1,350
1,405
44,211
10,000
0
1,460
66,701
59,919
22,423
15,068
17,670
10,305
30,000
20,000
56,384
1,449
15,905
15,185
16,343
17,371
平成20
2008
平成21
2009
注:平成22年度は、東日本大震災の影響により、福島県を除いて集計した数値である。
Note : Fukushima Prefecture is excluded from the data of FY2010 due to
the impact of the Great East Japan Earthquake.
19,250
18,352
18,847
21,559
21,942
23,579
平成22
2010
平成23
2011
平成24
2012
(年度)Fiscal year
資料「福祉行政報告例」
Source :“Report on Social Welfare Administration and Services”
10
就 職
Employment
◇大学卒の初任給は、男性は20万1800円、女性は19万6500円
Starting salary of university graduate is 201,800 yen for male,196,500 yen for female
性・学歴別新規学卒者の初任給額の年次推移(産業計) −昭和51∼平成24年−
Trends in starting salary for new graduates by sex and educational attainment (Industries covered), 1976−2012
(千円)
240
220
初任給額
Starting salary (1,000 yen)
200
180
160
140
男 大学院修士課程修了
120
Male Graduate school
男 大 学 卒
Male College or university
100
男 高専・短大卒
Male Junior college
男 高 校 卒
80
Male Upper secondary school
女 大学院修士課程修了
60
Female Graduate school
女 大 学 卒
40
Female College or university
女 高専・短大卒
Female Junior college
20
女 高 校 卒
Female Upper secondary school
0
昭和51
1976
55
'80
60
'85
平成元
'89
5
'93
10
'98
15
2003
20
'08
24 (年)Year
'12
資料「賃金構造基本統計調査」
Source :“Basic Survey on Wage Structure”
◇大企業の男性の賃金のピークは小企業の1.6倍
A peak of wages of male at big enterprises is 1.6 times of small enterprises
性・年齢階級・企業規模別賃金(産業計) −平成24年−
Wages by sex, age group and size of enterprise (Industries covered), 2012
(千円)
550
500
450
400
男 大企業
Male 1000 employee and over
男 中企業
Male 100 - 999 employee
男 小企業
Male 10 - 99 employee
女 大企業
Female 1000 employee and over
女 中企業
Female 100 - 999 employee
賃 金
Wage (1,000 yen)
女 小企業
350
Female 10 - 99 employee
300
250
200
150
100
50
0
20 ∼ 24
25 ∼ 29
30 ∼ 34
35 ∼ 39
40 ∼ 44
45 ∼ 49
50 ∼ 54
55 ∼ 59
60 ∼ 64
65 ∼ 69 (歳)Years old
資料「賃金構造基本統計調査」
Source :“Basic Survey on Wage Structure”
11
◇年間労働時間は1,765時間
Annual total hours worked are 1,765 hours
年間総実労働時間の年次推移(産業計) −平成2∼24年−
Trends in annual total hours worked (Industries covered), 1990−2012
(時間)Hours
所定外労働時間
Non-Scheduled hours worked
所定内労働時間
Scheduled hours worked
2200
2,064
2000
年間総実労働時間数
Annual total hours worked
2,023
156
147
1,982
126
1800
1,920 1,910
1,910
1,919
114
115
123
112
1,891
1,871
123
115
1,840
1,853
1,836
1,825 1,828
1,816 1,802 1,811
114
118
113
114
124
120
124
129
1,808
1,792
1,908 1,876
1,856
1,806 1,798
1,795
1,796 1,768
1,754
1,747
1,765
132
129
111
120
120
125
1,640
1600
1400
1,733
1,756 1,726
1,735
1,723
1,711 1,708
1,692 1,678 1,682
1,676
1,663 1,622
1,634
1,627
10
12
13
14
16
19
20
22
23 24
2012
(年)Year
1200
1000
平成2
1990
3
4
5
6
7
8
9
11
15
17 18
21
注1):常用労働者5人以上の事業所。
2):「所定内労働時間数」は事業所の労働協約、就業規則等で定められた正規の始業時刻と終業時刻の間の実労働時間数のことであり、「所定外労働時間数」は、
早出、残業、臨時の呼出、休日出勤等の実労働時間数のことである。
Note 1. Establishments with 5 regular employees or more.
2. "Scheduled hours worked": actual number of hours worked between starting and ending hours of employment determined by the work
regulations of the establishment
"Non-scheduled hours worked": actual number of hours worked except "Scheduled hours worked" (e.g. early morning work, overtime
work or work on a day off).
資料「毎月勤労統計調査」
Source :“Monthly Labour Survey”
◇約9割の企業で何らかの週休2日制採用
About 90% of enterprises adopt some type of weekly two days off
週休2日制の採用割合
Ratio of enterprises which adopt weekly two days off
企業規模別にみた週休2日制の採用割合 −平成25年−
Ratio of enterprises that adopt weekly two days off by size of enterprise, 2013
(%)
100
90.2
85.3
80
89.6
88.4
83.8
69.5
62.0
60
54.2
46.0
41.7
40
20
0
企業規模計
Total for all sizes of enterprise
何らかの週休2日制
1,000人以上
Employees and over
Some type of weekly two days off
300 ∼ 999人
Employees
完全週休2日制
Perfect weekly two days off
100 ∼ 299人
Employees
30 ∼ 99人
Employees
資料「就労条件総合調査」
Source :“General Survey on Working Conditions”
12
就 職
Employment
◇年次有給休暇の取得率は5割程度
Acquisition rate of paid annual leave is around 50%
年次有給休暇の取得状況の年次推移 −平成18∼24年−
Trends in acquisition situation of paid annual leave, 2006-2012
(%)
62
年次有給休暇付与日数 Number of days of paid annual leave granted
年次有給休暇取得日数 Number of days of paid annual leave acquired
取 得 率 Acquisition rate
17.7
17.6
17.9
18.0
17.9
58
18.3
18.3
56
0
8.3
平成18
2006
8.2
19
47.4
47.1
8.5
8.5
20
8.6
21
22
47.1
9.0
23
注1):調査期日は、翌年1月1日現在
2):「付与日数」には、繰越日数を含まない。
3):「取得率」は、全取得日数/全付与日数×100(%)である。
Note 1. The survey is conducted as of January 1st of the next year.
2.“Days granted”exclude carry-forwarded days from the year before.
3.“Acquisition rate”: Total days acquired / Total days granted x 100
Days granted
46.7
49.3
Days acquired
5
46.6
48.1
付与日数
10
52
50
取 得 率
54
15
Acquisition rate
20
60
取得日数
年次有給休暇付与日数・取得日数
Number of days of paid annual leave granted and acquired
(日)Day
25
48
46
44
8.6
42
24
2012(年)Year
40
資料「就労条件総合調査」
Source :“General Survey on Working Conditions”
◇パートを選んだ理由は「自分の都合の良い時間(日)に働きたいから」
The reason why people chose part-time employment was because they prefered to
work the hours (days) that suit themselves
パートを選んだ理由別パートの割合(複数回答)−平成23年−
Distribution of part-time employees, by reason for choosing part-time employment(multiple answers), 2011
自分の都合の良い時間(日)に働きたいから
55.8
To work the hours (days) that suit me
勤務時間・日数が短いから
35.2
Shorter working hours or working days
就業調整(年収の調整や労働時間の調整)ができるから
19.3
To manage work (adjust annual income or hours)
家庭の事情(育児・介護等)で正社員として働けないから
13.9
Family circumstances (child or long-term care etc.) does not allow
working as a regular worker
正社員としての募集が見つからなかったから
13.3
Unable to find any job offer for a regular worker
正社員として働くことが、体力的・精神的に難しいから
11.5
Difficult to work as a regular worker for phsical or mental reasons
やりたい仕事がたまたまパートだったから
10.0
The job I wanted to do happened to be a part-time employment
簡単な仕事で責任も少ないから
9.0
Simpler work with less responsibility was perferable
正社員として採用されなかったから
7.4
No company took me on as a regular worker
転勤がないから
5.9
To avoid job transfer
すぐ辞められるから
3.2
Can quit easily
その他
8.3
Others
資料「パートタイム労働者総合実態調査」
Source :“General Survey on Part-time Workers”
13
0
10
20
30
40
50
60
(%)
◇パートで仕事を続けたい男性は64.2%、女性は74.8%
64.2% of men and 74.8% of women want to continue working in a part-time job
今後の働き方の希望別パートの割合 −平成23年−
Distribution of part-time employees, by wish for future way of working, 2011
総数
22.0
Total
男
71.6
29.4
Male
女
64.2
18.8
Female
74.8
0
20
60
25.5
15∼19歳
80
38.7
41.8
25∼29歳
50.5
42.7
30∼34歳
50.4
34.7
35∼39歳
56.7
26.4
40∼44歳
65.8
19.9
45∼49歳
75.0
13.2
50∼54歳
82.8
5.4
55∼59歳
88.3
6.5
60∼64歳
100(%)
73.2
57.3
20∼24歳
65歳以上
Age 65 and over
40
87.3
89.3
1.2
0
20
40
60
80
100(%)
正社員になりたい
パートで仕事を続けたい
その他(自営業をしたい、正社員以外で正社員と同じくらいの時間働きたい等)
仕事をやめたい
Want to become a regular worker
Want to continue a part-time job
Others (Want to start a business or work for hours same with regular workers but in a part-time job etc.)
Want to quit working
資料「パートタイム労働者総合実態調査」
Source :“General Survey on Part-time Workers”
◇派遣労働者が就業している事業所の割合は10.8%、就業させる理由は
「欠員補充等必要な人員を迅速に確保できるため」
10.8% of establishments use dispatched workers and the reason for using them was
because they can smoothly secure necessary manpower for vacant posts etc.
派遣労働者の就業の有無別事業所割合 −平成24年−
Distribution of establishments, by using of dispatched workers, 2012
就業している
就業していない
10.8
89.2
Using
0
Not using
20
40
60
80
100(%)
派遣労働者を就業させる理由別事業所数の割合(複数回答3つまで)
(派遣労働者が就業している事業所計=100)
Distribution of establishments, by the reason for using dispatched workers (multiple answers up to 3)
(Establishments with dispatched workers = 100)
欠員補充等必要な人員を迅速に確保できるため
64.6
To smoothly secure necessary manpower for vacant posts etc.
一時的・季節的な業務量の変動に対処するため
36.7
To handle temporary or seasonal workload fluctuation
専門性を活かした人材を活用するため
34.2
To utilize their expertize
軽作業、補助的業務等を行うため
25.2
To deal with light or subsidiary tasks
雇用管理の負担が軽減されるため
14.9
常用労働者数を抑制するため
14.6
To reduce the burden of employment management
To hold down the number of regular workers
自社で養成できない労働力を確保するため
10.2
To secure workforce that is unable to train internally
勤務形態が常用労働者と異なる業務のため
4.7
To deal with task that require different type of work of regular workers
社内を活性化するため
3.3
To revitalize the company
その他
5.7
Others
0
資料「派遣労働者実態調査」
Source :“General Survey on Dispatched Workers”
10
20
30
40
50
60
70
(%)
14
就 職
Employment
◇短時間労働者の女性の賃金のピークは35 ~ 39歳で1,056円
A peak of wages of part-time females is 1,056 yen at 35-39 years old
短時間労働者の性・年齢階級別1時間当たり賃金(産業計、企業規模計) −平成24年−
Hourly wages for part-time workers by sex, and age group (Industries covered, total for all sizes of enterprise), 2012
(円)Yen
1,300
Hourly scheduled cash earnings
1,200
1,100
一時間当たり賃金
男
Male
1,000
900
800
女
Female
700
600
0
∼ 19
20 ∼ 24 25 ∼ 29 30 ∼ 34 35 ∼ 39 40 ∼ 44 45 ∼ 49 50 ∼ 54 55 ∼ 59 60 ∼ 64 65 ∼ 69
(歳)Years old
資料「賃金構造基本統計調査」
Source :“Basic Survey on Wage Structure”
◇メンタルヘルス不調により連続1か月以上休業又は退職した労働者が
いる事業所の割合は8.1%
Ratio of establishments where employees took leave from work for one continuous
month or more, or retired due to mental health disorders was 8.1%
メンタルヘルス不調により連続1ヶ月以上休業又は退職した労働者の状況(平成24年)
Situation of employees who took leave for one continuous month or more, or retired due to mental health disorders, 2012
メンタルヘルス不調により連続1か月以上休業又は退職した労働者の有無別事業所割合
Ratio of establishments with employees who took leave for one continuous month or more, or retired due to mental health reasons
いない
いる
At least one employee
0
20
40
60
8.1
メンタルヘルス不調により連続1か月以上
休業又は退職した労働者のいる事業所のうち
職場復帰した労働者の有無別事業所割合
No employees
(%)
100
80
91.9
55.0
44.5
Ratio of establishments with employees
that recovered to work after taking leave for
one continuous month or more or retiring
due to mental health disorders
いる
At least one employee
いない
No employees
資料「労働者健康状況調査」
Source :“Survey on State of Employees’Health”
15
◇労働組合推定組織率は17.7%
Estimated unionization rate is 17.7%
雇用者数、労働組合員数及び推定組織率の推移 −昭和22∼平成25年−
Trends in the number of employees, labour union members, and an estimated unionization rate, 1947−2013
(%)
60
4 500
雇用者数・労働組合員数
4 000
3 500
55
50
45
40
Estimated unionization rate
5 000
Number of employees
Estimated unionization rate
35
3 000
30
2 500
25
2 000
20
1 500
15
1 000
10
500
推定組織率
Number of employees, labour union members(Ten thousands)
労働組合員数
推定組織率(右目盛)
雇用者数
5 500
Number of labour union members
(万人)
6 000
5
0
昭和22
1947
・
30
'55
・
40
'65
・
50
'75
・
60
'85
・
平成7
'95
・
17
2005
・
0
25
'13
(年)Year
資料「労働組合基礎調査」
注:各年6月末現在
Note : As of June 30, each year
Source :“Basic Survey on Labour Unions”
◇結婚して同一就業を継続しているのは男81.1%、女51.8%
81.1% of male and 51.8% of female continue the same job before and after
marriage
性、この9年間の結婚の状況別にみた就業状況の変化 −平成23年−
Change of employment conditions by sex, conditions of marriage over the past nine years, 2011
1.6 1.2 0.6
結婚した
Married
81.1
7.3
2.9
男
Male
結婚していない
Not married
65.0
0
20
3.0
4.1
40
8.2
11.4
60
13.5
80
100
(%)
2.9
結婚した
Married
51.8
9.8
5.2 4.1
26.3
3.1 3.2
結婚していない
Not married
女
Female
同一就業継続
Continuation of the
same employment
69.6
0
転職
Change of job
20
新規就業
New employment
6.0
40
60
離職
Leave employment
8.7
80
無職継続
Continuation of
unemployment
9.5
100
(%)
不詳
Not stated
資料「第10回 21世紀成年者縦断調査」
Source : "The 10th Longitudinal Survey of Adults in the 21st Century"
注1):集計対象は、第1回独身で第10回まで回答を得られている者である。ただし、調査と調査の間に結婚し、かつ離婚した者を除く。
2):就業状況の変化は、「結婚した」は結婚前後の、「結婚していない」は第9回から第10回にかけての就業状況の変化である。
3):9年間で2回以上結婚している場合、最新の結婚の状況について計上している。
Note 1. The data are tabulated for respondents who were single at the time of the first survey and have answered to every survey till the 10th survey. However,
the data do not include those who married but divorced during the interval of the consecutive survey periods.
2. Change of employment conditions for "Married" means the change of employment condition before and after marriage and that for "Not married" means
the change from the 9th survey to the 10th survey.
3. If the person marries several times during the nine years, the latest marriage is taken into account.
16
結 婚
Marriages
◇結婚は47秒に1組
We have one newly-married couple in every 47 seconds
夫・妻の年齢階級別にみた婚姻件数の年次推移 −昭和22∼平成24年−
Trends in marriages by age group of bride and groom at marriage, 1947−2012
35歳∼ Years old and over
30 ∼ 34歳
前年以前に同居したもの
Cohabitation was done before
25 ∼ 29歳
the year of notification
20 ∼ 24歳
平成24年(2012)
∼ 19歳 Years old
668,869組(47秒に1組)
100
One newly-married couple
in every 47 seconds
夫
Groom
80
20
0
昭和22
1947
・
30
'55
・
40
'65
・
50
'75
・
60
'85
・
平成7
'95
・
17
2005
婚姻件数
各年に同居し届け出たもの
40
All Marriages
60
Cohabitation was done in the
same year of notification
婚 姻 件 数
Number of marriages (Ten thousands)
(万人)
120
・ 24
'12
(年)Year
100
前年以前に同居したもの
Cohabitation was done before
the year of notification
妻
Bride
80
20
0
昭和22
1947
・
30
'55
資料「人口動態統計」
Source :“Vital Statistics”
17
・
40
'65
・
50
'75
・
60
'85
・
平成7
'95
・
17
2005
・ 24
'12
(年)Year
婚姻件数
各年に同居し届け出たもの
40
All Marriages
60
Cohabitation was done in the
same year of notification
婚 姻 件 数
Number of marriages (Ten thousands)
(万人)
120
◇夫・妻ともに進む晩婚化
Mean age of first marriage are getting higher for both sexes
平均婚姻年齢の年次推移 −昭和22∼平成24年−
Trends in mean age of bride and groom at marriage,1947 ー 2012
(歳)Years old
45
再婚・夫
Remarriages・groom
40
平均婚姻年齢
Mean age at marriage
42.3歳
39.3歳
再婚・妻
Remarriages・bride
35
30.8歳
初婚・夫
First marriages・groom
30
25
29.2歳
初婚・妻
First marriages・bride
20
0
昭和22
1947
・
30
'55
・
40
'65
・
50
'75
・
60
'85
・
平成7
'95
・
17
2005
資料「人口動態統計」
Source :“Vital Statistics”
・ 24
'12
(年)Year
◇離婚は2分14秒に1組
We have one divorced couple in every 2 minutes 14 seconds
同居期間別にみた離婚件数の年次推移 −昭和22∼平成24年−
Trends in divorces by duration of cohabitation,1947 ー 2012
(万組)
30
平成24年(2012)
235,406組(2分14秒に1組)
離 婚 件 数
Number of divorces (Ten thousand couples)
同居期間 Duration of cohabitation
One divorced couple
in every 2 minutes 14 seconds
不 詳 Not stated
20年以上 Years and over
15 ∼ 20年 Years
10 ∼ 15年
5年以上10年未満
5年未満 Under 5 years
25
20
15
10
5
0
昭和22
1947
・
30
'55
資料「人口動態統計」
Source :“Vital Statistics”
・
40
'65
・
50
'75
・
60
'85
・
平成7
'95
・
17
2005
・ 24
'12
(年)Year
18
出産・育児
Childbirth・Child-rearing
◇父母の平均年齢は上昇
Mean age of both parents are rising
出生順位別にみた父母の平均年齢の年次推移 −昭和50∼平成24年−
Trends in mean age of father and mother by live birth order, 1975−2012
(歳)Years old
36
父 第3子
Father at 3rd child birth
35
34
34.0歳
父 第2子
Father at 2nd child birth
33
平 均 年 齢
32
Mean age
35.2歳
33.3歳
32.3歳
32.1歳
母 第3子
Mother at 3rd child birth
31
父 第1子
Father at 1st child birth
30
29
30.3歳
母 第2子
Mother at 2nd child birth
28
27
母 第1子
Mother at 1st child birth
26
25
0
昭和50
1975
・
60
'85
・
平成7
'95
・
17
2005
・
24
'12
(年)Year
資料「人口動態統計」
Source :“Vital Statistics”
◇第1子出生時に有職の母の割合は34.5%
Working mothers accounted for 34.5% of all mothers who gave birth to their first child
出生順位別にみた母の就業状態の年次比較 −平成17年度・平成22年度−
Comparison of employment status of mother by live birth order, - FY2005, FY2010 有職
無職
Employed
総 数
Total
第1子
1st childbirth
第2子以上
2nd childbirth
and over
平成17年度
23.6
FY2005
平成22年度
平成17年度
平成17年度
平成22年度
0
4.3
68.3
20
40
資料「平成22年度人口動態職業・産業別統計」
Source : "Report of Vital Statistics in FY 2010: Occupational and Industrial Aspects"
19
4.1
73.6
27.8
FY2010
4.6
61.4
22.1
FY2005
4.0
70.2
34.5
FY2010
4.4
65.0
25.2
FY2005
平成22年度
Not stated
72.0
31.0
FY2010
不詳
Non-employed
60
3.9
80
100
(%)
◇「勤め(常勤)」の母の育児休業の取得割合は93.5%
Working (permanent) mothers who take child care leave is 93.5%
母の育児休業の取得状況及び取得しない理由
Reasons for not taking child care leave amongst mothers
制度はあるが取得しない
取得済み・取得中・取得予定 3)
Have taken, am taking or will take leave
制度がない
System exists but did not take leave
平成22年
2010
制度があるかどうかわからない
No system
不詳
Don't know whether system exists
Not stated
1.8
93.5
出生児
0.8
3.6
0.4
Newborns
平成13年
2001
80.2
出生児
12.2
4.5 2.6 0.6
Newborns
20
0
40
60
80
100(%)
育児休業を取得しない理由「制度はあるが取得しない」4)=100
Reasons for not taking child care leave "System exists but did/will not take leave" = 100
職場の雰囲気や仕事の状況から
経済的なことから
Workplace environment or
work circumstances
平成22年
2010
Financial reasons
仕事に早く復帰したいから
35.9
出生児
夫が育児休業をとっているから
Would like to return to
work quickly
Husband is taking child
care leave
27.7
その他
不詳
Others
Not stated
0.3
16.4
18.8
0.9
Newborns
平成13年
2001
45.9
出生児
29.9
11.4
12.3
0.7
Newborns
20
0
40
60
80
100(%)
注1):第1回調査の回答を得た者(総数「平成22年出生児」38,554、「平成13年出生児」47,010)のうち、母と同居、母の出産半年後の就業状況「勤め(常勤)」の者(総数「平成
22年出生児」9,213、「平成13年出生児」7,251)をそれぞれ集計している。
2):育児休業の取得状況は、月齢6か月の調査対象児について調査したものである。
3):「取得済み・取得中・取得予定」は、
「すでに取得した」、「現在、育児休業中である」、
「これから取得する予定である」である。
4):育児休業を取得しない理由は、母の育児休業の取得状況「制度はあるが取得しない」の者(総数「平成22年出生児」329、「平成13年出生児」881)をそれぞれ100として集計
している。
Note 1. Tabulated figures are those with responses to the first survey (Total number: 38,554 for "2010 newborns" and 47,010 for "2001 newborns"), who is
living with a mother whose working status of 6 months after childbirth was "working (permanent)" (Total number: 9,213 for "2010 newborns" and 7,251
for "2001 newborns").
2. The usage of child care leave was asked in the survey to those with children aged 6 months.
3. "Have taken, am taking or will take leave" is "Have taken child care leave", "Currently taking child care leave", and "Will take child care leave".
4. The reason for not taking child care leave is tabulated by taking mothers who answered "System exists but did/will not take leave" (Total number: 329 for
"2010 newborns" and 881 for "2001 newborns") as 100.
資料「21世紀出生児縦断調査」
Source : "Longitudinal Survey of Newborns in the 21st Century"
◇「勤め(常勤)」の父の育児休業の取得割合は2.0%
Working (permanent) fathers who take child care leave is 2.0%
父の育児休業の取得状況及び取得しない理由
Reasons for not taking child care leave amongst fathers
制度はあるが取得しない
取得済み・取得中・取得予定 3)
Have taken, am taking or will take leave
System exists but did not take leave
2.0
平成22年
2010
45.2
出生児
Newborns
制度がない
制度があるかどうかわからない
No system
不詳
Don't know whether system exists
20.5
Not stated
21.8
10.4
0.7
平成13年
2001
31.4
出生児
24.9
23.8
19.2
Newborns
20
0
40
60
80
100(%)
育児休業を取得しない理由「制度はあるが取得しない」 =100
4)
Reasons for not taking child care leave "System exists but did/will not take leave" = 100
職場の雰囲気や仕事の状況から
経済的なことから
Workplace environment or
work circumstances
Financial reasons
平成22年
2010
仕事を続けたいから
49.0
出生児
妻が育児休業をとっているから
Would like to continue
working
その他
Wife is taking child
care leave
14.5
3.4
不詳
Others
20.6
Not stated
11.4
1.1
Newborns
平成13年
2001
37.0
出生児
11.6
4.2
20.0
25.2
1.8
Newborns
0
20
40
60
80
100(%)
注1):第1回調査の回答を得た者(総数「平成22年出生児」38,554 、「平成13年出生児」47,010 )のうち、父と同居、父の出産半年後の就業状況「勤め(常勤)」の者(総数「平
成22年出生児」31,784、「平成13年出生児」38,192)をそれぞれ集計している。
2):育児休業の取得状況は、月齢6か月の調査対象児について調査したものである。
3):「取得済み・取得中・取得予定」は、
「すでに取得した」、「現在、育児休業中である」、
「これから取得する予定である」である。
4):育児休業を取得しない理由は、父の育児休業の取得状況「制度はあるが取得しない」の者(総数「平成22年出生児」14,373、「平成13年出生児」11,978)をそれぞれ100と
して集計している。
Note 1. Tabulated figures are those with responses to the first survey (Total number: 38,554 for "2010 newborns" and 47,010 for "2001 newborns"), who is
living with a father whose working status of 6 months after childbirth was "working (permanent)" (Total number: 31,784 for "2010 newborns" and 38,192
for "2001 newborns").
2. The usage of child care leave was asked in the survey to those with children aged 6 months.
3. "Have taken, am taking or will take leave" is "Have taken child care leave", "Currently taking child care leave", and "Will take child care leave".
4. The reason for not taking child care leave is tabulated by taking fathers who answered "System exists but did/will not take leave" (Total number: 14,373
for "2010 newborns" and 11,978 for "2001 newborns") as 100.
資料「21世紀出生児縦断調査」
Source : "Longitudinal Survey of Newborns in the 21st Century"
20
日々のくらし
Life
◇男の約8割、女の約4割は正規の職員、従業員
About 80% of men and 40% of women are regular employees and staffs
性・年齢階級別にみた15歳以上の役員以外の雇用者の構成割合 −平成24年−
Percent distribution of employees, other than company executives, aged 15 years and over by sex and age group, 2012
男
女
Male
非正規の職員・従業員
Non-regular employee, staff
Female
正規の職員・従業員
Regular employee, staff
22.5
77.5
68.4
31.6
40.9
59.1
20.5
9.3
91.3
40 ∼ 44歳
9.1
90.9
89.4
85.9
57.5
42.5
72.7
100
(%)
80
60
53.1
40
20
0
37.6
54.4
45.6
46.5
53.5
39.0
61.0
45 ∼ 49歳
39.7
60.3
50 ∼ 54歳
39.7
60.3
55 ∼ 59歳
35.8
65歳以上
65 years
and over
64.2
19.3
60 ∼ 64歳
27.3
46.9
62.4
35 ∼ 39歳
8.7
14.1
58.3
76.9
30 ∼ 34歳
90.7
10.6
41.7
25 ∼ 29歳
86.8
非正規の職員・従業員
Non-regular employee, staff
23.1
20 ∼ 24歳
79.5
13.2
正規の職員・従業員
Regular employee, staff
役員以外の雇用者
Employee other
than company
executives
15 ∼ 19歳
80.7
13.6
86.4
0
20
注1):福島県を除いたものである。
2):「勤め先での呼称不詳」の者を含まない。
Note 1. Figures were calculated by excluding Fukushima Prefecture.
2. Those whose "called title at workplace is unknown" are excluded.
40
60
80
100
(%)
資料「国民生活基礎調査」
Source :“Comprehensive Survey of Living Conditions”
◇悩みやストレスがある者の割合は男女ともに40~49歳が最も高い
The age group having the highest share of people with worry or stress is 40-49
years old for both men and women
性・年齢階級別にみた悩みやストレスがある者の割合(12歳以上)−平成22年−
The share of people who have worry or stress by sex and age group (12 years and over), 2010
42.4
総数
Total
35.7
12 ∼ 19歳
女
Female
44.8
43.5
20 ∼ 29歳
55.7
48.8
30 ∼ 39歳
59.6
51.2
40 ∼ 49歳
47.0
50 ∼ 59歳
35.2
60 ∼ 69歳
33.8
(再掲)
65歳以上
0
注:入院者は含まない。
Note : Hospitalized persons are excluded.
10
20
30
42.1
40.0
35.8
75歳以上
(Regrouped)
Years and over
53.5
40.0
37.0
80歳以上
60.6
40.9
33.3
70 ∼ 79歳
21
男
Male
50.3
40
41.6
50
60
70
(%)
資料「国民生活基礎調査」
Source :“Comprehensive Survey of Living Conditions”
◇男は約7割、女は約6割について健診や人間ドックを受診している
About 70% of men and 60% of women receive health checkups or thorough medical
checkups
性・年齢階級別にみた健診や人間ドックを受けた者の割合(20歳以上)−平成22年−
The share of people who had health checkups or thorough medical checkups by sex and age group (20 years and over), 2010
(%)
80
78.0
69.4
59.7
男
Male
66.3
65.2
64.9
60
76.8
73.5
女
Female
66.3
60.9
59.6
59.1 58.7
54.1
50.7
46.4
40
20
0
総数
Total
20 ∼ 29歳
30 ∼ 39歳
40 ∼ 49歳
50 ∼ 59歳
60 ∼ 69歳
70 ∼ 79歳
80歳以上
80 years
and over
資料「国民生活基礎調査」
Source :“Comprehensive Survey of Living Conditions”
注:入院者は含まない。
Note : Hospitalized persons are excluded.
◇世帯の約6割は生活が苦しい(「大変苦しい」「やや苦しい」)
About 60% of households feel their living condition is difficult “
( very difficult”and
“somewhat difficult”)
生活意識別にみた世帯数の構成割合 −平成24年−
Percent distribution of households by self-assessed living conditions, 2012
大変ゆとりがある
苦しい(60.4)
Difficult
大変苦しい
Very difficult
全世帯
やや苦しい
Somewhat difficult
28.6
All households
普 通
Normal
31.8
Very comfortable
ややゆとりがある
Somewhat comfortable
35.8
(54.0)
高齢者世帯
25.2
Aged households
2.8
28.8
42.7
0.5
(65.3)
児童のいる世帯
Households with
children
2.8
31.3
0
34.0
20
注:福島県を除いたものである。
Note : Figures were calculated by excluding Fukushima Prefecture.
3.5 0.4
40
31.6
60
80
0.2
100
(%)
資料「国民生活基礎調査」
Source :“Comprehensive Survey of Living Conditions”
22
病気になったら
Medical care
◇全国の病院・診療所は約10万9千施設、歯科診療所は約6万8千施設
The number of hospitals and medical clinics is about 109,000 and the number of
dental clinics is about 68,000
医療施設の種類別にみた施設数の年次推移 −昭和62∼平成24年−
Trends in the number of medical institutions by type of institution, 1987-2012
(施設)Institutions
100 000
90 000
90,556
一般診療所
Medical clinics
80 000
Number of institutions
100,152
無床一般診療所(再掲)
Medical clinics without beds (Regrouped)
施 設 数
70 000
68,474
60 000
歯科診療所
Dental clinics
50 000
40 000
療養病床を有する病院(再掲)
Hospitals with long-term care beds (Regrouped)
有床一般診療所(再掲)
Medical clinics with beds (Regrouped)
30 000
20 000
療養病床を有する一般診療所(再掲)
Medical clinics with long-term care beds (Regrouped)
9,596
8,565
7,493
3,892
1,306
病院
Hospitals
10 000
一般病院(再掲)
General hospitals (Regrouped)
0
昭和62
1987
平成2
'90
5
'93
8
'96
11
'99
14
2002
17
'05
20
'08
24
'12
(年)Year
注;各年10月1日現在である。
Note:As of October 1st, each year.
資料「医療施設調査」
Source :“Survey of Medical Institutions”
◇全国の医療施設に従事する医師数(人口10万対)は219.0人
The total number of physicians practicing in medical institutions (hospitals or clinics)
per 100,000 population is 219.0
都道府県(従業地)別にみた医療施設に従事する人口10万対医師数 −平成22年12月31日−
Number of physicians practicing in medical institutions (hospitals or clinics) per 100,000 population by prefecture −December 31, 2010−
(人)
350
男(177.6人)
Male
300
女(41.4人)
Female
全 国
The whole country
219.0人
250
200
150
100
50
Okinawa
Kagoshima
Oita
Miyazaki
Kumamoto
Saga
Nagasaki
Kochi
Fukuoka
Ehime
Kagawa
Tokushima
Yamaguchi
Okayama
Hiroshima
Tottori
Shimane
Nara
Wakayama
Hyogo
Kyoto
Osaka
Mie
Shiga
Aichi
Gifu
Shizuoka
Nagano
Fukui
Yamanashi
Ishikawa
Niigata
Toyama
Kanagawa
Chiba
Tokyo
Gunma
Saitama
ibaraki
Tochigi
Fukushima
Akita
Yamagata
Iwate
Miyagi
Aomori
Hokkaido
沖 縄
鹿児島
宮 崎
大 分
熊 本
長 崎
佐 賀
福 岡
高 知
愛 媛
香 川
徳 島
山 口
広 島
岡 山
島 根
鳥 取
和歌山
奈 良
兵 庫
大 阪
京 都
滋 賀
三 重
愛 知
静 岡
岐 阜
長 野
23
山 梨
資料「医師・歯科医師・薬剤師調査」
Source :“Survey of Physicians, Dentists and Pharmacists”
福 井
石 川
富 山
新 潟
神奈川
東 京
千 葉
埼 玉
群 馬
栃 木
茨 城
福 島
山 形
秋 田
宮 城
岩 手
青 森
北海道
0
◇全国の受療率(人口10万対)は、入院1,068、外来5,784
The rates of estimated patients (per 100,000 population, per day) is 1,068 for
inpatients and 5,784 for outpatients
都道府県(患者住所地)別にみた受療率(平成23年10月の調査日1日)
The rates of estimated patients by prefecture (address of patient) (surveyed one day in October, 2011)
入院受療率(人口10万対)
The rates of estimated inpatients (per 100,000 population, per day)
2 500
2 000
全 国
The whole country
1,068
1 500
1 000
Okinawa
Kagoshima
Oita
Miyazaki
Kumamoto
Nagasaki
Kochi
Fukuoka
Ehime
Kagawa
Tokushima
Yamaguchi
Okayama
Hiroshima
Tottori
Shimane
Nara
Wakayama
Hyogo
Kyoto
Osaka
Mie
Shiga
Aichi
Gifu
Shizuoka
Nagano
Fukui
Yamanashi
Ishikawa
Niigata
Toyama
Kanagawa
沖 縄
Chiba
鹿児島
Tokyo
沖 縄
宮 崎
Gunma
鹿児島
大 分
Saitama
宮 崎
熊 本
ibaraki
大 分
長 崎
Tochigi
熊 本
佐 賀
Fukushima
長 崎
福 岡
Akita
佐 賀
高 知
Yamagata
福 岡
愛 媛
Iwate
高 知
香 川
Miyagi
愛 媛
徳 島
Aomori
香 川
Hokkaido
徳 島
山 口
広 島
岡 山
島 根
鳥 取
和歌山
奈 良
兵 庫
大 阪
京 都
滋 賀
三 重
愛 知
静 岡
岐 阜
長 野
山 梨
福 井
石 川
富 山
新 潟
神奈川
東 京
千 葉
埼 玉
群 馬
栃 木
茨 城
福 島
山 形
秋 田
宮 城
岩 手
青 森
北海道
0
Saga
500
外来受療率(人口10万対)
The rates of estimated outpatients (per 100,000 population, per day)
Okinawa
Kagoshima
Miyazaki
Oita
Kumamoto
Saga
Nagasaki
Fukuoka
Kochi
Ehime
Kagawa
Yamaguchi
Okayama
Hiroshima
Tottori
Shimane
Wakayama
Nara
Hyogo
Kyoto
Osaka
Shiga
Mie
Aichi
Shizuoka
Gifu
Nagano
Yamanashi
Fukui
Ishikawa
Toyama
Niigata
Kanagawa
Chiba
Tokyo
Gunma
Saitama
Tochigi
ibaraki
Fukushima
Akita
Yamagata
Miyagi
Iwate
Aomori
Hokkaido
山 口
広 島
岡 山
島 根
鳥 取
和歌山
奈 良
兵 庫
大 阪
京 都
滋 賀
三 重
愛 知
静 岡
岐 阜
長 野
山 梨
福 井
石 川
富 山
新 潟
神奈川
東 京
千 葉
埼 玉
群 馬
栃 木
茨 城
福 島
山 形
秋 田
宮 城
岩 手
青 森
Tokushima
全 国
The whole country
5,784
北海道
8 000
7 000
6 000
5 000
4 000
3 000
2 000
1 000
0
資料「患者調査」
Source :“Patient Survey”
◇人口 一人当たり国民医療費は約29万2千円
The annual medical care expenditure per capita is about 292,000 yen
人口一人当たり国民医療費の年次推移 −昭和29∼平成22年度−
人口一人当たり国民医療費
National medical care expenditure per capita (Thousand yen)
Trends in national medical care expenditure per capita, 1954 fiscal year− 2010 fiscal year
(千円)
300
250
214.7
226.1 229.2
242.3 237.5 244.3 242.9
233.9
247.1 251.5
259.3 259.3
267.2 272.6
282.4
292.2
200
150
132.3
100
57.9
50
2.4
0
昭和29
1954
2.7
30
'55
11.4
40
'65
50
'75
60 平成7
'85
'95
8
9
10
11
12
2000
13
14
15
16
17
18
19
22
20
21
'10
(年度)Fiscal year
資料「国民医療費」
Source :“Estimates of National Medical Care Expenditure”
24
退 職
Retirement
◇一律定年制を定めている企業の9割強に、定年後の措置あり
More than 90% of enterprises which have fixed retirement age system have systems after retirement
定年制を定めている企業の割合及び一律定年制を定めている企業における
定年年齢別、定年後の措置別企業の割合(産業計) −平成25年−
Ratio of enterprises with retirement age system, and ratio of enterprises by age of retirement and
systems after retirement among enterprises with fixed retirement age system (industries covered), 2013
定年制を定めている企業割合
Ratio of enterprises with retirement age system
定年制を定めている
Enterprises with retirement age system
93.3%
定年制を定めている企業における制度の定め方
一律定年制を定めている企業における定年年齢
The method to determine the retirement age system
その他
Others
Retirement age in fixed retirement age system
定年制を定めている企業=100
一律定年制を定めている企業=100
Enterprises with retirement age system
Enterprises with fixed retirement age system
0.4%
60歳
83.0%
61 ∼ 64歳
3.0%
一律に定めている
Fixed retirement age system
98.4%
職種別に定めている
Retirement age system
per type of occupation
66歳以上
1.2%
65歳
12.5%
66 years old and over
1.5%
一律定年制を定めている企業における定年後の措置
Enterprises with systems after retirement
in fixed retirement age system
100%
一律定年制を定めている企業=100
Enterprises with fixed retirement age system
勤務延長制度のみあり
80
Employment extended system only
9.0%
原則として希望者
All those who want in principle
46.0%
再雇用制度のみあり
60
基準に適合する者全員
Re-hiring system only
All those who meet
the company standards
73.9%
40
51.7%
その他
20
Others
2.2%
両制度併用
Adoption of both systems
10.0%
原則として希望者
基準に適合する者全員
44.2%
54.6%
All those who want
in principle
0
20
0
その他
All those who meet the
company standards
40
60
80
Others
1.3%
100%
再雇用制度ありの企業=100
Enterprises with re-hiring system
25
勤務延長制度ありの企業=100
Enterprises with employment extended system
適用対象者の範囲
Scope of application candidate
資料「就労条件総合調査」
Source :“General Survey on Working Conditions”
◇退職給付は、月給の約35 ~ 38 ヶ月分
Retirement benefit equals to about 35-38 month of salary
学歴別定年退職給付額(企業規模計) −平成25年−
Average amount of retirement benefit by educational attainment (Total of all sizes of enterprise), 2013
(万円)
定年退職給付額
Average amount of retirement benefit (10,000 yen)
3000
2500
2000
1,941
1500
1,673
(37.6月分)
(39.7月分)
1000
1,128
(35.0月分)
500
0
大学卒
(管理・事務・技術職)
College or university
(Non-production worker)
高校卒
(管理・事務・技術職)
高校卒
(現業職)
Upper secondary school
(Non-production worker)
Upper secondary school
(Production worker)
注:「退職給付額」とは、退職一時金額と年金原価額の計である。なお、厚生年金基金の場合、厚生年金基金の代行部分を除く上乗せ給付(プラス・アルファ部分)
のみの額である。
Note: Total of the lump-sum payment and the present value of the retirement pension.
In addition, in case of the Employees' Pension Fund, it means only the topping-up benefit (additional portion) excluding the
substitutional benefit paid by the Employees' Pension Fund.
資料「就労条件総合調査」
Source :“General Survey on Working Conditions”
◇退職給付制度のある企業は、全体の約8割
About 80% of enterprises have retirement benefit system
退職給付(一時金・年金)制度のある企業数割合 −平成25年−
Ratio of enterprises have retirement benefit (lump sum or pension) system, 2013
(%)
100
93.6
89.4
82.0
80
75.5
72.0
60
40
20
0
企業規模計
Total for all sizes
of enterprise
1,000人以上
Employees and over
300 ∼ 999人
Employees
100 ∼ 299人
Employees
30 ∼ 99人
Employees
資料「就労条件総合調査」
Source :“General Survey on Working Conditions”
26
老 後
Old age
◇単独世帯、夫婦のみの世帯の者の割合が上昇傾向
The share of one-person households and households of a couple only are increasing
家族形態別にみた65歳以上の者の構成割合の年次推移
Trends in the percent distribution of people aged 65 and over by type of family
非親族と同居
Living with unrelatives
その他の親族と同居
Living with other relatives
子と同居
Living with children
単独世帯
One-person household
昭和61年
10.1
平成元年
11.2
4年
11.7
7年
12.6
10年
13.2
13年
13.8
16年
14.7
19年
15.7
22年
16.9
23年
夫婦のみの世帯
Household of a couple only
22.0
25.5
27.6
29.4
17.6
17.7
3.1 0.2
38.7
18.4
3.4 0.3
31.2
33.8
27.4
36.0
19.6
37.2
20
17.5
37.2
16.6
37.5
16.0
40
18.9
3.5 0.2
19.1
4.0 0.2
21.0
23.6
36.7
3.2 0.3
42.2
35.5
32.3
16.1
0
配偶者のいない子と同居
Living with unmarried children
46.7
16.8
24年
子夫婦と同居
Living with child's couple
3.6 0.2
24.0
3.8 0.2
24.8
25.6
26.4
60
3.8 0.2
21.9
80
注1):平成7年の数値は、兵庫県を除いたものである。
2):平成23年の数値は、岩手県、宮城県及び福島県を除いたものである。
3):平成24年の数値は、福島県を除いたものである。
Note 1. Figures of 1995 were calculated by excluding Hyogo Prefecture.
2. Figures of 2011 were calculated by excluding Iwate Prefecture, Miyagi Prefecture and Fukushima Prefecture
3. Figures of 2012 were calculated by excluding Fukushima Prefecture
資料「国民生活基礎調査」
Source : "Comprehensive Survey of Living Conditions"
3.6 0.1
3.7 0.1
3.9 0.2
100
(%)
◇65歳以上の同居の主な介護者が65歳以上の要介護者等を介護する割
合は約46%
About 46% of the main carer living with a cared person aged 65 years and over is
65 years old and over
年齢別にみた同居の主な介護者と要介護者等の割合の年次推移
Trends in the age profile of the cared person and the main carer living with him/her
(%)
70
60
58.1
47.6
40.6
45.9
19.6
平成13年
(2001)
平成16年
(2004)
65歳以上同士
Both 65 years old and over
24.9
18.7
60歳以上同士
Both 60 years old and over
41.1
30
20
62.7
54.4
50
40
58.9
25.5
75歳以上同士
Both 75 years old and over
10
0
平成19年
(2007)
平成22年
(2010)
資料「国民生活基礎調査」
Source :“Comprehensive Survey of Living Conditions”
27
◇高齢者世帯の平均所得金額は約300万円
The average income of an aged household is about 3 million yen
1世帯当たり平均所得金額の年次推移 −昭和60 ∼平成23年−
1世帯当たり平均所得金額
Average income per houshold (Ten thousand yen)
Trends in the average income per household, 1985−2011
(万円)
800
平成8年
(1996)
781.6
700
600
児童のいる世帯
Households with children
697.0
539.8
平成6年
(1994)
664.2
500
493.3
400
548.2
全世帯
平成10年
(1998)
335.5
All households
303.6
300
200
高齢者世帯
Aged households
210.6
100
0
昭和60
1985
平成2
'90
7
'95
12
2000
17
'05
23
'11
(年)Year
注1):平成6年の数値は、兵庫県を除いたものである。
2):平成22年の数値は、岩手県、宮城県及び福島県を除いたものである。
3):平成23年の数値は、福島県を除いたものである。
Note 1. Figures of 1994 were calculated by excluding Hyogo Prefecture.
2. Figures of 2010 were calculated by excluding Iwate Prefecture, Miyagi Prefecture and Fukushima Prefecture.
3. Figures of 2011 were calculated by excluding Fukushima Prefecture.
資料「国民生活基礎調査」
Source : "Comprehensive Survey of Living Conditions"
◇訪問入浴介護、訪問看護ステーションの利用者では「要介護5」が最も多い
The largest user of Home-visit bathing service and Home-visit nursing are“care level 5”
要介護度別利用者数の構成割合(介護サービス) −平成23年9月−
Distribution of number of users by level of long-term care (for LTC service), September 2011
要介護1
Care level 1
要介護2
Care level 2
要介護3
Care level 3
要介護4
Care level 4
要介護5
Care level 5
その他
Others
0.6
訪問介護
29.4
Home-visit care
29.2
16.8
12.6
11.3
2.0
訪問入浴介護
1.1
6.9
Home-visit bathing service
11.8
25.5
52.6
1.0
訪問看護ステーション
15.8
Home-visit nursing
22.1
17.4
18.7
24.9
0.3
通所介護
32.3
Day care service
30.5
19.0
11.4
6.4
0.2
通所リハビリテーション
28.9
Commuting rehabilitation service
32.7
20.2
12.1
6.0
0.5
特定施設入居者生活介護
25.0
Long-term care for
residents of specified facilities
22.0
18.9
18.9
14.7
0.6
居宅介護支援事業所
30.4
Establishments for in-home
long-term care
0
30.2
20
40
18.3
60
12.1
80
8.4
100
(%)
注:1)「その他」は要介護認定申請中等である。
2)訪問看護ステーションは、健康保険法等のみによる利用者を含まない。
3)特定施設入居者生活介護は9月末日の利用者である。
Note 1.“Others”refers to persons who have applied for certification of the“require long-term care”status, etc.
2.“Home-visit nursing ”do not include recipients based only on the Health Insurance Act, etc.
3. Figures for“long-term care for residents of specified facilities”are recipients on the last day of September.
資料「介護サービス施設・事業所調査」
Source :“Survey of Institutions and Establishments for Long-term Care”
28
死 亡
Deaths
◇死亡は25秒に1人
We have one death in every 25 seconds
死亡数及び死亡率の年次推移 −明治32∼平成24年−
Trends in deaths and death rates,1899−2012
インフルエンザ
Influenza
大正7 ∼ 9年(1918−1920)
65 ∼ 79
東日本大震災
The Great East Japan earthquake
平成23年(2011)
15 ∼ 64
0 ∼ 14歳
Years
死亡率
Death rate
120
25
阪神・淡路大震災
Great Hanshin/
Awaji earthquake
平成7年(1995)
20
最低の死亡数
Lowest number of death
昭和41年(1966)
最低の死亡率
67万人
Lowest death rate
昭和54年(1979)
100
80
30
15
60
10
昭和54年
6.0
40
平成24年
10.0
死亡率︵人口千対︶
死 亡 数
Number of deaths (Ten thousands)
80 ∼
関東大震災
Great Kanto earthquake
大正12年(1923)
140
平成24年(2012)
1,256,359人
(25秒に1人)
One death in every 25 seconds
死亡数
Number of deaths
Death rate (per 1,000 population)
(万人)
160
5
20
0
明治32
1899
・
43
1910
・
大正9
'20
・
昭和5
'30
・
注:点線は数値なし
Note : Dotted line means no data.
15
'40
25
'50
・
35
'60
・
45
'70
・
55
'80
・
平成2
'90
・
資料「人口動態統計」
Source :“Vital Statistics”
12
2000
・
0
24
'12
(年)Year
◇「がん」が死因のトップ
Cancer is the leading cause of death
主な死因別にみた死亡率の年次推移 −昭和22∼平成24年−
Trends in death rates for leading causes of death, 1947−2012
死亡率︵人口 万対︶
Death rate (per 100,000 population)
300
10
286.6 がん Cancers
250
200
157.9 心臓病 Heart diseases
150
98.4 肺炎 Pneumonia
96.5 脳卒中
Cerebrovascular diseases
100
50
48.2 老衰 Senility
0
昭和22
1947
・
30
'55
・
資料「人口動態統計」
Source :“Vital Statistics”
29
40
'65
・
50
'75
・
60
'85
・
平成7
'95
・
17
2005
32.6 不慮の事故 Accidents
21.0 自殺 Suicide
12.7 肝疾患 Diseases of liver
1.7 結核 Tuberculosis
・ 24
'12
(年)Year
◇平均寿命は、男は長野県松川村、女は沖縄県北中城村がトップ
Matsukawa village (in Nagano Prefecture) is the highest in the life expectancy at birth
for male, Kitanakagusuku village(in Okinawa Prefecture) for female
市区町村別平均寿命の分布 −平成22年−
Distribution of life expectancies at birth by municipality, 2010
800
最高:長野県松川村 82.2年
(Highest)
(years)
最低:大阪府大阪市西成区 72.4年
(years)
(Lowest)
市区町村数
Number of municipalities
600
(参考)
全国 All Japan
79.6年(years)
413
0
488
0
0
0
0
2
2
14
42
女
Female
356
200
130
72
58
55
(参考)
全国 All Japan
86.4年(years)
253
151
127
0
538
281
200
1
600
400
268
0
最高:沖縄県北中城村 89.0年
(Highest)
(years)
最低:大阪府大阪市西成区 83.8年
(years)
(Lowest)
461
男
Male
400
800
19
37
4
0
72.0 72.5 73.0 73.5 74.0 74.5 75.0 75.5 76.0 76.5 77.0 77.5 78.0 78.5 79.0 79.5 80.0 80.5 81.0 81.5 82.0 年以上
∼ 72.5 ∼ 73.0 ∼ 73.5 ∼ 74.0 ∼ 74.5 ∼ 75.0 ∼ 75.5 ∼ 76.0 ∼ 76.5 ∼ 77.0 ∼ 77.5 ∼ 78.0 ∼ 78.5 ∼ 79.0 ∼ 79.5 ∼ 80.0 ∼ 80.5 ∼ 81.0 ∼ 81.5 ∼ 82.0 ∼ 82.5 年未満
2
16
5
1
83.5 84.0 84.5 85.0 85.5 86.0 86.5 87.0 87.5 88.0 88.5 年以上
∼ 84.0 ∼ 84.5 ∼ 85.0 ∼ 85.5 ∼ 86.0 ∼ 86.5 ∼ 87.0 ∼ 87.5 ∼ 88.0 ∼ 88.5 ∼ 89.0 年未満
平均寿命
Life expectancy at birth
平均寿命
Life expectancy at birth
資料「市区町村別生命表」
Source :“Municipal life tables”
◇日本人の平均寿命、男79.94年、女86.41年
Life expectancy at birth in Japanese for male is 79.94 years, for female is 86.41 years
各国の平均寿命の年次推移 −1965∼ 2012年−
Trends in life expectancies at birth in selected countries, 1965−2012
(年)Years
87
日本
Japan
平 均 寿 命
Life expectancy at birth
85
80
女
Female
カナダ
Canada
フランス
France
イタリア
Italy
アイスランド
Iceland
スイス
Swiss
イギリス
United Kingdom
アメリカ合衆国
U.S.A
ドイツ
Germany
75
カナダ
Canada
アメリカ合衆国
U.S.A
日本
Japan
スイス
Swiss
イタリア
Italy
アイスランド
Iceland
70
ドイツ
Germany
イギリス
United Kingdom
フランス
France
65
昭和40
1965
45
'70
50
'75
男
Male
55
'80
60
'85
平成2
'90
7
'95
12
2000
17
'05
22 24
'10 '12
(年)Year
注)1990年以前のドイツは、旧西ドイツの数値である。
Note : The figure of Germany until 1990 is that of former West Germany.
資料「完全生命表」、「簡易生命表」
諸外国は、UN「Demographic Yearbook」等
Source :“Complete Life Tables”,“Abridged Life Tables”in Japan
Other foreign countries are UN“Demographic Yearbook”etc
30
厚生労働省大臣官房統計情報部
が 実 施 し て い る 調 査 名
調査
区分
調査周期
基幹
毎月
5年
出生、死亡、死産、婚姻及び離婚の状況について、性・年齢・
地域別等に把握
人口動態・保健社会統計課
出生、死亡、死産、婚姻及び離婚の人口動態事象と職業
及び産業との関連を把握
完全生命表
簡易生命表
基幹
5年
毎年
ある期間における死亡状況が今後変化しないと仮定した
ときに、各年齢の者が1年以内に死亡する確率や平均し
てあと何年生きられるかという期待値などを死亡率や平
均余命などの指標によって表したもの
人口動態・保健社会統計課
医療施設調査
基幹
毎月,3年
全国の病院・一般診療所・歯科診療所の分布及び診療機
能の実態等について把握
人口動態・保健社会統計課
保健統計室
患者調査
基幹
3年
調査日に医療機関で診療を受けた患者数、傷病名及び診
療費の支払方法等について把握
人口動態・保健社会統計課
保健統計室
受療行動調査
一般
3年
医療施設を利用する患者の受療の状況、受けた医療に対
する満足度及び医療に対する認識や行動について把握
人口動態・保健社会統計課
保健統計室
病院報告
一般
毎月,毎年
全国の病院、療養病床を有する診療所における患者の利
用状況及び病院の従事者の状況を把握
人口動態・保健社会統計課
保健統計室
衛生行政報告例
一般
毎年,隔年
各都道府県・指定都市・中核市における健康政策・保健
医療・生活衛生・薬事・母体保護関係等の行政実績を把
握
人口動態・保健社会統計課
地域保健・健康増進事業報告
一般
毎年
地域住民の健康の保持及び増進を目的とした保健事業の
実績を実施主体毎に把握
人口動態・保健社会統計課
医師・歯科医師・薬剤師調査
一般
隔年
全国の医師・歯科医師・薬剤師の就業の状況や分布等を
把握
人口動態・保健社会統計課
保健統計室
国民医療費
一般
毎年
医療機関等における傷病の治療に要する費用を推計
人口動態・保健社会統計課
保健統計室
社会福祉施設等調査
一般
毎年
全国の社会福祉施設等の数、在所者及び従事者等につい
て把握
人口動態・保健社会統計課
社会統計室
介護サービス施設・事業所調査
一般
毎年
介護保険施設及び居宅サービス事業所等について、介護
サービスの提供体制、提供内容等を把握
人口動態・保健社会統計課
社会統計室
福祉行政報告例
一般
毎月,毎年
各都道府県・指定都市・中核市における身体障害者福祉・
人口動態・保健社会統計課
老人福祉・児童福祉等の行政実績を把握
人口動態調査
担当課室
社会医療診療行為別調査
一般
毎年
全国健康保険協会管掌健康保険、組合管掌健康保険、共
済組合等の保険、国民健康保険及び後期高齢者医療制度
人口動態・保健社会統計課
の診療報酬明細書及び調剤報酬明細書を調査対象とし、
社会統計室
診療行為の内容、傷病の状況、調剤行為の内容及び薬剤
の使用状況等について把握
介護給付費実態調査
一般
毎月
介護サービスの受給にかかる給付費の状況を把握
21世紀出生児縦断調査
一般
毎年
21世紀初年に生まれた子及び2010年に生まれた子の成 人口動態・保健社会統計課
長・発達の過程を長期にわたって継続的に把握
世帯統計室
21世紀成年者縦断調査
一般
(国民の生活に関する継続調査)
毎年
平成14年10月末現在で20 ∼ 34歳、平成24年10月末
現在で20 ∼ 29歳の全国の男女及びその配偶者につい 人口動態・保健社会統計課
て、結婚、出産、就業等の実態及び意識の経年変化の状 世帯統計室
況を継続的に把握
中高年者縦断調査
一般
(中高年者の生活に関する継続調査)
毎年
団塊の世代を含む全国の50 ∼ 59歳(平成17年10月末
人口動態・保健社会統計課
現在)の男女の健康、就業、社会活動について意識面・
世帯統計室
事実面の変化の過程を継続的に把握
毎年
保健、医療、福祉、年金、所得等国民生活の基礎的な事
項について、世帯面から総合的に把握
国民生活基礎調査
31
調 査 内 容
基幹
人口動態・保健社会統計課
社会統計室
人口動態・保健社会統計課
世帯統計室
厚生労働省大臣官房統計情報部
が 実 施 し て い る 調 査 名
調査
区分
調査周期
毎月勤労統計調査
基幹
毎月,毎年
常用労働者を5人以上雇用する事業所については毎月、
1∼4人雇用する事業所については毎年7月における常 雇用・賃金福祉統計課
用労働者数、給与、労働時間等を把握
労働経済動向調査
一般
毎四半期
景気の変動、労働力需給の変化等が、雇用、労働時間、
賃金等に及ぼしている影響や、今後の見通し、対応策等 雇用・賃金福祉統計課
について把握
雇用の構造に関する実態調査
一般
毎年
雇用の構造に関する実態について毎年テーマを変えて実
施
平成24年「派遣労働者実態調査」
雇用・賃金福祉統計課
雇用動向調査
一般
半期
事業所における入職・離職の状況等を調査し、雇用労働
力の産業、規模、職業及び地域間の移動等を把握
雇用・賃金福祉統計課
労使関係総合調査
一般
毎年
労働組合数、組合員数等の状況を把握する労働組合基礎
調査と毎年テーマを変えて行う実態調査を実施
雇用・賃金福祉統計課
労働争議統計調査
一般
毎年
労働争議の状況等を把握
雇用・賃金福祉統計課
賃金構造基本統計調査
基幹
毎年
主要産業に雇用される労働者について、その賃金の実態
を雇用形態、就業形態、職種、性、年齢、学歴、勤続年
数別等に把握
雇用・賃金福祉統計課
賃金福祉統計室
賃金の引上げ等の実態に関する
調査
一般
毎年
企業における賃金の改定額、賃金の改定率、賃金の改定
方法、賃金の改定の構造を明らかにするとともに、同改
定に係る交渉等の実態等を把握
雇用・賃金福祉統計課
賃金福祉統計室
就労条件総合調査
一般
毎年
主要産業における企業の賃金制度、労働時間制度、労働
費用、福祉施設・制度、退職給付制度及び定年制等につ
いて総合的に把握
雇用・賃金福祉統計課
賃金福祉統計室
労働災害動向調査
一般
毎年
主要産業における労働災害について、年間の発生状況を
事業所規模・災害程度別に把握
雇用・賃金福祉統計課
賃金福祉統計室
労働安全衛生に関する調査
一般
毎年
労働安全衛生について、毎年テーマを変えて実施
平成24年「労働者健康状況調査」
雇用・賃金福祉統計課
賃金福祉統計室
調 査 内 容
担当課室
e-Stat 政府統計の総合窓口
厚生労働省ホームページよりアクセス出来ま
す。ディスプレイ上での閲覧だけでなく、ダウン
ロードも可能です。
公表後に刊行されます。
(速報・概況などの簡易な印刷物は、公表と同時
に刊行されます。)
厚生労働省図書館及び統計情報部企画課普及相
談室で閲覧及びコピーが可能です。
e-Statホームページアドレス
http://www.e-stat.go.jp/SG1/estat/eStatTopPortal.do
入手は、(財)厚生労働統計協会や政府刊行物セ
ンターで出来ます。
厚生労働省ホームページアドレス
http://www. mhlw. go. jp
32
List of statistical surveys
Major statistical surveys implemented by Statistics and Information Department
Health and Welfare Statistics
Title
Vital Statistics
Frequency
Fundamental
Statistical Survey
Monthly
Fundamental
Statistical Survey
Every 5 years
Survey of Medical
Institutions
Fundamental
Statistical Survey
Monthly
Patient Survey
Fundamental
Statistical Survey
Patient's Behavior Survey
Data Contents
Responsible Division
Five vital events: births, deaths, foetal deaths, marriages and
divorces by sex, age and region
Relation between the vital events of births, deaths, foetal deaths,
marriages and divorces, by occupation and industry
Vital,Health and Social
Statistics Division
The probability of dying within one year or the expected number of
years of life remaining at each age etc. under an assumption that
the mortality profile of a certain period will not change for the
future, expressed in indicators such as mortality rates, life
expectancies etc.
Vital,Health and Social
Statistics Division
Situations of medical institutions ( hospitals, medical clinics and
dental clinics) by regional distribution and treatment function, etc.
Health Statistics Office,
Vital,Health and Social
Statistics Division
Every 3 years
Regarding patients who consulted physicians or dentists in
medical institutions ( hospital, medical clinics, dental clinics ) on
the survey day: estimated number of patients, the actual situation
of injuries/diseases and type of health insurance, etc.
Health Statistics Office,
Vital,Health and Social
Statistics Division
General
Statistical Survey
Every 3 years
Patient's behavior/awareness which used hospital services on the
survey day. Satisfaction level of hospital care etc.
Health Statistics Office,
Vital,Health and Social
Statistics Division
Hospital Report
General
Statistical Survey
Monthly, Annual
Situation of utilization of hospitals or clinics with long-term care
beds and health workforce working at hospitals.
Health Statistics Office,
Vital,Health and Social
Statistics Division
Report on Public Health
Administration and Services
General
Statistical Survey
Annual,
Fact-findings of public health services(Health and medical services, Vital,Health and Social
environmental hygiene, pharmaceutical practice, maternal
Statistics Division
protection,etc.) by prefecture, designated city and core city.
Report on Regional Public
Health Services and Health
Promotion Services
General
Statistical Survey
Annual
Fact-findings of services for maintenance and improvement of
health for regional residents by municipalities
Vital,Health and Social
Statistics Division
Survey of Physicians,
Dentists and Pharmacists
General
Statistical Survey
Every 2 years
Working situation and distribution of physicians, dentists and
pharmacists
Health Statistics Office,
Vital,Health and Social
Statistics Division
Estimates of National
Medical Care Expenditure
General
Statistical Survey
Annual
Estimated national medical care expenditure due to medical
treatment for diseases or injuries in hospitals or clinics
Health Statistics Office,
Vital,Health and Social
Statistics Division
Survey of Social Welfare
Institutions
General
Statistical Survey
Annual
Data on social welfare institutions nationwide: the number of
facilities, residents and workforce/caregivers, etc.
Social Statistics Office,
Vital,Health and Social
Statistics Division
Survey of Institutions and
Establishments for
Long-term Care
General
Statistical Survey
Annual
Systems to provide long-term care services and the type of
services provided are surveyed for institutions covered by
long-term care insurance and establishments providing
home-based services etc.
Social Statistics Office,
Vital,Health and Social
Statistics Division
Report on Social Welfare
Administration and Services
General
Statistical Survey
Monthly, Annual
Fact-findings of social welfare administration services(welfare for
persons with pyhsical disability, welfare for elderly, child welfare
etc.) by prefecture, designated city and core city.
Vital,Health and Social
Statistics Division
Survey of Medical Care
Activities in Public Health
Insurance
General
Statistical Survey
Annual
Social Statistics Office,
Data on medical care activities, situation of diseases, dispensing
Vital,Health and Social
and utilization of medicines, etc.
Sources are medical fee bills or pharmaceutical fee bills of National Statistics Division
Health Insurance Association managed health insurance, Society
managed health insurance, Mutual aid associations etc., National
health insurance, and Medical care system for elderly in the latter
stage of life.
Survey of Long-term Care
Benefit Expenditures
General
Statistical Survey
Monthly
Benefit expenditure and number of recipients who receive long-term Social Statistics Office,
Vital,Health and Social
care services
Statistics Division
Longitudinal Survey of
Newborns in the 21st
Century
General
Statistical Survey
Annual
Continuous observations of the process of children's growth and
development.
The survey scope: Babies who were born in the first year of the
21st century and in 2010.
Household Statistics
Office,
Vital, Health and Social
Statistics Division
Longitudinal Survey of
Adults in the 21st Century
General
Statistical Survey
Annual
Continuous observations of the change in marital status,
childbirth, employment, etc. and subjects' mind.
The survey scope: Men and women and their spouses of age 20 to
34 as of the end of October 2002, and age 20 to 29 as of the end
of October 2012.
Household Statistics
Office,
Vital, Health and Social
Statistics Division
Longitudinal Survey of
Middle-aged and Elderly
Persons
General
Statistical Survey
Annual
Continuous observations of the subjects' mind and situation on
health status, employment, social activities, etc.
The survey scope: Men and women of age 50 to 59 as of the end
of October 2005 which includes the baby-boomer generation.
Household Statistics
Office,
Vital, Health and Social
Statistics Division
Comprehensive Survey of
Living Conditions
Fundamental
Statistical Survey
Annual
Fundamental data of living conditions (Health status, health care
utilization, welfare, pension, income etc.)
Household Statistics
Office,
Vital, Health and Social
Statistics Division
・Complete Life Tables
・Abridged Life Tables
33
Type of
Statistical Survey
Every 5 years
Annual
Every 3 years
Every 2 years
Labour Statistics
Title
Monthly Labour Survey
Type of
Statistical Survey
Fundamental
Statistical Survey
Frequency
Monthly
Annual
Data Contents
Changes in employment, earnings and hours worked of regular
employees working in establishments.
・Monthly (establishments with 5 or more regular employees)
・July in every year (establishments with 1-4 regular employees)
Responsible Division
Employment, Wage and
Labour Welfare
Statistics Division
Survey on Labour Economy
Trend
General
Statistical Survey
Quarterly
Influences on employment, working hours and wages caused by
business fluctuations and changes in labour supply and demand,
future prospects and countermeasures.
Employment, Wage and
Labour Welfare
Statistics Division
Surveys on Employment
Structure
General
Statistical Survey
Annual
Regarding the actual situation of employment structure, the survey
has conducted on a different subject every year.
・General Survey on Dispatched Workers (2012)
Employment, Wage and
Labour Welfare
Statistics Division
Survey on Employment
Trends
General
Statistical Survey
Half yearly
Characteristics of hired or separated employees and conditions
related to accession or separation at establishments in principal
industries, information on mobility of the labour force.
Employment, Wage and
Labour Welfare
Statistics Division
General Survey on Labour
Relations
General
Statistical Survey
Annual
Basic information on labour unions (number of labour unions,
number of labour union members etc.)
This survey consists of "Basic Survey on Labour Unions" and
"Status Survey on Labour Unions". The latter is carried out
different subject every year .
Employment, Wage and
Labour Welfare
Statistics Division
Survey on Labour Disputes
General
Statistical Survey
Annual
Labour disputes : number of labour disputes, workers involved
and days not worked, etc.
Employment, Wage and
Labour Welfare
Statistics Division
Basic Survey on Wage
Structure
Fundamental
Statistical Survey
Annual
The wage structure of employees in major industries i.e., wage
distribution by type of employment, type of work, occupation, sex,
age, educational attainment, length of service and occupational
career, etc.
Wage and Labour
Welfare Statistics
Office,
Employment, Wage and
Labour Welfare
Statistics Division
Survey on Wage Increase
General
Statistical Survey
Annual
The structure of wage increases, in private enterprises including
the amount of wage increase, the rate of wage increase, the
circumstances of wage increase, and to clarify the structure of
wage increases, also to identify the fact-findings of the
negotiation for wage increases.
Wage and Labour
Welfare Statistics
Office,
Employment, Wage and
Labour Welfare
Statistics Division
General Survey on Working
Conditions
General
Statistical Survey
Annual
Comprehensive information on wage systems, working hour
systems, labour costs, welfare facilities and systems, retirement
allowance systems, and compulsory retirement systems of
enterprises in major industries.
Wage and Labour
Welfare Statistics
Office,
Employment, Wage and
Labour Welfare
Statistics Division
Survey on Industrial
Accidents
General
Statistical Survey
Annual
Trends in the occurrence of industrial accidents annually in the
principal industries, and to show final yearly figures by size of
establishment and degree of injury.
Wage and Labour
Welfare Statistics
Office,
Employment, Wage and
Labour Welfare
Statistics Division
Special Survey on Industrial
Safety and Health
General
Statistical Survey
Annual
The survey has conducted about industrial safety and health on a
different subject every year.
In 2012: "Survey on State of Employees’Health"
Wage and Labour
Welfare Statistics
Office,
Employment, Wage and
Labour Welfare
Statistics Division
34
外 務 省
← 虎ノ門
経済産業省
農林水産省
人事院
← 西新橋
飯野ビル
厚生労働省
中央合同庁舎5号館
桜田門 →
裁 判 所
合同庁舎
弁護士会館
千代田線霞ヶ関駅
出口C1
← 国会議事堂
財 務 省
丸の内線霞ヶ関駅出口B3
祝田橋 →
日比谷公園
この「厚生労働統計のあらまし」は厚生労働省ホームページに掲載しています。
アドレス
http://www.mhlw.go.jp/toukei/youran/index-kourou.html
http://www.mhlw.go.jp/english/database/db-oh/index.html
○ 本冊子は、グリーン購入法(国等による環境物品等の調達の推進等に関する法律)に基づく基本方
針の判断の基準を満たす紙を使用しています。
○ リサイクル適性の表示:紙へリサイクル可
本冊子は、グリーン購入法に基づく基本方針における「印刷」に係る判断の基準にしたがい、印刷
用の紙へのリサイクルに適した材料[Aランク]のみを用いて作製しています。
© Copyright 2026 Paperzz