Estimation
of Sea Surface Temperature
Using Infrared Image Data of
Geostationary Meteorological Satellite(GMS)
Akihiro Uchiyama*,
Hiroshi Fujimura**
and Toshiro Yogai***
Abstract
A new method to correct infrared Image data of GMS
obtained by the new method are shown in this report.
In the current operational system
is described and the test results
of Japan Meteorological Satellite Center (JMSC),
an
atmospheric correction for infrared image data of GMS is performed on the basis of an
empirical formula and climate precipitable water amount.
In a new method, the results
of objective analysis for numerical
prediction is used as a vertical profile of temperature
and water vapor, and a value of atmospheric correction is calculated by the method of
solving a radiative transfer equation. We applied this method to four cases and estimated
sea surface temperature (SST).
The
results shows
that new
method
tends
to cause
systematic
error over
a
wide
range of areas and it is found that the error of clear or cloud free radiance observed by
a satelliteand that of atmospheric correction are amplified and cause a large error in the
estimated SST.
This feature is inherent and suggests that it is very difficultto estimate
SST from only one infrared channel.
In order to estimate SST
with the accuracy less than 0.5 K, both
the clear radiance
and the amount
of atmospheric correction should be determined with the accuracy less
than 0.1 K. Furthermore, in order to remove the atmospheric effect by the own measurement, it is to be desired that radiances should be measured in a number of wave number
recrion.
1.
Introduction
For
the
area and in a
purpose
on climate
and
long-term
riety of projects
planed.
The
sea surface
of better
are
temperature
for monthly
mean
data
can
* Japan
** Japan
Meteorological
ence
**
and
Japan
analysis
over
a va-
SST
out and
image
is 0.2 to 0.5 K
a meteoro-
range
Division
Satellite Center
Satellite
Technology
Meteorological
affiliation :
operationally derived
Center
data is often utilized
mean
Sci-
has
SST
for ten
days, since April in 1978.
The
order of
error is about 1.5 to 2.5 K.
In the current
operational system, the amount
of atmos-
pheric correction is calculated on the basis
Agency).
Satellite
data is superior to the other instru-
for retrieving SST.
of
System
(Present
Espe-
Japan Meteorological SatelliteCenter
Satellite Center
The
utilized to estimate
of these advantages.
ment, infrared image
homogeneous
a wide
because
been
cially,since the space resolution of infrared
to measure
Since
short period of time.
satellitedata has
Division.
Meteorological
Operations
(SST)
launched,
be obtained
Engineering
carried
accuracy
value.
logical satellite was
prediction,
being
required
understanding
of an
Neph-
empirical formula
and
cipitable water vapor amount
Division.
43
-
climatic pre(Inoue, 1979).
METEOROLOGICAL
We
have
the
developed
a new
atmospheric
infrared
effect
image
data
tional method
one.
SATELLITE
The
major
temperature
placed
by
the
every
calculated
ative
by
by
opera-
vapor
which
of atmospheric
the method
of solving
equation.
Thirdly,
are extracted
from
prepared
over
by
data
between
is
every
a radi-
(b)
free
the histogram
the
method
to
correct
described
atmospheric
The
test results show
not
from
GMS
section
necessarily
infrared
angle,
new
effect and
and
on
method
of the
current
derived
empirical
In
data
data.
4, the causes of errors
the
are discussed
2.
Method
of SST
When
we
radiance
of atmosphere
or cloud
by
retrieve
observed
must
Infrared
column
which
from
from
by
a clear
is not affected
cloud.
This
process
need
to correct the atmospheric
effect,
a vertical profile of atmosphere.
is impossible
to infer
structure
of atmosphere
infrared
window
the other
source
structure
of
an
accurate
from
channel.
of data
atmosphere.
the
We
to give
In
It
only
one
depend
on
of
data
satellite
of
zenith
amount,
temperature
the
operation
determined
of
the
from
the
neglected
on
to linearize
its coefficients have
of SST
water
been
method
observation
from
and
amount
method,
correction
is
the
pendent
on not only
the amount
not
the
observed
is de-
the atmospheric
verti-
the
schematic
SST
ber of SST
(TSi,
the vertical
radiances
the
i―\, ■■■
, N)
directly
correction
but also
The
of atmos-
calculated
atmospheric
sea surface
view
is shown
i=U
or brightness
tem-
of a principle
in Fig. 1.
a vertical profile of atmosphere
-
is
theoretically (Inoue, 1979).
because
to estimate
44
Water
coefficients
were
precipitable
perature.
current
which
brightness
has been
cal structure
vertical
correction
the radiosonde.
pheric
correction '.
to calcu-
formula
system,
and
In the new
vertical profile
In order
we
from
be removed
is called ' atmospheric
(a)
SST
method
by the least squares
the truth
by the satellite, the effect
free radiance,
the radiance
determined
estimation
level,
in 1982, the dependence
TBB
the equation
400 mb
longitude.
cosine
formula
observed
in detail.
vapor.
temperature
level and relative
the beginning
November
the
analysis
water
and
precipitable
set calculated
Since
area
In
as a verti-
of atmospheric
observed
that the new
5"
correction
a
improve
image
10 mb
surface
a column
At
SST
and
atmospheric
and
amount
an
used.
is used
on the empirical
(TBB).
by the new
been
operational
method.
the test results obtained
does
the
5° latitudex
of observation
predication
current
late
values,
the result of objective
atmospheric
dependent
we
has
2.5° latitudeX2.5°
tude.
report,
range
between
is base
this
a
surface
The
climate
every
contains
humidity
data in the box of 0.25° latitude X 0.25° longi-
In
1987
monthly
GMS,
method,
This
given
cloud
are
MARCH
cal profile of temperature
Second-
correction
which
for numerical
is re-
are
system,
new
analysis
longitude.
No.15
operational
covered
are changed.
water
NOTE
longitude
the new
of objective
predication,
transfer
radiances
the current
and
2.5° Iatitudex2.5°
ly, the amount
observed
vertical profile of atmos-
result
for numerical
the
points
TECHNICAL
to remove
be replaced
Frstly, the climatic
pheric
from
and
will
three
method
CENTER
and
Given
a num-
・■■
, N), the observed
temperature
are precalculated
and
(TBBi,
a look-up
Mil^M-fev*-
Observed
&WM^
&15#
1987^3^
Tbb
Tbbi
/IT&
DQ
CD
・u
>
0)
U)
Water
vapor
o
Tsi
Surface Temperature
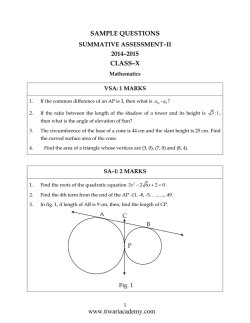
Fig, 1
The
schematic
view
Ts
Surface Temperature
of a principle to estimate SST.
Given
a vertical profileand a num-
ber of SST (TSi, i = l, ・・・, N), the observed TBB°i (* = 1, ― , N) are calculated. Using a lookup table inversely, SST is estimated from the clear Tbb observed by the satellite. Note that
the amount of atmospheric
the surface temperature.
table of the observed
the given
TSi (i-l,
TBB°i (/―1, ・・・ , AO
■・■
, AO is
TBb
to be observed
with
the increase
of SST.
table inversely,
SST
up
the clear TBB
correction is dependent
monotonously
observed
is
by
radiative
transfer
scheme
radiative
transfer
scheme
of
the
I(v)=B(T,. v)-t(Zs,v)
from
where
to calculate
T
in the range
of 11 /am at-
window
is developed
on the basis
altitude Z,
Weinreb
indicate
method
developed
by
transmittance
and
neglect
B(J(Z),^?^-dZ
v) is Planck's
and
wave
the
local
of
of a plane-parallel
thermodynamic
scattering
at-
tively.
equilibrium
process,
the up-
ment,
45
-
at tem-
v, t(Z,
the satellite and
is
and
In order to apply
it must
function
subscript
that a quantity
to a spectral interval
(1)
number
between
and
at the earth's surface
the assumption
mosphere,
and
B(T,
perature
Hill (1980).
On
CZst
+
radiance
mospheric
v
equation,
the satellite.
The
number
can be calculatednumerically by following
this look-
estimated
profile but also
welling radiance Iiy) at wave
for
This
increases
Using
(c)
infrared
made.
on not only the atmospheric
' s ' and
to be
the
' st'
evaluated
a satellite, respecthe above
of a broad-band
be convoluted
v) is
with
equation
instru-
the spectral
METEOROLOGICAL
SATELLITE
CENTER
TECHNICAL
response function 0(v) of the interval. The
radiance I(v) that would
be measured
NOTE
Nal5
MARCH
1987
(4)
ln(-ln(r,))= ECMXi
in
where
any of these intervals is then given by
t5 is transmittance
rectangular
f
averaged
over
the
subinterval,
<f>{v)-I{v)dv
/(v)=
X<=\,
(2)
J dv
Weinreb
and
*,=ln(P/1000),
Hill divided
the
interval into subintervals
rectangular
radiance
mean
response
I(v) is
of each
Xz=0.1-\n(U-T/273),
full spectral
(30 cm"1)
function.
approximated
subinterval
with
the
weighted
radiance
Xz=X2'Xa,
Xz―X2'Xit
Xi=Xz
,
Xz―X^'Xt,
X9=Xs-
X4)
XiO=X2m
Xii'=iXi-X6,
Xi2=Xt
,
X13―Xs-X6,
the
Then,
by
X4=ln(T/273),
X-j,
/(v,),
and
/M="12^^-
Xu―X3-Xt,
U:
(3)
water
vapor
amount
P : total pressure
where
$v. is height
function,
and
of original
of rectangular
<j>H-Avi is equal
response
function
T:
response
to the area
in
each
These
sub-
subinterval,
the atmosphere
is
the transmittances
of
scaled
amount
treated
as a product
of
sary.
We
of
atmospheric
Water
continuum
vapor
dominate
region.
This
of Weinreb
method
of
each
of
the
and
mixing
need
the
which
representation
Smith
(1969).
expression
and Hill choose
The
in each
layer
method
the
is neces-
and solve eq.
to X2.
vapor
formula
of
continuum,
Roberts
the fol-
et al. (1976)
is
(5)
C£D=Cl(T=296)exp(T0(y
transmit-
-
1
))
296
C°v=a+bexp(-p-v)
Hill
To=1800K
a^l^SxlO-^mole^cm'atm-1
layers, in
6=2.34xl0-18mole-1cm2atm-1
temperature
This
JS=8.30xl0-3cm
method
Ph2o '・water
homogeneous
a polynomial
to that suggested
following
and
K{T)^Cv{T){PH2o+r<P-Pnzo))
the atmosphere
for
760 cm"1
for calculating
and
and Neuendorffer
pressure,
in
used;
in this
and
of U
calculated
between
use Newton
the water
lowing
carbon
lines
Weinreb
treats
similar
vapor
gases"
absorption
ratio are constant.
Weinreb
For
are
procedure
(4) with respect
region,
principally
homogeneous
transmittance
ab-
are water
calculating
lines,
as a succession
11 fim
spectral
the
For
of spectral
used the method
path.
the
mixed
et al., 1972),
dioxide.
(1973).
In
" uniformly
(McClatchy
spectral
the
interval
The
transmittance
constituents
the
tances
the
constituents.
the absorbing
and
30 cm"1
1000 cm"1.
In each
sorbing
coefficients d{v})
every
interval.
temperature
where
by
v
is
Hill neglected
polynomial
but
is used,
we
The
46
vapor
wave
the
pressure
number.
second
do not neglect
uniformly-mixed
Weinreb
term
and
of eq. (5),
this term.
gases
comprise
CO2,
SUfeffiM-fev*-
N20,
CO, CH4,
and
O2.
in the 11 /um window.
culating
C02
absorbs
The
method
transmittances
LOWTRAN
(Selby
is
&15#
The infrared image data observed by GMS-3
of cal-
at 00Z,
to Weinreb
method
and
probably
Hill, the error
less
than
clear radiance
The
other
point
to extract
a
current operational
is extracted
of
method
new
from
histogram
data
longitude
histogram
procedure,
In the
data
analysis.
it is extracted
in the area
Rm:
number
the
SD:
Test
The
results
sea surface
ten days
in 1985
of
SST
in January,
are estimated
D:
110°E and 180°E on the northern
level in that peak to the
difference between
Tth :
estimation
the
of element
of elements in that peak,
value and mode
maximum
count
one in that peak,
threshold value for a
estimated see
surface temperature.
of the first
We
April, July and October
in
of total
standard deviation of elements in that
of 0.25° latitude
temperatures
of element
peak,
the
xO.25° longitude.
3.
by using the
that peak to the number
in the mode
In the
from
in the part of the
the ratio of the number
in the
by
first
elements,
clear radiance
the histogram
the histogram
the ratio of the number
is a pro-
clear radiance.
procedure,
1° latitudexl°
of the
changed
The
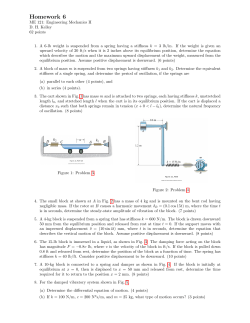
following parameters (see Fig. 2),
1 mW
in
to be
18Z are used.
higher temperature is checked
R:
(d)
area
and
data in the area of 0.25°x0.25°. The
et
/(cm^sr-cm"1).
cedure
12Z
peak of the histogram
According
their
06Z,
clear TBB is extracted from
from
Kneizys
al., 1980).
of
1987\3E
weakly
taken
et al., 1978,
8ffiS£
area
adopt
where
between
T' is a calculated TBB
sumption
hemisphere.
T'―2, as the threshold value,
that the surface
on the as
temperature
i;
equal to the atmospheric temperature at the
^
lowest level. If R is greater than or equa
SD 1
to 50 percents, Rm
is greater than or equa
to 40 percents, SD
is less than or equal t(
2, D is less than 3, and SST
mean
estimated fron
TBB of the first peak
of the highe:
o
c
temperature
<D
we regard the firstpeak of the higher tern
D
cr
part is greater than Tth,
perature part as the cloud free peak
QJ
histogram.
In short, we
and high histogram
Count
Value
H
method
peak in the higher tem
is not a
operational one
but
Thi
tfo
basic idea of the operational one is simila
Fig. 2 Parameters for checking the peak
of the histogram in the part of the higher
We
of th<
select the sharj
perature part as the cloud free data.
D
temperature.
thei
to this one.
select a sharp and high
Since the vertical profileis given on
peak in the part of the higher tempera-
grid point every 2.5°x2.5°,the amount
ture as a cloud free data.
47
-
th<
o
METEOROLOGICAL
SATELLITE
CENTER
TECHNICAL
NOTE
No.15MARCH
1987
(a)
50N
40N
30N
20N
ION
ON
1 1
OE
120E
130E
140E
150E
160E
SEA
SURFACE
TEMP.
1985.1.1-10
(b)
48 -
170E
I80E
5CiM£M-fev*-
gffiH-g
^15#
1987^ 3 j!
(c)
50N
30N
20N
ION
ON
1 1
OE
120E
I40E
130E
ERROR
150E
1985.1.1-10
170E
160E
I80E
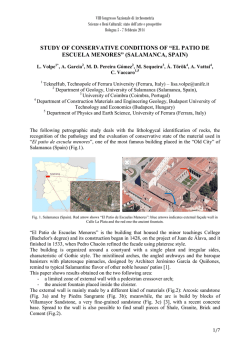
Fig, 3 (a) The sea surface temperature of the firstten days of January in 1985 estimated from
GMS-3 data, (b) The Ten-Day Marine Report produbed by Japan MeteorologicalAgency on the
basis of ship measurements mainly, (c) Differencebetween (a) and (b) ((a)-(b)). The regions
where differencesare greater than 2 K appear over the wide range of areas.
atmospheric
correction in the box is inter-
polated from
of box.
The
continuum
are calculated using ^=0.005.
temperature
the sea sur-
Ten-Day
Marine
Report
Japan Meteorological Agency,
on
mainly
between
ship data, and
produced
Fig. 3 (c).
The
by
are greater than 2.0 K
of area.
differences are negative
a
during the same
period, the negative errors
latitude appear in the cloudy
In
one as Fig. 3
except
this case, the tendencies of
error are similar to that in January.
SST
could not be estimated in the latitude zone
higher than 40°N.
differences
is a tendency
Fig. 3 (c) with photographs
Fig. 4 is the same
features in
appear over
There
zone. Comparing
for April.
the differences
are some
Marine
and middle latitude appear in the clear areas.
which is based
regions where
the Ten-Day
in the region of the higher latitude
areas, and the positive errors in the lower
data,
the former SST and the latter SST,
respectively. There
range
GMS-3
are less than
in the lower
of the first ten days of
January in 1985 estimated from
the
Report
transmittances of water vapor
Fig. 3 (a), (b), and (c) show
face
SSTs
the data of the four corners
Fig. 5 is the same
wide
for June.
that
SST
one
as
cloud not be
Fig. 3 except
estimated in
the latitude zone higher than 40°N. In this
or the estimated
case, the negative errors appear almost all
49
-
METEOROLOGICAL
SATELLITE
CENTER
TECHNICAL
NOTE
Nal5 MARCH
1987 ・
(a)
50N
/
40N
-SV,
"-・v
.;
30N
^+
15
1i
20N
30
^-\
ION
w
A
<;
ON
OE
1 1
120E
130E
I40E
150E
160E
SURFACE
TEMP.
1985.4.1-10
SEA
170E
180E
(b)
i.
v
\
iv
THE TEN-DA^ MARINE RETORT
Jn- H-U
!<■■
≪
i-.
/-Pj' '44 //M'
it<l
lm,
. i'-
■\
ffl
lr-v,N
<A)
'
A\
fc-o'
n*&
^
^
;p
c\
/"L/│^V/^A/^Vu0'
\tf
Qt
'*7\
'. * -
:
Yim
!<7
v_
^
\
7
:
rK
i
\
\iXNJ.
H
\r\
i
u
/
L\
\
_y//
*->,,
\y
h
l^x
)'■ '
^y^
y^--
h
4/
!>r-
\
W
, , ,
/'
■v
r
\
0
GELr?
w#imh*j
i?
/!AU
w.
\ Vl\:
M'1,
U1^
k ^
!
k^
\fM/i
V
■U
') / -NlJ
>>
r^./\ /
v ■■^-y-n.
u
<&>y^
ii^Tio.*-
T"
ymTrrim^
i\.
!
iff
'
Kv^n
t, ! r>^
v^d^rz:
t
l1^'!/
rr,
AK
va^^^?f>^
y>n<^r^
\,
_t-
)^
.
.jwYbr&iDr^
virs^-v
mrj
≪v
"≪v.\\\'
p /n
^■ Hh jy;/jite&.r
i
^^'
i sr
■t
/
<r^-^>/f
nk
/
.17
■■,/"
^.'
-krrj
>^^
-^
'/TV
1
-,' IN
^i
―
/
;
/
U-rV
>
V
"I
■
/
. /
^r
, y
r\;
:
i.-l
r-
i
^
_^.^
XJ
^-^L^-ttt
,*1A
w
t/9*
/
_
S>*f
V
>
ix-
l/l^v\
.</
f- ' ・
■\.
i/JS
'
/hr-">/
v_≪NV
<
■ ■
\ ■ i/TN
!
J'
■ ■
S
\
!
!
Kes―
!
.
,
,
r\
v
: ; \^r
i\ V
1
:/T
\
/
rs
- i
I
,/,
'-'
,
I
'V li
w
X
/
,a
\/r\\
U°
, /
i
,
\
^
\
^l
fJ^U^
/
S*/
u^
■> - .
■ :
^
)/
_l-l_
,-S\ \ l / l
\
r^-^%^
i\J
rr\
'^J
―:
■ '
■i i
I
IV
i/
is
^
\,<..*-k
\
\
r
I
u
:
>r>^
^JVTNN-^-^'
v\J '
^n >*. ■ :/ f'&Z
I
■
h**K
^v
,/T
・ TN
y\.
,
■/:
f
! ^
^v
i .
>-ixj r^
Jl
・"
r
rSr=―:-^}
r
i
・> , : v
'
i/D
^J
.>・-
I
;
I I
.
-vt-
i
―
(
.).
■i : ;
'―-j-*i7Ss^
■sw-KS^Vi/:
'^_i-K_:
\J
■■5^
^(iC^-s
r^Y
j-jszm
av.
'
s-rr>^S^=^
\y\\\h
. _>?K_^'■
is?
ry,
!
/UrvTV
-#^'^> ixrwi
j≫js^m
/
n1 *.;" c_
Y&r
■ u^T^^sCTTfe-^
^―-OO/yDr
―
)
^
A
/' 'L/
v^.J^J^C
RET
TM7
^.xj/vi/ti
\
JrS#>
rx
^\^^Li
sr-
\
*
C ・ r\i7
P^S―
・-■/"V-.
^3s
V
jfXJuft
JSH
!_
nfT^sc^
)),^yi.
X
・
.
x
V
\
i>-7^,
50
i\
-
i
・;i
y
1
K
^.
'
I
(c)
50N
40N
30N
20N
ION
ON
110E
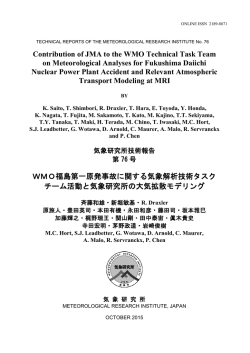
Fijj. 4
120E
130E
ERROR
As in fig. 3, except for April.
140E
1 50E
1985.4.1-10
Tendencies
160E
170E
180E
of difference are similar to those in January.
(a)
50N
40N
30N
20N
ION
ON
11OE
120E .
SEA
130E
HOE
15OE
160E
SURFACE
TEMP.
1985.7.1-10
51
-
1TOE
180E
METEOROLOGICAL
SATELLITE
CENTER
TECHNICAL
NOTE
Nal5 MARCH
1987
(b)
(c)
20N
ION
ON
1 10E
Fig. 5
from
120E
130E
ERROR
150E
140E
160E
170t
180E
1985.7.1-10
As in fig. 3, except for July. The negative differences, which means that SST estimated
GMS-3
data is lower than that of the Ten-Day Marine Report, appear almost all over areas.
52
気象衛星センター 技術報告 第15号 1987年3月
(a)
50N
40N
30N
20N
10N
OH
170E
1 2-OE
10E
130E 140E t50E 160E
SEA
SURFACE
TEMP. 1985.10.
180E
1 -10
(b)
1 1j μ 1゛ ・’.
IJ ・ │『
気象庁全国海況旬報 N o
TIU.
l4u4
TF\-I≪\ M A K I N ' R K E T O R T J . ● 。 s
?
7 「
,い/
`に ヤ ̄
Sfl・・,s岬,。/細・。。
`ヽ八N゛
`ヽぶ、。,
"T{r-
. ソ宍ぺ・ ド\J:ヅ
でmグユi±K wKimiHiこ'7゛''''''''(!.2ルレr。7毘
号泣訟 説漏⊇
7nT ̄ぺTバり
'一石,,や つ畑に 応渦3啄冷汐ヽぐニベ|び刊/や叫
●・・Z10
kぶ6「
1,「
|' ●
■中
> ●
尿石良くニ
バら気づyi ダ ̄rミ⊆7/双 ̄言μ?Sr ̄jま泌妙案
●ir − 皿
・p・
?5「7・るS
) /7TぺI
ダ/≒バ )│
゛・J≦どよ
け
言と 回 巡言 席殷
行員㈹贈二三
ノ
,ここに
`7少ヽヽノつ
/-`ツン
ル七
ミ
・ Ht
i 
上州辻でヽモベ靫づ孫子四六を宍丿匹匹∩天ご
£
言けづ艦ヅド千珊完⊇歿;匹堅惑匹_ 七乳 士宍言言作頷
示癩呉指示席
一7/ k/,。・
ぐ万考不平聊ゲニ祥≒づこ心44
|● ●Ji4
7
・o/.^
−一乙-φザ徊wk〃
’い=こ、知仙/已/ し Xヽヽ、こ一・7ヽ\ KLへNは・4乙
い、‘
へ_/-ヽ、y1ノベに2ニジR弧J/ ̄
¬'i・・Q、ご5ニニ゛こrr?モジi ノ'ふ一、
り7.ふ、.,ン1≧こ-一づ
べ£ミント岬詞y才分yづ/-眼識ヽづぞ7(詞?脳 き戈さ心ご=柵席拓郎
λ /jiや・\nvrF7 1 ’ \ レr乾_、・rじじ/ン1 11 1心
『
ハ、、....−7で'' ̄ ・ ,``--ヽ、
しへ
/│/
乙 /に t
七/U
,/λ`xヽ、_/7 べへ
べ /1 ・y・,
1
X脂八 に・μべ Λ
ふノd
咎
ぺ `ヽヽ,jノXべ`
帽ご
1  ̄犬
ゝl
,x y- 、L
りfヽノ/
ノ/ 心゛ l
5j O心
夕’x、
/ t
レノつ八齢I
11
。// ``‘ハ
│/ い//,rx
1‘こ一考 y心’X・ ・I X
為
つ↑/?メ
X \・づ
グぞン勺 l\ z
/ 1XX
へ,こj x犬;\、I Iソ`、
ニどここ;ンダ1/lい/`ヽ-・ィr ドこLノ
ノ1ノ v>≫≪ へ
匹\ご川ソフ
い 7 1 1F へ・\
・l
・乙
7 ノ
一一‘ ゾ J一一、・ぽ.`͡・へI`-゛ ・ 「
レ、 ぺj
ir\ l’\30
ぺし’
/
、 X、、_ ノ
ノI ・/
.` I/
/
Xノ″``t、 へ。、‰.、
7ヽJxy’ ̄
区
吋こ,/『r、り.‘かノ
千浪
2ダミヤ拘サ
瀕ljlズ
→
≒
ゝ
1
Jf rn y``−・rx.・ │
ノ
/ ̄ ̄ ̄T
’r7`ヽ、
7. /7i/-^.
/│//
/ 1`’,』
へV I ゛I
l i
J
米じノ
\ ・
1 ・ j
レX ・/ ・/
y‘`ヽノ
y、I
'1、n
n、 ・
h
1
心
心
X
ド
‘X,
nj
ド
と
j・X X・X ノノリ |
| ’一匹 。/’
k ノ
・7 ’/
べ_ノ
一万 ̄゛`-。、賎
い
t
1
\_/ I IW
1
X1ノ, r j
7TフIJrj ̄Fこ ̄7?岬T ̄TフTア ̄
’ 了* jl`ヽ・,・T
\ ''-ヽ,λUI/
J「一一▽yT ̄ コ x ふ ぞ ¬ 可 弛 , ・ て 二 " T H べ .`ご
軋J X 1 ・
/ ,
VJ-y
i
/’八 八r ,
y /4 .3c'
1・1
ノ 1八、「
や’こ.
/ ・M ’て``シや み で 1 い l y Z l n j n
メ`吟
1 X ぺ
J
X X ・
}l l,/、y
-, r'゛刎
I
'/ ■ .
’yl`之 ,
■y≫i
フヴドー‘-
ゝ∼_ノ
ニ府ニ
/ SI1□
J _'へ
ンーヘ
/ ,1, 1 1 1
ガヘ
一
−
ノ |
|‘
1 1;、 ド11い
八
ぞJ II ヽ V ’ ` − ’ ’ \ I −
11 1Z I ヽ M l y l 4 ’ 1 7 旅 『
53
/ I
しノ\
1
lr器 ’
lt゛
METEOROLOGICAL
SATELLITE
CENTER
TECHNICAL
NOTE
N0.15
MARCH
1987
(c)
50N
40N
30N
20N
10N
ON
120E
□OE
130E
ERROR
MOE
Fig. 6 As in fig. 3, except for October.
are similar to those in January
over
areas.
This
tendency
clear areas in the middle
Fig. 6 is the same
Tenpencies
(2)
radiative
(3)
calibration
latitude.
3 except
water
October
In this
to that in
January and
April.
tween SST
the large differences be-
estimated from
Marine
range
of area.
These
SSTs
Report
They
cannot
titative analysis
GMS
appear
sometimes
data
(a)
and
over a wide
exceed
We
be utilized for the quan-
section, we
clear radiance
cannot
to 2 count
of SST.
error of SST
infrared image
discuss
these
factors in
estimated
and
clear TrB
avoid
the magnitude
and Trb
the error
from GMS
data is caused by the follow-
cannot
remove
contamination.
The
frared channel
on
ments in
infrared
54
−
ofl
values.
sub-satellite point.
clear radiance and clear Tbb
−
we
of
precisely.
to a degree
If the size of cloud is less than
ing factors.
(1)
on GMS
vapor
error in the clear radiance
5 K.
Discussion
The
of the radiometer
It is difficult to estimate
view,
4.
scheme
detail.
In every case,
Ten-Day
transfer
㈲ vertical profile of temperature and
for October. The tendencies of error in
are similar
of difference
and April.
is small in the
one as Fig.
180E
□oヒ
160t
150E
1985.10.1-10
the effect of cloud
field of view for inGMS
The
is 6 km
X 6 km
histograms
1 ° latitude x1 °longitude
and
a field of
of
at a
ele-
for both
visible channel are shown in
気象衛星センター 技術報告 第15号 1987年3月
plains
data
that
is
higher
○
the
(b)
zone
radiative
and
in
transfer
radiative
lmW/(cm2
correspond
For
from
truth
the
in
cloudy
and
the
area
Hill(1980),
transfer
scheme
in
purpose
the
vicinity
from
Tbb
October
the
in 1984
300
the
K。
error
we compared
with
The radiances were
less
sr cm-1)
of
of investigating
radiative transfer model,
the calculated
the
is
sr cm-1);1mW/(cm2
to 0.6 K
the
Tbb
GMS-3
data
scheme
to Weinreb
of
than
the
latitude。
According
error
estimated
than
latitude
of lower
of
SSTs
lower
observed
to October
calculated
clear
in
1985.
using
SSTs
of the Ten-Day Marine Report and the
radiosonde data at the stations near the
coast
and
on the island. The radiosonde
stations are listed
Pig.
7 The
histogram
latitude x1
and
infrared
tions
of
° longitude
channel.
The
are (24°N. 147E),
(24°N,
148°E).
frared
histogram
If
elements
in
1°
for both visible
center
we
would
data
from
the
tracted
on
Table
l.
is extrapolated
altitude
the
of
The
radio-
to surface level
the
station.
We
ex-
clear 7n near the radiosonde
of posistation. The positions
(24°N, 148°£), and
only,
sonde
check
the three
extracting
in-
histo-
the
radiance
are
which
clear
also
Tbb
listed
are
and
on
used
calculating
Table
for
the
l。
gram are probably regarded as clear.
Judging
from
histogram
mode
visible data, the above
are contaminated
values
histogram
third
of the
are 1K lower
two
by cloud.
above
two
than
The
(24°N,
center
check
three
channel
the
of the
The
are
If we
only,
probably
two
147°E),
149°E).
histogram
judging
obviously
(24°N,
clear
y=0.005
T。a is extracted
visible
for
for
visible
contaminated
by
cloud.
of the
in
the
third
channel
one.
field of
view
are
The
using
The
Tbb
and
the same
except
of the
between
are
is less
adopted
statistics
calculated
ex-
Fig.
55 −
8
calculated
divided
of
the
10.0K,
the
into
of
four
the
difference
every
shows
;
the
clear
ex-
one。
group
position
acand
between the
observed 7n and the calculated Tbb
existence
for
threshold
the
than
as
cording to the latitude
as
SST
extracted clear one is used
is
data
of
Instead
difference
the
tracted
the
1.0K
partially
the
estimation
value.
i.e. if difference
his-
histograms
infrared
as the
threshold
Tz,。and
regarded as
from
the
value,
these
values for the above two his-
as that
cloud
are
(24°N,
above
are
mode
tograms
of
and
However,
tograms,
low
areas
infrared
histograms
clear.
The
of
148°E),
would
using
(me.
一
7;
water vapor con-
γ二〇。0。
method
Fig.
for
tinuum is calculated
and
infrared
that
transmittance
are
month。
the
mean
of their
differences
METEOROLOGICAL
SATELLITE
CENTER
TECHNICAL
NOTE
Nal5 MARCH
1987
Table l Radiosonde station and position to use for extracting the clear Tbb
and calculating the radiance or TBB、
Name
No
31909
3
WAKKANAI
47401
4
NEMURO
47420
5
VLADIVOSTOK
13960
6
MISAWA
47580
7
AKITA
47582
8
SENDAI
47590
9
WAJIMA
47600
10
QINGDAO
54857
11
YONAGO
47744
12
FUKUOKA
47807
13
SHIONOMISAKI
47778
14
HACHIJOJIMΛ
47678
15
SHANGHAI
58367
16
CHICHIJIMA
47971
17
TAOYUAN
46697
18
NAHA
47936
19
MINΛMIDAITOJIMA
47945
20
ISHIGAKIJIMΛ
47918
21
MINAMITORISHIMA
47991
22
HAIKOU
59758
23
WAKE
91245
24
LAOAG
25
XISHADAO
26
CLARK
27
LEGASPI
28
(deg.)
136.7
45.4
141.7
43.3
145.6
43.1
131.9
40.7
141.4
39.7
140.1
38.3
140.9
37.4
136.9
36.1
120.3
35.4
133.4
33.6
130.4
33.5
135.8
33.1
139.8
31.2
121.4
27.1
142.2
25.0
121.1
26.2
127.7
25.8
131.2
24.3
124.2
24.3
154.0
20.0
110.4
19.3
166.7
98223
18.2
120.5
59981
16.8
112.3
98327
15.2
120.6
98444
13.1
123.7
GUAM
91217
13.3
144.5
29
YAP
91413
9.5
138.1
30
KWAJALEIN
91366
8.7
167.7
31
KOROR
7.3
134.5
32
TRUK
7.5
151.9
33
MAJURO
34
KOTA
35
36
AFB
PALAU
91408
91334
91376
position
long. (E)
(deg.)
151
138
141
146
139
143
136
122
133
129
136
140
123
142
121
127
131
124
154
112
167
120
112
119
124
145
376733
1 1 1
150.5
45.0
0000COCOCOtDl^
46.1
specified
lat. (N)
(deg.)
OO
TERNEJ
(E)
1 1
32186
long.
152
172
7.1
171.4
96471
6.0
116.1
114
PONAPE
91348
7.0
158.2
158
BRUNEI
69315
4.9
114.9
114
一
-
−一
一一
KINABALU
56
−
C^︶
nj 4
URUP
2
lat. (N)
(deg.)
46454543む41403837363634罰333127262626242420191817T︱(I︱141498777665
1
altitude
m 7 1 1 2 3 3 1 4 7 1 7 5 4 n乙 I l qy l 1 1 Qり 4 1
ぐ 一 1 1 1 1
Station
4ノ 一 〇 I I ≪o 8 9 0 3 6 7 8 4 5 3 7 4 01U tnu3i' a5Lr3Trur3UQy3Cj5^HC︱
No.
気象衛星センター 技術報告 第15号 1987年3月
2.0
2.0
肩1‘0
茸110
0.0
0.0
−1.0
-1.0
0 0 0
2.ta
0
0
2. 1.
D
S
SD
MONTH
MONTH
2.0
2.0
−1.0
^■^
−1.0
AT
0.0
-10
0.0
-1.0
0 0
7一L
D
S
2.0
SD
l.O
0 0
0.0
MONTH
2.0
(ON
Jto
ぺ・ぺよ≒
0.0
MONTH
50N)
/Vへ:
シ≒
トゾ
・・1.0
F11.8
-
Statistics
observed
TBB(TBB<=). IT is mean
ニ
ムダ‰
2。0
'。
l
ご
'
`
eヽe‘e
1.0
TBB'')i
(≪= 1,…,
viation
of ∠ぽ1(i=1,…,
number
四・ 四
1 1 1 1 1 1 1 1 1 1 1 1 董
10
1 4
MONTH
7
10
-
SD
of the difference
TBB(Tb B°゜) and
57 −
of data.
N),
and
between
the
the
calculated
of 4Ti=(TsB−
SD is standard
dey is the
N),
where
METEOROLOGICAL
and the standard
X
SATELLITE
deviation
indicate the value
respectively.
times
reaches to 2 to
between
of data have
of these
at Xishadao
near
this
values
and
(59981).
due
simultaneous
Uchiyama
can
only
A
large
part
concerning
on the observation
clear 7n observed
a tendency
to
of small
thermal
high
GMS-2
from
There
just near
(c)
is another
islands
In
the
possibility.
the radiance
which
May
to June
greater than 2
on
We
from
values.
K is rather
May
The
to June
large.
This
value,
transfer model would be
only
one infrared
on
several
be solved
ing
parameters
the
radiative transfer scheme. Since γ=
0.005 means a
absorption
percents.
by adjust-
large
coefficients in
continuum
SST
from
from
prediction
are restricted
channel,
algorithm
and
the accurate
absorption,
The
we can
to a degree
These
would
for error of the ver-
vertical profile above the ocean is
a difference
only
satellites, there
that the infrared
data
logical satellites,
because we
the more
SST
trieve SST
not be well-calibrated.
well-calibrated
infrared
due
the sensor
orbital satellites. If the vertical pro-
file were depend heavily on the orbital
improve
facts suggest
data
It is well-
of GMS
are not
to the thermal gradient
unit.
from
into
of 1 K。
known that
within
coefficients
if aerosol is taken
verneed
tical profile.
would
from
accurate
be no
meaning
the geostationary
obtain
from the data Ob; for
by the method of multi-channel
technique using AVHRR data of NOAA/
58 −
to re-
meteoro-
could
served by the polar orbital satellites
example,
Ichiki et. al. (1984)
-
account,
Even
of the
obtained. We
polar
the larger absorption
sounding
so on. As
scheme
has
the other
to the use
dependent on sounding data derived
this one.
and
only one in-
it is not realistic that radiative transfer
than
is nega-
orbital satellite, climate
tical profile cannot be
the robust
The
the information on the
numerical
as we
cannot
in June
of data ; radiosonde data,
long
differences
8.
that the systematic
atmosphere must be given
dicates that the errors of the radiative
The
in Fig.
a
areas.
estimate
data derived from
in-
respect
vapor
we
source
difference
from
compensate
vertical profile of temperature
water
of
shown
all over
The
with
differences
error explains
frared channel,
means
GMS-2.
temperature
of the first ten days
(d)
comes
to
are 1.5 to 2.0 K
These
tive almost
GMS-3
that the
in the period
tend to large negative
error
GMS-3 has the
similar
part of errors
When
of radiometer
Fig. 8, it is found
differences
exactly
in the sensor unit
effective shutter
to GMS-2.
surface。
calibration
the rela-
on the base of the radiance
structure
error of
the Ten-Day
not include
temperatures
calculated theoretically.
affected by local geographical
observed
and GMS-2.
and
calibration
features.
of GMS
among the effective shutter tern-
values because
does
observation
perature
large
Report
of
tionship
tendency
Marine
calibration
et. al. (1984) investigated
Marine Report near this station have a
small structure
the
20°N,many
or SST of the Ten-Day
to low
for
In the lower
to the influence
coral reefs,
the error
1987
3K.
The
has
MARCH
O°N and
are based
station
Nal5
infrared image data by comparing the
but that some-
positive error.
data
NOTE
mentioned
and γ=0.0タ
of the differences
within 1 K,
latitude zone
TECHNICAL
of those.⑧and
for r=0.005
Half of mean
are coincident
CENTER
気象衛星センター 技術報告 第15号 1987年3月
TIROS
series satellites。
culated
Using McCIatchy's tropical atmosphere,
we
tried to
estimate the
influence
T88using the vertical profile
lyzed objectively
of the
in order
for numerical
of the vertical profile on the observed
use that
profile.
TsB.
The change of temperature by
between
the observed
below the level of 800
mb leads to the
Tbb
change
1 K.
the period
of Trb by
of water
vapor
about
amount
by 10%
The
leads
change of 713 by about 0.4
from these results,
error
the new
analysis
K.
vapor instead of
prediction
climate
the accuracy
observed
is used
This
GMS-3
DIFF
with
of differences
the calculated
October in
2.0K almost
not
are proper.
restricted
im-
channel,
accurate
We compared the
by
and
results do
scheme
and water
value.
means
in Fig. 9, 10, 11, and
1985.
The
2.0 K,
but
all over
difthey
the area.
show
the radiative
However,
12 in
of January,
necessarily
the vertical profile and
as
of the amount of at-
mospheric correction.
clear Tbb
These
to
7n and
of the first ten days
are less than
the result of objective
for numerical
The
ferences sometimes exceed
of 0.5 to 1K。
system,
are shown
April, June
Judging
we cannot avoid the
the vertical profile of temperature
proves
to the
that
transfer
since
we
are
to the use of the only one infrared
it is difficult to desire a more
value for correcting
the atmospheric
effect。
the cal-
We use the vertical
□
TBB 圃OD)
9 8 5
profile analyzed
Ob-
01.01づO)
50N
4 ON
30N
20N
10N
ON
Fig. 9 Mean
150E
120i゛
□OE
130E MOE
DIFF. TBB
of difference between
160E
170E
180E
1985.1.1-10
the observed TBB
using the vertical profile analyzed
tively for numerical prediction, in the period of the firstten days of January in 1985.
value is the former
TBB
minus
the latter one.
一
In
to a degree
change
prediction,
to check whether it is proper
error
2 K
ana-
59
objecThe
METEOROLOGICAL
SATELLITE
DIFF
CENTER
TECHNICAL
NOTE
Nal5
MARCH
1987
(1985.0∠に01−10)
TBB 副OD)
50N
30N
20N
ON
□OE
120E
i30£
140E
DIFF.
Fiff. 10 As
DI
−
F
TBB
in fig. 9, except
T3B (MOD)
「
170E
150E 160E
1985.4.1-10
for April
180E
in 1985.
985.07.01−10)
(1
50N
40N
30N
・-¶・4111 ・-●●--・噂・ 暗●・・●
言回
じ
−一
・●ミ4
ミー・一∼
J・●
゛‘http://www.
−・
・・
−啼
●・4
喇−●−−−一越
1
ミ1−=∼∼∼・・−●
2
一−・
…‥こぶこ・訊
菊菜
申一一
−●●●−−−
c・v● 哺 吻 ● ● 4 ● −
一−
1|ミ ミ ミ ー
ミ
崎●崎綱嘲噂
::::::htt
●
〃1−
41
−−−−●−−
戸一一−−4
--一喝●爛
--一剛ミー│
ゴ」
−●・〃〃
一∼一∼
匹回ぐ
・ 9t-て
そ
こ
・--●----●−−−−一問−−−−−−−
..-.…乙.…….
●・
y’・”
−・−
・●−
ミ4
−414−
一一肖・一一
p://www..
−・
・・
・●−一曙−
・・ −
10N
≒翌毘:賄ヅレ:ゾ七ンで≒良二二¨鰐百二啓示
チェ?Tう
1-噂岬 . N。.,..u ・- ドで りーど ̄7 ’
回付目性,よザレ
り一一・ ’¨1
ツ,=,:回詣でi芒・f芸嗣頌辞
心st.;.−・. 1 . ...... ……’i………… ‥ i
120E
130E
140E
150E
160E
DIFF.
TBB 1985.7.1-10
Fig. 11 As
in fig. 9, except for July in 1985.
一
ON
1 10E
60
−
170E
180E
気象衛星センター 技術報告 第15号 1987年3月
DI
一
一
TBB (回OD)
□’
(1
9 8
5
10
01
〇)
づ
20N
ON
□OE
120E
i30E
MOE
Fi≪. 12 As in fig. 9, except
jectively for numerical prediction all over
amount
large
is a posi-
in the cloudy
region,
there
is
the error
Fig. 13
changes
to water
and
cloudy
(e)
region
must
amplification
vertical profile in the
serious
temperature
However,
the error
±1K,cannot
The error of the
clear 7n, the radiative
transfer scheme,
and the calibration of
tend
of SST. Furthermore,
profile is given
be avoided.
to lead the systematic
since the vertical
SST
1 K leads
of
because of
the
reason
cribed
below ; i. e. a small error is amplified
are fixed and
the case where
to that of the
temperature
is equal
atmospheric
level。
shown
in Ffg.
of radiance
observed
/dTs
is less than
when
the earth
lite, its contrast
to the serious
error
vapor
13
and
14, the change
for the change
face temperature becomes
every 2.5°×2.5°, its error
of error
the vertical profiles of
water
surface
As
error
and
one, respectively.
γ=0.005 is used.⑧indicates
lowest
leads to the error spread widely. The
magnitude
large。
tropical atmosphere
summer
In these calculation,
error
to a certain degree,
radiometer
mid-latitude
of small
error.
becomes
in McClatchy's
be modified。
-We cannot specify which factor causes
the most
of SST
and 14 show how the observed
T88 changes as the surface temperature
bility to over-estimate the absorption due
vapor. The
180E
for October in 1985.
and
the region. Since water vapor
170E
I50E I50E
1985.10.1-10
DIFF. TBB
1.0. This
is observed
become
of sur-
dull; i.e. dTBB
indicates
from
worse
that
the satel-
than
that of
the original surface temperature. In the
des-
tropical case, the value
to 0.4. For
61
of j TsB/dTs
is 0.3
example, dTBB/dTs=0.4
means
METEOROLOGICAL
SATELLITE
CENTER
TECHNICAL
Tropical
(a)
NOTE
(b)
1.0
No.15 MARCH
1987
Tropical
0
3
︵M aaト
cJTbb
WdTs
0.5
260.7-1
250
0.0
300
250
250
Surface
rature
Fig. 13
(a) Relation between
surface temperature
in the case of McClatchy's tropical atmosphere.
than that of the original surface temperature.
300
1emperatuTe
and the brightness temperature
to be observed
The contrast of observed TBB becomes worse
TBB=260.7 is the contribution of atmospheric
radiation. (b) Change rate of the observed TBB
to the surface temperature. The inverse of
this value means an amplification factor of error.
(a) mid-latitude
summer
(b) mid-latitude
summer
1.0
30
︵£︶Iト
dTBB
dTs
0.5
2 50
242. 8→
0.0
250
Surface
300
Temperature
Ts(K)
250
Surface
Fisr.14 As in Fig. 13, except for McClatchy's
mid-latitude summer
-
TBB=242.8 is the contribution of atmospheric
62
radiation.
300
Temperatu re
atmosphere.
気象衛星センター 技術報告 第15号 1987年3月
that
when
we
estimate SST,
the error
that
of
7‰ is amplified by 1/0.4=2.5 times. In
the
case that
and
the
the
atmosphere
of Tbb is
0.2 to
amplified
of
by
dTsB/dTs
5
in the
mer is larger than that
sphere,
error
the
but
is
fore,
its
which
surface
even
to
3
error
times.
of
by
if the
error
Tbb
becomes
about
times.
of the
clear
would
±2
be ±1K,
the
does
There7n
on
300 K.
GMS
Therefore,
the observed
talized
ference
to
the
The
0.5 K
and
as
error
an
of
important
only
error
is converted
l
of
one
problem.
or
digi-
The
dif-
of
in
11μm
Fig.
infrared
15.
atmospheric
0.5
must
in
gree. The
new
has
not go
The
inherent
from
sight
has
As long
the utilization of
many
as-
and the error
that
of
of the atmospheric
be avoid to a certain
method
is superior
the empirical
derived
away
tuning
de-
to the
proceses
by the current
from
method
the climate value.
amplification
nature
The
is hidden
new
method
not a tuning process. In spite of
more accurate value of
case
0.
33NV111ΣSNvaト
cured
clear Tbb
correction,
due
the larger
and
error
to the inherent amplification
the
the
ocna-
ture. This general concept is shown in
Fig.
16.
15 Transmittances
tropical atmosphere
of 11μm region. r=o.
005 is used
the
new
by
the
a distance
be-
method
for
are smaller
operational
the true
new
the distance
than
one,
and
value and
method
between
−
than
one
that by
method. However,
the true
SST
new method
distant as that by the current
63
those
the estimated
is nearer
operational
estimated SST by the
text).
一
of error
by
the current
in the region
(see
deviation
The circles of the value obtained
「1)
of the vertical path
of
deviation
by the
(c
a standard
of climate value.
800 900 1000
NUMBER
circle represents
and a standard
tween
WAVE
A
dispersion ;i.e. a standard
current
McClatchy's
to
with a cover.
atmospheric
Fig.
and
cannot
the SST
transthe
accuracy
method.
be made
correction
does
of
window,
to
restricted
and
path
Even in the region
mittances reduce to 0.2
are
operational
method
cedure. The current operational method
for McClatchy's tropical atmosphere are
shown
we
implicitly
SST。
transmittances of the vertical
tro-
current operational method in each pro-
digitalized count leads
to 3 K
that the new
not necessarily improve the
the clear 7n
vicinity
McClatchy's
is
and mid-latitude summer
test results show
sumptions
the
reaches
radiance
the only one infrared channel,
to which count value
radiance
is
in
60ぢ for
of the current
to 5K。
is
40ぢ and
The
The radiometric resolution of infrared
sensor
and
one, respectively。
atmo-
the
from
pical atmosphere
sum-
tropical
2
about
The
mid-latitude
is emitted
to the satellite to the observed
value is about 0.5 and
amplified
calculated
of SST
ratio of the radiance
wet
0,3 ; i.e. the
path
length is long. The
zenith angle of satellite is large,
dTBB/dTsbecomes
value
is more
the atmosphere is wet and the
and
the
is as
one. Further-
METEOROLOGICAL
SATELLITE
CENTER
TECHNICAL
each
n ew
quantity
because
1987
of the error of the
calibration.
The errors of the clear 7`n
observed by
the satellite, and those
calculated one are
current
rren
However,
new
/
SST
the error of the clear T BB and
This
This
fact indicates
0.1K and multi-channel
necessary
current
to the
order
to remove
own
measurements
operationally
・ Truth
stage. Before
x Estimated v(ユlue
we
o Climte Value
the above
concept on errors. Tbb,
×.
and
TBB,
and
and
The
accuracy
temperature.
of error
more,
that
note
current
the climate
and
that
of
We
is the
same
climate
value.
order
study
the
effect.
as the
also very
atmospheric
new
vapor
analyzed
prediction
and
transfer
SST
equation.
in the
four
method
In
the
to
new
objectively
the
solution
We
tried
cases
in
correct
discussions
method,
to
order
Takeuchi
of
over
error
of SST
estimate
the
is installed,
climate
ship
to correct
and
buoy
meas-
Yoshida,
Head
value.
to thank
Mr.
T.
District Meteorological Obser-
he was
Satellite
grateful
in our
Director
of Japan
Center
last
to Mr.
I. Kubota
Head
last year. Also,
with
Dr.
A.
Mita
We
for the
support when he was
are greatly
Mete-
year.
of
numerous
and
Mr.
Y.
appreciated。
taneous Observation of GMS
and GMS-2.
―A
Study of the Difference between the Bright-
to investigate
becomes
a wide range of
at the present
method
the method
using
use
Ichiki, A., M. Togashi and A. Uchiyama, 1984:
An
Analysis of the Data Obtained by a Simul-
radiative
ness Temperatures
In
greater
by GMS
and Those
Meteorological Satellite Center
Note N0.10, 19-27 (in Japanese).
Inoue, T.,1979 : Emprirical Atmospheric
area. We
-
test, the
2K
method
the
cannot
References
2―,
than
We
for numer-
the performance of the new method.
every
to develop
error
our department
we utilize the vertical temperature and
ical
when
orological
summary
the
only.
for encouraging us always
continuing
and
^Ne developed
water
wish
vatory,
value.
Conclusion
are
atmospheric effect by
this new
of Sapporo
rcspec-
the standard deviation of
method
measurements
Acknowledgements
●,
the estivalue,
less than
atmospheric correction in
this new
and
re-
are a
size of circle indicates a standard
deviation
5.
surface
0 mean the truth valu3,
tively.
climate
SST
amount of atmospheric
sea
mated valu2,
the
T and
intend
urements
Fisr. 16 The schematic view of the general
observed
that
feature is inherent。
that the
quired for the measurements is
correction,
K.
the clear 7`n
of the atmospheric correction is amplified
by a several times.
clear
of the
probably about 1
when we convert
to SST,
X
Nal5 MARCH
could not estimate exactly the errors in
△T
Tbb
NOTE
64
−
by GMSTechnical
Correc-
気象衛星センター 技術報告 第15号 1987年3月
tion,
Meteorological
Note
Satellite
(Special Issue 11-2),
System,
Center
Technical
Summary
11 Data Processing,
of
Part
TRAN
GMS
2, 7-14
(in
Japanese).
Kneizys.
F. X.. E. P. Shettle,
Chetwynd
R.
W.
Jr.,
Fenn
spheric
L. W.
and
W. O.
Abreu,
Gallery.
J. E. A.
Transmittance/Radiance
LOWTRAN 5,
: Computer
Code
Air
Force
Geophysics Laboratory,
Hanscom AFB,
Department
20 pp.
MA,
Uchiyama,
233pp.
of Commerce,
McClatchey,
R. A.,
Volz, and
R. W.
Fenn,
perties of the atmosphere
AFCRL-72-0497,
Laboratories,
MA,
108
Roberts,
Air
L. G.
Selby,
: Optical
culated
pro-
(third edition).
Force
Cambridge
Research
Hanscom Field,
J. E. A.
Selby
1976 : Infrared continuum
Opt.,
Selby,
J.E.A.,
A.
L. M.
the
window,
Weinreb,
Kneizys,
J. H. Chetwynd
McClatchy,1978
Trancmittance/Radiance
Jr.,
Code
M. P. and A. C.
Neuendorffer.1973
LOW-
GMSの赤外画像データによる海面水温の推定
1
敏
.
牢貝
明用
内 山
村 弘 志**
郎***
GMSの赤外画像データから,海面水温を推定する際の大気補正の方法と,それを使って得られた結
果について述べる。
現在, GMSの赤外画像データの大気補正は,経験式と気候値の可降水量を使って計算している。新
しい方法では,大気の鉛直温度・水蒸気分布として数値予報の解析値を使い,大気補正値は放射伝達
方程式を解くことによって計算する。
新しい方式で海面水温の推定を4例行った。その結果,系統的誤差(広い領域にわたって同じ傾向
の誤差)が生じやすいことがわかった。誤差の大きさは,5Kを超えることもあり,定量的な解析に
耐え得るものでない。これは,観測T88や計算T88の誤差が,海面水温を推定するときに増幅されるた
めである。この性質は,衛星から海面水温を推定する際の本質的な性質であり,1チャンネルの画像
データからの海面水温の推定は非常に困難であることを示している。
これらのことから,海面水温を精度0.5K以下で推定するには,晴天Tbb
(雲の影響を受けていない
衛星到達放射),大気補正値を精度O.IK以下で決める必要がある。さらに大気の鉛直分布について仮
定することなく,衛星の測定だけから大気補正を行うことが望ましく,いくつかの波長城で地球から
の放射を測定する必要がある。
* 気象衛星センター・システム管理課
** 気象衛星セソター管制課(現所属,科学技術庁)
*** 気象衛星センター解析課
−65
Tern-
:
Method to apply homogeneous-path transmit tance models to inhomogeneous
atmosphere, I.
Atmos. Sci., 30. 662-666.
: Atmospheric
: Computer
Radiances and Brightness
NESS 80,
National Oceanic and Atmospheric
Administration. U. S. Department of Commerce,
Washington, D. C, 40 pp.
by atmo-
15,2085-2090.
F. X.
:
of Cal-
peratures in Infrared Window Channels of
Satellite Radiometers, NOAA
Technical Report
Biberman,
8-12μm
Calibration by Means
Radiances, Meteorological Satellite Cen-
of Atmospheric
Bedford,
absorption
spheric water vapor in
Appl.
and
D. C,
ter Technical Note N0,
10,29-36 (in Japanese).
Weinreb, M. P. and M.L. Hill,1980 : Calculation
pp.
R.E.,
and R.
J. E. A.
J. S. Garing,1972
Washington,
A., A. Ichiki and T. Takahashi,1984
VISSR Infrared
F. E.
Bedford,
ESSA Technical Report NESC 47,
Environ mental Science Services
Administration, U.S.
Atmo-
AFGL-TR-80-0067,
Air Force Geo・
Hanscom AFB,
Smith, W.L.,1969 : A polynomial representation
of carbon dioxide and water vapor transmission.
I. H.
Selby,
R. A. McClatchey,1980:
4. AFGL-TR-78-0053,
physics Laboratory,
MA,
100 pp.
−
© Copyright 2026 Paperzz