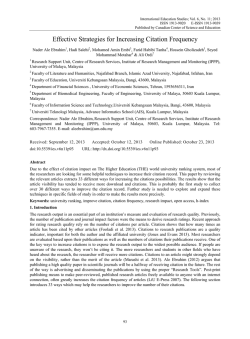
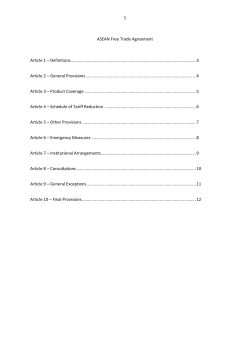
Modern Applied Science; Vol. 8, No. 2; 2014
ISSN 1913-1844
E-ISSN 1913-1852
Published by Canadian Center of Science and Education
Relationship among Economic Growth, Internet Usage and
Publication Productivity: Comparison among ASEAN and World’s
Best Countries
Hossein Gholizadeh1, Hadi Salehi2, Mohamed Amin Embi3, Mahmoud Danaee4, Seyed Mohammad Motahar5,
Nader Ale Ebrahim6, Farid Habibi Tanha7 & Noor Azuan Abu Osman1
1
Department of Biomedical Engineering, Faculty of Engineering, University of Malaya, 50603 Kuala Lumpur,
Malaysia
2
Faculty of Literature and Humanities, Najafabad Branch, Islamic Azad University, Najafabad, Isfahan, Iran
3
Faculty of Education, Universiti Kebangsaan Malaysia, Bangi, 43600, Malaysia
4
Faculty of Agriculture, Roudehen Branch, Islamic Azad University, Roudehen, Iran
5
Faculty of Information Science and Technology,Universiti Kebangsaan Malaysia, Bangi, 43600, Malaysia
6
Research Support Unit, Centre of Research Services, Institute of Research Management and Monitoring (IPPP),
University of Malaya, Malaysia
7
Department of Financial Sciences, University of Economic Sciences, Tehran, 1593656311, Iran
Correspondence: Hadi Salehi, Faculty of Literature and Humanities, Najafabad Branch, Islamic Azad University,
Najafabad, Isfahan, Iran. Tel: 98-913-104-1419. E-mail: [email protected]
Received: January 5, 2014
doi:10.5539/mas.v8n2p160
Accepted: February 7, 2014
Online Published: March 14, 2014
URL: http://dx.doi.org/10.5539/mas.v8n2p160
Abstract
Publication productivity, as measured by the number of papers, has been regarded as one of the main indicators
of reputation of countries and institutions. Nevertheless, the relationship among research publications, economic
growth and World Wide Web in ASEAN countries is still unclear. The main intention of this study was to
identify publication productivity among ASEAN and the world’s top ten countries in the last 16 years
(1996-2011). This study also aimed at finding the relationship among publication, gross domestic product (GDP)
and internet usage. Furthermore, the publication trend in the 10 first Malaysian universities was evaluated for the
same periods. Scopus database was used to find the overall documents, overall citations, citations per document
and international collaboration from 1996 to 2011 for each country. The World Bank database (World Data Bank)
was used to collect the data for GDP and the number of internet users. Moreover, to evaluate 10 top Malaysian
universities, the number of published articles, conferences, reviews, and letters for the same periods was
collected. The results of this study showed significant differences among ASEAN and top 10 countries regarding
publication productivity. Moreover, a positive and significant relationship was observed between indices, GDP
and internet usage for these countries. Surprisingly, international collaboration had a significant and negative
relationship with economic growth. Malaysia had fewer citations per document (7.64) and international
collaboration (36.9%) among ASEAN countries. In conclusion, international collaboration between academic
institutes and researchers is influenced by economic growth and access to internet in the countries. Furthermore,
publication trends in ASEAN countries are promising. However, policy makers and science managers should try
to find different ways to increase the quality of the research publication and to raise citation per document.
Keywords: ASEAN countries, publication productivity, citation, internet user, collaboration, economic growth
1. Introduction
The Association of Southeast Asian Nations, a geo-political and economic organization including ten countries
located in Southeast Asia, was formed on 8 August 1967 by Indonesia, Malaysia, the Philippines, Singapore and
Thailand. Since then, the membership has expanded to include Brunei, Burma (Myanmar), Cambodia, Laos, and
Vietnam. One of the main aims of this association is accelerating economic growth (Sarel, 1997). The main tool
for measuring a country's economy is Gross domestic product (GDP) that is the market value of all officially
recognized final goods and services produced within a country in a given period of time.
160
www.ccsenet.org/mas
Modern Applied Science
Vol. 8, No. 2; 2014
Based on the literature, there is a relationship between economic growth and education and research publication.
However, this relationship has not been well supported by realistic evidence (Jin & Jin, 2013; Nelson & Phelps,
1966; Lucas, 1988; Becker, 2009; Romer, 1990). The Researches by Mankiw et al. (1992) and Barro (1991)
showed positive and significant effects of education on economic growth (Mankive et al., 1992; Barro, 1991).
While the study by Bils and Klenow (2000) showed a possibility of reverse relationship between economic
growth and education (Bils & Klenow, 2000). Moreover, in a recent research study, Jin and Jin (2013) indicated
that publication productivity in different fields has dissimilar effects on economic growth. For instance,
engineering and science have positive influences on economic growth in comparison with publication output in
the field of social sciences (J. Jin & L. Jin, 2013). These days, publication productivity is a main task for
researchers and students than in the past decades and the results of research should benefit the community (Zain
et al., 2009). Based on new developmental principles, the number of knowledgeable employees could be
increased by education (J. Jin & L. Jin, 2013). In addition, educated human resource would help the economy of
the countries to grow faster. Moreover, it is widely observed that the world’s top productive research universities
are in the highly developed countries such as the United States, the United Kingdom and Canada et al.
Publication count is an indicator of research productivity and used to rank countries and universities (Liu &
Cheng, 2005; Meho & Spurgin, 2005; Narin & Hamilton, 1996; Toutkoushian et al., 2003; Yazit & Zainab, 2007).
It can also be used to determine authors’ productivity or the publication productivity of research groups (Liu &
Cheng, 2005; Hart, 2000; Uzun, 2002; Gu & Zainab, 2001; Fox, 1983). The number of citations of previously
published works is an indicator of its subsequent recognition and impact in a field of study. Reviewing articles
that are frequently cited can provide information about the dominant areas of a discipline and also highlight the
growth of particular fields. Furthermore, top-cited articles are often written by recognized experts who can offer
insights into future directions of the discipline (Joynt & Leonard, 1980; Kelly et al., 2010; Lefaivre & O’Brien,
2011; Ponce & Lozano, 2010).
Science Citation Index appeared in 1961 (following that, the Social Sciences Index was formulated in 1966).
Using this index, it has been possible to answer questions such as “who publishes more articles” and “whose
articles are being cited more often?” (Bar-Ilan, 2008; Heeks & Bailur, 2007; Meho & Yang, 2007). Hirsch
developed the H-index (proposed by Jorge E. Hirsch, a physicist at UCSD, in 2005) as an alternative to
traditional bibliometric measures. The H-index is a single bibliometric indicator that combines measures of
productivity and impact into one. Hirsch argued that this combination reflects the impact of a publication on the
corresponding scientific community (Braun et al., 2006; Schubert & Glänzel, 2007). H-index retrieved by
citation indexes (Scopus, Google scholar, and Web of Science) is used to measure the scientific performance and
the research impact studies based on the number of publications and citations of a scientist. It is also easily
available and may be used for performance measures of scientists and for recruitment decisions (Aghaei et al.,
2013; Ale Ebrahim et al., 2013; Brown & Gardner, 1985; Fooladi et al., 2013).
In this study, we used the human development index (HDI) to find the top ten countries around the world. HDI is
a composite statistic used to rank countries according to their development levels from “very high” to “low”.
Countries are placed based on life expectancy, education, living standard, child welfare, health care, economic
welfare, and population’s happiness.
The main purpose of this study was to compare publication productivity among ASEAN and the world’s top ten
countries from 1996 to 2011. In addition, we intended to find the relationship among publication productivity,
gross domestic product (current US$), and internet usage. Finally, we aimed to investigate the publication trend
of the 10 first Malaysian universities in the same periods. In this study, Scopus database
(WWW.SCIMAGOJR.COM) was used since it is a primary full-text scientific database and offers about 20%
more coverage than Web of Science (Anad & Sen, 1994).
We hypothesized publications of academic papers as the research outputs have positive relationship with
economic growth and the number of people with access to the worldwide network. Also, there is a significant
difference between ASEAN publication productivity and the world’s top ten countries.
2. Method
To identify publication productivity among ASEAN and the world’s top ten countries, Scopus database
(SCImago) was used to compare overall documents and citations, cited documents, un-cited documents,
self-citations, citations per document and international collaboration from 1996 to 2011. Moreover, the World
Bank database (World Data Bank) was used to collect data for GDP and the number of internet users in these
countries.
To find the top ten countries around the world, we used the human development index (HDI) (Anad & Sen,
161
www.ccsenet.org/mas
Modern Applied Science
Vol. 8, No. 2; 2014
1994). Moreover, to find the 10 first universities in Malaysia, we used the number of publications in Scopus
database. Furthermore, to evaluate these universities, the number of published articles, conferences, reviews, and
letters for the same periods was collected (1996-2011).
2.1 Data Analysis
Prior to data analysis, normality test was done for the obtained data. The normality test revealed that all variables
were not distributed normally. So, to answer the research questions, non parametric test was used. To evaluate
the relationship among related items of publication, GDP and Internet usage, Spearman correlation coefficient
test was applied. Moreover, to compare ASEAN countries with the top ten countries, Mann–Whitney U test was
used. For evaluating the differences in number of documents, citations, self-citations, and citations per document
among ASEAN countries, Kruskal-Wallis test was applied. The Kruskal-Wallis test is a nonparametric test that
compares three or more unmatched groups and it is an extension of the Mann-Whitney U test to allow the
comparison of more than two independent groups.
3. Results
Based on human development index (HDI), the top ten countries around the world are listed as follow: Norway,
Australia, USA, The Netherlands, Germany, New Zealand, Ireland, Sweden, Switzerland, and Japan.
Table 1. Comparison between ASEAN countries and the 10 first countries around the world (publication
productivity and country ranking)
ASEAN
TOP
TEN
Country ranking*
Overall Documents
(1996_2011) in Scopus
publication
H-Index
Brunei
1064
133
140
Cambodia
1296
128
112
Indonesia
16139
63
57
Laos
853
141
135
Malaysia
75530
42
54
Myanmar
906
139
146
Philippines
11326
70
56
Singapore
126881
32
30
Thailand
69637
43
39
Vietnam
13172
67
60
Norway
141143
31
21
Australia
592533
11
11
USA
6149455
1
1
Netherland
487784
14
8
Germany
1581429
5
3
New Zealand
114495
34
26
Ireland
91125
39
27
Sweden
337135
18
10
Switzerland
350253
17
9
Japan
1604017
4
6
Country
* based on 238 countries in the world.
162
www.ccsenet.org/mas
Modern Applied Science
Vol. 8, No. 2; 2014
Table 2. Kruskal Wallis test
ASEAN countries
Brunei
Cambodia
Indonesia
Laos
Malaysia
Myanmar
Philippines
Singapore
Thailand
Vietnam
ASEAN countries
Brunei
Cambodia
Indonesia
Laos
Malaysia
Myanmar
Philippines
Singapore
Thailand
Vietnam
ASEAN countries
Brunei
Cambodia
Indonesia
Laos
Malaysia
Myanmar
Philippines
Singapore
Thailand
Vietnam
ASEAN countries
Brunei
Cambodia
Indonesia
Laos
Malaysia
Myanmar
Philippines
Singapore
Thailand
Vietnam
Documents (Mean)
66.5
81
1008.688
53.3125
4720.625
56.625
707.875
7930.063
4352.313
823.25
Overall Citation (Mean)
484.0625
801.1875
7406.875
478.1875
17601.19
428.0625
7586.875
83167.75
33060.56
6725.25
Self-citation (Mean)
43.4375
88.0625
857.4375
64.875
4345.5625
33.625
866.0625
11939.563
5831.5
789.25
Citation per document
(Mean)
9.5081
12.2075
10.8456
11.8269
7.64
11.5994
12.9463
12.5063
10.6606
11.755
SD
32.26
64.46
663.05
45.95
5443.05
41.21
283.60
3940.70
2963.70
609.77
SD
194.40
614.26
2823.18
400.11
5917.94
245.58
2320.56
32859.46
14704.18
2789.02
SD
19.69
72.82
223.05
50.88
2483.06
18.62
240.79
4584.45
2407.33
394.57
Chi square*
p.value
138
<0.01
Chi square*
p.value
140.628
<0.01
Chi square*
p.value
142.822
<0.01
SD
Chi square*
p.value
5.37
6.05
5.18
5.86
3.98
6.61
6.20
5.02
4.97
5.75
13.099
<0.01
To investigate the differences among ASEAN countries, Kruskal Wallis test was applied. The results for all these
indices showed that there were significant differences among these countries.
163
www.ccsenet.org/mas
Modern Applied Science
Vol. 8, No. 2; 2014
As Tables 1 and 2 show, Singapore had the highest publications (126881 documents) and Laos had the lowest
publications (853 documents) among ASEAN countries, while Malaysia ranking (with 75530 documents) was
the second and the forty second among ASEAN and all the world countries, respectively (based on 238 countries
in the world). Laos with 853 documents, and the publication ranking of 141 from 1996 to 2011 was the last
country in this region. The USA was the first country in the world with the highest number of publications
(6149455), H-index (1035) and overall citation (114546415) (see Table 1).
Interestingly, Malaysia had the fewest citations per document (overall 7.64 cite per document) and the least
collaboration with the world (37%) among ASEAN countries, whereas Laos had the most international
collaboration (91%) in this region from 1996 to 2011 (see Figure 1 and Table 2). Furthermore, Malaysia and the
United States had the highest self-citations with 24 % and 48% of all the citations that were relieved during that
period among ASEAN and the top ten countries in the world (see Table 2 and Figure 1). Moreover, Malaysia had
the least collaboration with the world in the last 16 years among ASEAN countries (1996-2011). As Table 2
shows, there are significant differences among the number of documents (H(2) = 138, p < 0.01), citations (H(2)
= 140.62, p<0.01), self-citations (H(2) = 142.82, p<0.01), and citations per document (H(2) = 13.09, p<0.01)
among ASEAN countries.
Publication trends in ASEAN countries are promising in comparison with the top ten countries in the world (see
Figure 2 and Table 3). There was a significant difference (p<0.01) between ASEAN and developed countries in
number of documents, citable documents, citations (overall), self-citations, cited documents and research
collaboration with the world. The rate of growth (Figure 2) in scientific publication was 24% in Cambodia (the
highest in ASEAN), while Japan had 1.4% of growth in publication among these countries.
To evaluate the relationship among related items of publication productivity and GDP and Internet usage,
Spearman correlation coefficient was applied. Table 4 shows the correlation between indices and GDP and
internet usage for ASEAN and the top ten countries separately. The results showed that there was a positive and
significant relationship between GDP and the number of publications, citable documents, citation, self-citation
and cited documents in ASEAN and the top ten countries in the world. However, one variable of international
collaboration had a significant and negative relationship with GDP.
Regarding the relationship between internet usage and all the variables, we found a significant and positive
relationship in ASEAN countries except for the variable of international collaboration. However, there was a
positive and significant (p<0.01) relationship between international collaboration and internet usage in the top
ten countries.
Prior to data analysis, normality test was conducted. The results revealed that all variables were not distributed
normally so that we used Kruskal Wallis test, a non-parametric test, to examine publication productivity among
the top ten Malaysian universities. Table 5 shows the mean and standard deviation for all types of publications
among the top ten universities in Malaysia. The results of Kruskal Wallis test confirmed a significant difference
among these universities. The institution with the first ranking in Malaysia was University of Malaya with 13105
publications from 1996 to 2011. The main field of research in this university was physics and astronomy with
15 % of all publications. et al.,Moreover, the result of Spearman correlation coefficient test showed a positive
and significant relationship among the number of articles, conference papers, reviews and letters published
during these years. Except the number of conference papers and letters, all other coefficients showed a strong
relationship.
Table 3. Comparison between ASEAN and the top 10 countries for publication
REGION
ASEAN
TOP TEN COUNTRIES
Mean
SD
Mean
SD
Z
P value
Documents
1980.0
3453.7
71558.6
112595.0
-14.5
<0.01
Citable Documents
1859.9
3263.2
67369.3
104758.0
-14.518
<0.01
Citation (overall)
15774.0
27026.4
1190700.0
2256220.0
-14.9
<0.01
Self-citation
2485.9
4098.7
446135.2
1079040.0
-14.86
<0.01
Cited Documents
1277.8
2021.3
53836.4
84267.2
-14.748
<0.01
International
Collaboration
63.2
19.4
39.8
11.2
-10.206
<0.01
To compare ASEAN countries and the top ten countries, Mann–Whitney U test was applied. The results showed
significant differences for all indices
164
www.ccsenet.org/mas
Modern Applied Science
Vol. 8, No. 2; 2014
Table 4. Spearman correlation coefficient
REGION
Index
GDP
Internet users
Documents
.853**
.681**
Citable Documents
.854**
.669**
Citation (overall)
.699**
.511**
Self-citation
.737**
.534**
Cited Documents
.823**
.646**
% International Collaboration
-.502**
-.595**
Documents
.972**
.201*
Citable Documents
.973**
.199*
Citation (overall)
.757**
-.224**
Self-citation
.780**
-.165*
Cited Documents
.940**
0.121
% International Collaboration
**. Correlation is significant at the 0.01 level (2-tailed).
-.407**
.557**
ASEAN
TOP TEN
*. Correlation is significant at the 0.05 level (2-tailed).
Table 5. Kruskl Wallis test was applied to examine publication productivity among the top ten Malaysian
universities
Article
Conference
Review
Letter
university
Mean
SD
Mean
SD
Mean
SD
Mean
SD
University of Malaya
638
618
125
152
32
34
9
6
Universiti Sains Malaysia
570
609
131
160
19
24
4
4
Universiti Putra Malaysia
570
645
114
143
20
24
1
2
Universiti Kebangsaan Malaysia
416
509
188
287
14
20
2
3
Universiti Teknologi Malaysia
180
262
210
282
6
12
0
0
Universiti Teknologi MARA
103
153
150
281
4
7
0
1
International Islamic University
Malaysia
98
131
57
92
4
4
1
2
Multimedia University
111
100
89
87
4
5
0
0
Universiti Teknologi Petronas
51
98
85
155
2
4
0
0
Universiti Malaysia Perlis
32
58
43
70
1
2
0
0
Chi square
84
22
73
90
P value
<0.01
<0.01
<0.01
<0.01
Article
Conference
Review
Conference
.817**
Review
.894**
.717**
Letter
.746**
.488**
Spearman’s rho Correlation Coefficients
165
.741**
www.ccsenet.org/mas
Modern Applied Science
Vol. 8, No. 2; 2014
A
B
C
D
Figure 1. Comparison among ASEAN and World's Best Countries regarding self citation (A); Citation per
document (B); Un-cited documents (C); and International collaboration (D)
166
www.ccsenet.org/mas
Modern Applied Science
Vol. 8, No. 2; 2014
A
B
C
Figure 2. Publication trend in ASEAN countries and World's Best Countries (A); Publication trend in Malaysia
(B); Citation per document in Malaysia (C)
167
www.ccsenet.org/mas
Modern Applied Science
Vol. 8, No. 2; 2014
4. Discussion and Conclusion
In the current study, we made a comparison in Scopus database (SCImago) between ASEAN and the top 10
countries in the world regarding the relationship among economic growth, internet usage and publication
productivity from 1996 to 2011. In addition, we made a comparison among the first 10 Malaysian universities.
We used SJR, or SCImago Journal and Country Rank, as a measure of the scientific prestige of scholarly sources
derived from the Google Page Rank™ algorithm. It attempts to even out the differences in citation practice in
different subject fields and facilitate direct comparisons of sources. Furthermore, the SCImago Journal and
Country Rank portal displays journal and country scientific indicators developed from the information contained
in the Scopus® database. These indicators can be used to assess and analyze scientific domains.
Publication productivity could be a good indicator of research output and used to rank countries, research
institutes, or researchers in different fields (Liu & Cheng, 2005; Meho & Spurgin, 2005; Narin & Hamilton,
1996; Toutkoushian et al., 2003; Yazit & Zainab, 2007). The impact of a publication is assessed in terms of the
number of citations that it has received in relation to other outputs in the journal (Yi et al., 2008). However, the
number of times cited for an article is highly correlated with the length of time since its publication (Yi et al.,
2008). There was a significant difference (p < 0.01) between citation per document (Yi et al., 2008; Calver &
Bradley 2009) in ASEAN region (11.1 citation per document) and developed countries (17.7) (see Table 3).
Malaysia got 31.5 % and 57.1 % less citation per document in comparison with the average of citation per
document in ASEAN and top ten developed countries respectively. However, Malaysia had the highest
self-citation in this region with almost 24 % of all citations which were received during this period. The United
States had the highest number of publications as well as the highest self-citation (48%) in the world. Malaysia
had the least collaboration with the world in comparison with other ASEAN countries and it could be one of the
reasons for receiving less citation per document (Ale Ebrahim et al., 2013). Based on the literature, the mean
value of citation per publication of collaborative papers was higher than that of single country publications.
Publication trends in ASEAN countries with 10.1% growth are promising in comparison with the developed
countries studied in our research (2.3%). Figure 2 represents the publication trend and the number of
publications in Malaysia between 1996 and 2011. The number of publications increased dramatically after 2007
with 4783 to 18875 documents in 2011 (almost 4 times). However, the number of citations decreased rapidly
from 5.09 to 0.47 citations per document during these years (11times). One of the main reasons for the increase
in the number of publications in Malaysia could be focusing heavily on increasing the quality of research in its
research universities such as University of Malaya. Malaysia spends 1% of its gross domestic product on
development and research projects as determined in the 10th Malaysian Plan. Moreover, increasing the number
of PhD students and changing their program from conventional dissertations to paper-based dissertations (Its
requirement is publication in high peer-reviewed journals) could be another reason. The number of PhD students
in Malaysia has increased 10 times in recent years (from about 4,000 students in 2002 to almost 40,000 in 2012).
Table 5 shows the 10 first universities in Malaysia. The first top five universities have been chosen as research
universities and received additional government funding. Two third (68.8 %) of all Malaysian publications have
been produced by these research universities from 1996 to 2011.
Chemistry, Physics, and Astronomy are the first fields regarding the number of publications and citations.
Institutes that are working in these fields could publish more papers and get more citations. Malaysian
universities mostly work on Engineering and Medicine in comparison with the top universities located in the top
countries such as the United States.
Our findings in this study showed a positive and significant relationship between GDP and the number of
publications. This finding was similar to the previous researches that found positive and significant relationship
between education and economic growth (Mankiw et al., 1992; Barro, 1991; Bils & Klenow, 2000). Moreover, a
recent research study by Jin and Jin (2013) indicated that publication productivity in different fields has
dissimilar effects on economic growth. Surprisingly, for one variable i.e., international collaboration, we found
that there is a significant and negative relationship between international collaboration and the GDP in ASEAN
countries, while the number of people with access to the World Wide Web in developed countries had significant
and positive relationship with research collaboration projects. The countries with more economic growth like the
United States had less research collaboration with other counties.
Publication trends in ASEAN countries and especially in Malaysia (20.14 times increased) are encouraging in
comparison with the top ten developed countries. Nevertheless, these publications could not get reasonable
citations. Researchers, science managers, as well as policy makers should try to find different ways to increase
citation per document (Ale Ebrahim et al., 2013) such as improving the quality and visibility of their researches
168
www.ccsenet.org/mas
Modern Applied Science
Vol. 8, No. 2; 2014
and invest more on research studies whose outputs lead to more rapid economic growth.
Acknowledgements
The authors wish to extend their best gratitude to Mrs. Elham Sadat Yahyavi, and Mrs. Rezvan ...... for their kind
assistance in this project.
References
Aghaei Chadegani, A., Salehi, H., Md Yunus, M., Farhadi, H., Fooladi, M., Farhadi, M., & Ale Ebrahim, N.
(2013). A comparison between two main academic literature collections: Web of Science and Scopus
databases. Asian Social Science, 9(5), 18-26. http://dx.doi.org/10.5539/ass.v9n5p18
Ale Ebrahim, N., Salehi, H., Embi, M. A., Habibi, T. F., Gholizadeh, H., & Motahar, S. M. (2013). Effective
Strategies for Increasing Citation Frequency. International Education Studies, 6, 93-99.
http://dx.doi.org/10.5539/ies.v6n11p93
Anand, S., & Sen, A. (1994). Human development index: methodology and measurement. Human Development
Report Office (HDRO), United Nations Development Programme (UNDP).
Bar-Ilan, J. (2008). Which h-index?—A comparison of WoS, Scopus and Google Scholar. Scientometrics, 74(2),
257-271. http://dx.doi.org/10.1007/s11192-008-0216-y
Barro, R. J. (1991). Economic growth in a cross section of countries. The quarterly journal of economics, 106(2),
407-443. http://dx.doi.org/10.2307/2937943
Becker, G. S. (2009). Human capital: A theoretical and empirical analysis, with special reference to education.
University of Chicago Press.
Bils, M., & Klenow, P. J. (2000). Does schooling cause growth? American economic review, 1160-1183.
http://dx.doi.org/10.1257/aer.90.5.1160
Braun, T., Glänzel, W., & Schubert, A. (2006). A Hirsch-type index for journals. Scientometrics, 69(1), 169-173.
http://dx.doi.org/10.1007/s11192-006-0147-4
Brown, L. D., & Gardner, J. C. (1985). Using citation analysis to assess the impact of journals and articles on
contemporary accounting research (CAR). Journal of Accounting Research, 23(1), 84-109.
http://dx.doi.org/10.2307/2490908
Calver, M. C., & Bradley, J. S. (2009). Should we use the mean citations per paper to summarise a journal’s
impact or to rank journals in the same field? Scientometrics, 81(3), 611-615.
http://dx.doi.org/10.1007/s11192-008-2229-y
Falagas, M. E., Pitsouni, E. I., Malietzis, G. A., & Pappas, G. (2008). Comparison of PubMed, Scopus, web of
science, and Google scholar: strengths and weaknesses. The FASEB Journal, 22(2), 338-342.
http://dx.doi.org/10.1096/fj.07-9492LSF
Fooladi, M., Salehi, H., Md Yunus, M., Farhadi, M., Aghaei Chadegani, A., Farhadi, H., & Ale Ebrahim, N.
(2013). Does Criticisms Overcome the Praises of Journal Impact Factor? Asian Social Science, 9(5),
176-182. http://dx.doi.org/10.5539/ass.v9n5p176
Fox, M. F. (1983). Publication productivity among scientists: A critical review. Social Studies of Science, 13(2),
285-305. http://dx.doi.org/10.1177/030631283013002005
Gu, Y., & Zainab, A. N. (2001). Publication productivity of Malaysian researchers in the field of Computer
Science and Information Technology. Malaysian Journal of Library & Information Science, 6(1), 1-23.
Hart, R. L. (2000). Co-authorship in the academic library literature: a survey of attitudes and behaviors. The
Journal of Academic Librarianship, 26(5), 339-345. http://dx.doi.org/10.1016/S0099-1333(00)00140-3
Heeks, R., & Bailur, S. (2007). Analyzing e-government research: Perspectives, philosophies, theories, methods,
and
practice.
Government
Information
Quarterly,
24(2),
243-265.
http://dx.doi.org/10.1016/j.giq.2006.06.005
Jin, J. C., & Jin, L. (2013). Research publications and economic growth: evidence from cross-country
regressions. Applied Economics, 45(8), 983-990. http://dx.doi.org/10.1080/00036846.2011.613785
Joynt, R. L., & Leonard, J. A. (1980). Dantrolene sodium suspension in treatment of spastic cerebral palsy.
Developmental
Medicine
&
Child
Neurology,
22(6),
755-767.
http://dx.doi.org/10.1111/j.1469-8749.1980.tb03742.x
169
www.ccsenet.org/mas
Modern Applied Science
Vol. 8, No. 2; 2014
Kelly, J. C., Glynn, R. W., O’Briain, D. E., Felle, P., & McCabe, J. P. (2010). The 100 classic papers of
orthopaedic surgery a bibliometric analysis. Journal of Bone & Joint Surgery, British Volume, 92(10),
1338-1343. http://dx.doi.org/10.1302/0301-620X.92B10.24867
Lefaivre, K. A., & O’Brien, P. J. (2011). 100 most cited articles in orthopaedic surgery. Clinical Orthopaedics
and Related Research®, 469(5), 1487-1497. http://dx.doi.org/10.1007/s11999-010-1604-1
Liu, N. C., & Cheng, Y. (2005). The academic ranking of world universities. Higher education in Europe, 30(2),
127-136. http://dx.doi.org/10.1080/03797720500260116
Lucas Jr, R. E. (1988). On the mechanics of economic development. Journal of monetary economics, 22(1), 3-42.
http://dx.doi.org/10.1016/0304-3932(88)90168-7
Mankiw, N. G., Romer, D., & Weil, D. N. (1992). A contribution to the empirics of economic growth. The
quarterly journal of economics, 107(2), 407-437. http://dx.doi.org/10.2307/2118477
Meho, L. I., & Spurgin, K. M. (2005). Ranking the research productivity of library and information science
faculty and schools: An evaluation of data sources and research methods. Journal of the American Society
for Information Science and Technology, 56(12), 1314-1331. http://dx.doi.org/10.1002/asi.20227
Meho, L. I., & Yang, K. (2007). Impact of data sources on citation counts and rankings of LIS faculty: Web of
Science versus Scopus and Google Scholar. Journal of the American Society for Information Science and
Technology, 58(13), 2105-2125. http://dx.doi.org/10.1002/asi.20677
Narin, F., & Hamilton, K. S. (1996). Bibliometric performance measures. Scientometrics, 36(3), 293-310.
http://dx.doi.org/10.1007/BF02129596
Nelson, R. R., & Phelps, E. S. (1966). Investment in humans, technological diffusion, and economic growth. The
American Economic Review, 69-75.
Ponce, F. A., & Lozano, A. M. (2010). Highly cited works in neurosurgery. Part I: the 100 top-cited papers in
neurosurgical
journals:
A
review.
Journal
of
Neurosurgery,
112(2),
223-232.
http://dx.doi.org/10.3171/2009.12.JNS091599
Romer, P. M. (1990). Endogenous technological change. Journal of Political Economy, S71-S102.
http://dx.doi.org/10.1086/261725
Sarel, M. (1997). Growth and productivity in ASEAN countries: International Monetary Fund.
Schubert, A., & Glänzel, W. (2007). A systematic analysis of Hirsch-type indices for journals. Journal of
Informetrics, 1(3), 179-184. http://dx.doi.org/10.1016/j.joi.2006.12.002
Toutkoushian, R. K., Porter, S. R., Danielson, C., & Hollis, P. R. (2003). Using publications counts to measure
an institution's research productivity. Research in Higher Education, 44(2), 121-148.
http://dx.doi.org/10.1023/A:1022070227966
Uzun, A. (2002). Productivity ratings of institutions based on publication in Scientometrics, Informetrics, and
Bibliometrics, 1981-2000. Scientometrics, 53(3), 297-307. http://dx.doi.org/10.1023/A:1014864827441
Yazit, N., & Zainab, A. N. (2007). Publication productivity of Malaysian authors and institutions in LIS.
Malaysian Journal of Library and Information Science, 12.
Yi, H., Ao, X., & Ho, Y. S. (2008). Use of citation per publication as an indicator to evaluate pentachlorophenol
research. Scientometrics, 75(1), 67-80. http://dx.doi.org/10.1007/s11192-007-1849-y
Zain, Z. M., Ishak, R., & Ghani, E. K. (2009). The influence of corporate culture on organisational commitment:
A study on a Malaysian listed company. European Journal of Economics, Finance and Administrative
Sciences, 17(17), 16-26.
Copyrights
Copyright for this article is retained by the author(s), with first publication rights granted to the journal.
This is an open-access article distributed under the terms and conditions of the Creative Commons Attribution
license (http://creativecommons.org/licenses/by/3.0/).
170
Publication productivity, as measured by the number of papers, has been regarded as one of the main indicators of reputation of countries and institutions. Nevertheless, the relationship among research publications, economic growth and World Wide Web in ASEAN countries is still unclear. The main intention of this study was to identify publication productivity among ASEAN and the world’s top ten countries in the last 16 years (1996-2011). This study also aimed at finding the relationship among publication, gross domestic product (GDP) and internet usage. Furthermore, the publication trend in the 10 first Malaysian universities was evaluated for the same periods. Scopus database was used to find the overall documents, overall citations, citations per document and international collaboration from 1996 to 2011 for each country. The World Bank database (World Data Bank) was used to collect the data for GDP and the number of internet users. Moreover, to evaluate 10 top Malaysian universities, the number of published articles, conferences, reviews, and letters for the same periods was collected. The results of this study showed significant differences among ASEAN and top 10 countries regarding publication productivity. Moreover, a positive and significant relationship was observed between indices, GDP and internet usage for these countries. Surprisingly, international collaboration had a significant and negative relationship with economic growth. Malaysia had fewer citations per document (7.64) and international collaboration (36.9%) among ASEAN countries. In conclusion, international collaboration between academic institutes and researchers is influenced by economic growth and access to internet in the countries. Furthermore, publication trends in ASEAN countries are promising. However, policy makers and science managers should try to find different ways to increase the quality of the research publication and to raise citation per document.
© Copyright 2026 Paperzz