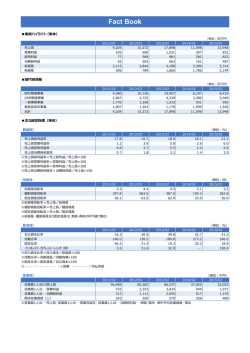
Fact Book 2009
http://www.marubun.co.jp/index.html
http://www.marubun.co.jp/ir/index.html (IR Website)
Contents
目次
1
Financial Highlights
財務ハイライト
2
Consolidated Net Sales
連結売上高
3
Selling, General and Administrative Expenses
販管費及び一般管理費
3
Number of Employees
従業員数
4
Profitability Indicators
収益性指標
4
Efficiency Indicators
効率性指標
5
Stability Indicators
安定性指標
5
Productivity Indicators
生産性指標
6
Performance Indicators
投資指標
7
Consolidated Balance Sheets
連結貸借対照表
8
Consolidated Statements of Income
連結損益計算書
9
Consolidated Statements of Cash Flows
連結キャッシュ・フロー計算書
10
Non-Consolidated Balance Sheets
単体貸借対照表
11
Non-Consolidated Statements of Income
単体損益計算書
12
Major Products of Electronic Devices
デバイス事業 主要取扱商品
13
Major Products of Electronic Systems
システム事業 主要取扱商品
14
History of Company Operations
沿革
14
Members Board
役員構成
15
Subsidiaries and Affiliates
関係会社
16
Stock Information
株式の状況
17
Shareholder Information
株主の状況
18
Corporate Information
会社概要
■ Financial Highlights 財務ハイライト
(Yen in Millions / 百万円)
Fiscal Year Ended
会計年度
2005
2006
2007
2008
2009
Net Sales
売上高
237,508
275,661
245,289
199,943
207,948
Gross Profit
売上総利益
23,108
25,589
22,318
18,961
16,933
Operating Income
営業利益
5,215
6,498
3,648
1,108
2,150
Ordinary Income
経常利益
5,050
6,280
2,956
49
1,035
Net Income
当期純利益
2,674
3,483
889
(1,399)
452
Net Income per Share (yen)
1株当り当期純利益(円)
98
130
33
Total Assets
総資産
117,636
131,573
117,338
105,583
110,665
Total Net Assets
純資産
33,215
38,584
38,046
34,686
35,819
Equity Ratio (%)
自己資本比率(%)
28.2%
27.3%
29.8%
30.3%
29.7%
Return on Equity (%)
自己資本利益率(%)
8.4%
10.1%
2.5%
-4.2%
1.4%
Return on Investment (%)
投下資本利益率(%)
8.4%
8.9%
4.5%
0.9%
2.3%
Number of Employees
期末従業員数
1,154
1,181
1,349
1,331
1,334
Operating Income
営業利益
(Yen in Millions 百万円)
Net Sales
売上高 (Yen in Millions 百万円)
7,000
7,000
240,000
5,600
5,600
180,000
4,200
4,200
120,000
2,800
2,800
1,400
1,400
0
0
0
2005 2006 2007 2008 2009
2005
2006
2007
2008
2005
2009
Net Income per share
1株当り当期純利益 (Yen 円)
Net Income
当期純利益 (Yen in Millions 百万円)
150
150,000
2,900
100
120,000
1,800
50
90,000
700
0
60,000
(400)
(50)
30,000
(100)
2005
2006
2007
2008
2009
2006
2007
2008
2009
Total Assets/Net Assets
総資産/純資産 (Yen in Millions 百万円)
4,000
(1,500)
17
Ordinary Income
経常利益 (Yen in Millions 百万円)
300,000
60,000
(54)
0
2005
2006
2007
-1-
2008
2009
2005
2006
2007
2008
2009
■ Consolidated Net Sales 連結売上高
Consolidated Net Sales 連結売上高
(Yen in Millions / 百万円)
Fiscal Year Ended
Electronic Devices
Electronic Systems
Total Net Sales
会計年度
デバイス事業
システム事業
合計
2005
201,585
35,923
237,508
2006
234,408
41,252
275,661
2007
205,309
39,979
245,289
2005
181,681
41,578
20,003
100,526
14,879
5,152
(457)
19,903
16,840
3,063
201,585
2006
211,162
47,211
25,380
102,267
27,764
9,268
(728)
23,245
19,526
3,719
234,408
2007
180,853
44,738
19,568
79,688
20,625
16,131
103
24,457
21,142
3,315
205,309
2005
2,954
12,324
1,223
4,189
3,893
11,339
35,923
2006
3,765
13,540
3,231
3,006
3,678
14,032
41,252
2007
4,012
13,291
2,719
3,153
4,476
12,328
39,979
2008
160,791
39,151
199,943
2009
174,710
33,238
207,948
Electronic Devices デバイス事業
(Yen in Millions / 百万円)
Fiscal Year Ended
Semiconductors
General-Use IC
Memory IC
Special-Use IC
Custom IC
Discrete
Other
Electronic Components
Electrical & Electronic parts
Board Computer, etc.
Total Electronic Devices
会計年度
半導体
汎用IC
メモリーIC
特定用途IC
カスタムIC
ディスクリート
その他
一般部品
電子・電気部品
ボードコンピュータほか
デバイス事業計
2008
141,066
37,443
10,666
74,396
12,323
6,114
124
19,726
17,441
2,285
160,791
2009
135,380
29,011
12,545
79,358
11,047
3,384
33
39,330
37,631
1,700
174,710
Electronic Systems システム事業
(Yen in Millions / 百万円)
Fiscal Year Ended
Space & Defense Electronics
Measurement & Inspection Equipment
Scientific Equipment
Laser Equipment
Communication & Network Equipment
Medical Equipment
Total Electronic Systems
会計年度
航空宇宙機器
試験計測機器
科学機器
レーザ機器
情報機器
医用機器
システム事業計
Net Sales of Electronic Devices
デバイス事業売上高 (Yen in Millions 百万円)
250,000
2008
6,674
12,469
3,348
5,323
11,336
39,151
2009
5,545
9,016
2,118
2,744
13,815
33,238
Net Sales of Electronic Systems
システム事業売上高 (Yen in Millions 百万円)
50,000
Electronic Components
一般部品
Other その他
200,000
Medical Equip 医用機器
40,000
C&N Equip 情報機器
Discrete ディスクリート
150,000
30,000
Laser Equip レーザ機器
Custom IC カスタムIC
100,000
Special-Use IC 特定用途IC
Scientific Equip科学機器
20,000
Measurement & Inspection Equip
試験計測機器
Space&Defense 航空宇宙機器
Memory IC メモリーIC
50,000
General-Use IC 汎用IC
10,000
0
0
2005 2006 2007 2008 2009
2005 2006 2007 2008 2009
-2-
Sales by Geographic Segments 所在地別売上高
(Yen in Millions / 百万円)
会計年度
日本
アジア
合計
Fiscal Year Ended
Japan
Asia
Total
2005
193,143
44,365
237,508
2006
219,878
55,782
275,661
2007
182,157
63,132
245,289
2008
155,200
44,742
199,943
2009
166,868
41,080
207,948
2005
49,805
48,700
1,104
2006
59,575
58,897
677
2007
67,778
67,176
602
2008
49,491
49,331
160
2009
53,225
53,177
47
21.0%
21.6%
27.6%
24.8%
25.6%
Net Sales to Overseas Customers 海外売上高
(Yen in Millions / 百万円)
会計年度
海外売上高
アジア
その他の地域
Fiscal Year Ended
Net Sales to Overseas Customers
Asia
Others
Ratio of Net Sales to Overseas
Customers
連結売上高に占める海外売上高の割合
Note:
Ratio of Net Sales to Overseas Customers = Net Sales to Overseas Customers/Net Sales 海外売上高比率=海外売上高÷売上高
■ Selling, General and Administrative Expenses 販管費及び一般管理費
(Yen in Millions / 百万円)
会計年度
人件費
その他販管費
販管費合計
売上高販管費率
Fiscal Year Ended
Personnel Expenses
Other Expenses
Total SGA
SGA Ratio(%)
2005
9,461
8,432
17,893
7.5%
2006
10,250
8,840
19,091
6.9%
2007
10,269
8,402
18,670
7.6%
2008
10,523
7,328
17,852
8.9%
2009
9,234
5,549
14,783
2007
1,349
2008
1,331
2009
1,334
7.1%
Note:
SGA Ratio = Selling, General and Administrative Expenses/Net Sales 販管費比率=販管費÷売上高
■ Number of Employees 従業員数
会計年度
期末従業員数
Fiscal Year Ended
Number of Employees
2005
1,154
Sales by Geographic Segments
所在地別売上高 (Yen in Millions 百万円)
2006
1,181
Ratio of Net Sales to Overseas Customers
(%)
海外売上高比率 300,000
50
250,000
40
Asia アジア
200,000
30
Japan 日本
150,000
20
100,000
10
50,000
0
0
2005
2005
2006
2007
2008
SGA Ratio
売上高販管費率 2006
2007
2008
2009
2009
Number of Employees
従業員数 (%)
10
(人)
1,500
8
1,200
6
900
4
600
2
300
0
2005
2006
2007
2008
0
2009
2005
-3-
2006
2007
2008
2009
■ Profitability Indicators
収益性指標
Fiscal Year Ended
Gross Profit Margin
Operating Profit Margin
Ordinary Profit Margin
Net Profit Margin
Return on Total Assets(Ordinary Income)
Return on Total Assets(Net Income)
Return on Equity
Return on Investment
会計年度
売上高総利益率
売上高営業利益率
売上高経常利益率
売上高当期純利益率
総資産経常利益率
総資産当期純利益率
自己資本利益率
投下資本利益率
(%)
2005
9.7
2.2
2.1
1.1
4.8
2.6
8.4
8.4
2006
9.3
2.4
2.3
1.3
5.0
2.8
10.1
8.9
2007
9.1
1.5
1.2
0.4
2.4
0.7
2.5
4.5
2008
9.5
0.6
0.0
(0.7)
0.0
(1.3)
(4.2)
0.9
2009
8.1
1.0
0.5
0.2
1.0
0.4
1.4
2.3
Note:
1. Gross Profit Margin = Gross Profit/Net Sales
2. Operating Profit Margin = Operating Income/Net Sales
3. Ordinary Profit Margin = Ordinary Income/Net Sales
4. Net Profit Margin = Net Income/Net Sales
5. Return on Total Assets(Ordinary Income) = Ordinary Income/Total Assets(Yearly Average)
6. Return on Total Assets (Net Income)= Net Income/Total Assets(Yearly Average)
7. Return On Equity = Net Income(Loss)/Shareholders' Equity(Yearly Average)
8. Return On Investment = EBIT/Invested Capital(Yearly Average)
9. EBIT = Ordinary Income + Interest Expenses
10. Invested Capital = Interest-bearing Debts + Shareholder's Equity
■ Efficiency Indicators
効率性指標
Fiscal Year Ended
Total Assets Turnover
Accounts Receivable Turnover
Inventories Turnover
Accounts Payable Turnover
会計年度
総資産回転率
売上債権回転率
棚卸資産回転率
仕入債務回転率
1. 売上高総利益率=売上総利益÷売上高
2. 売上高営業利益率=営業利益÷売上高
3. 売上高経常利益率=経常利益÷売上高
4. 売上高当期純利益率=当期純損益÷売上高
5. 総資産経常利益率=経常利益÷前当期末平均総資産
6. 総資産当期純利益率=当期純利益÷前当期末平均総資産
7. 自己資本利益率=当期純損益÷前当期末平均自己資本
8. 投下資本利益率=EBIT÷前当期末平均投下資本
9. EBIT =経常利益+支払利息
10. 投下資本=有利子負債+自己資本
(times 回)
2005
2006
2007
2008
2009
2.27
4.36
10.15
6.58
2.21
4.18
9.16
6.73
1.97
3.77
7.59
6.35
1.79
3.83
7.30
5.73
1.92
4.32
10.58
5.98
Note:
1.
2.
3.
4.
1. Total Assets Turnover = Net Sales/Total Assets(Yearly Average)
2. Accounts Receivable Turnover = Net Sales/Accounts Receivable(Yearly Average)
3. Inventories Turnover = Net Sales/Inventories(Yearly Average)
4. Accounts Payable Turnover = Purchase/Accounts Payable(Yearly Average)
Gross Profit Margin
売上高総利益率 総資産回転率=売上高÷前当期末平均総資産
売上債権回転率=売上高÷前当期末平均売上債権
棚卸資産回転率=売上高÷前当期末平均棚卸資産
仕入債務回転率=仕入高÷前当期末平均仕入債務
Net Profit Margin
売上高当期純利益率 Ordinary Profit Margin
売上高経常利益率
(%)
(%)
15.0
3.0
2.0
12.0
2.2
1.4
9.0
1.4
0.8
6.0
0.6
0.2
3.0
(0.2)
(0.4)
0.0
(1.0)
(1.0)
2005
2006
2007
2008
2009
2005
Return on Total Assets
(Ordinary Income)
総資産経常利益率 (%)
2006
2007
2008
Return on Equity
自己資本利益率 2009
2005
(%)
Return on Investment
投下資本利益率 (%)
10.0
10.0
10.0
7.0
7.0
8.0
4.0
4.0
6.0
1.0
1.0
4.0
(2.0)
(2.0)
2.0
(5.0)
(5.0)
2005
2006
2007
2008
2009
(%)
2006
2007
2008
2009
0.0
2005
2006
2007
-4-
2008
2009
2005
2006
2007
2008
2009
■ Stability Indicators
安定性指標
Fiscal Year Ended
Equity Ratio
Debt-to-Equity Ratio
Current Ratio
Fixed Assets Ratio
Interest Coverage (times)
会計年度
自己資本比率
有利子負債比率
流動比率
固定比率
インタレストカバレッジ(倍)
(%)
2005
28.2
101.3
130.8
49.8
16.78
2006
27.3
132.6
133.9
43.7
10.86
2007
29.8
103.4
143.7
37.0
5.49
2006
236.1
5.6
3.0
2007
193.9
2.9
0.7
2008
30.3
112.6
211.1
41.3
1.99
2009
29.7
106.3
195.1
34.8
3.82
Note:
1. Equity Ratio = Shareholders' Equity/Total Assets
自己資本比率=自己資本÷総資産
2. Debt-to-Equity Ratio = Interest-bearing Debts/Shareholders' Equity
有利子負債比率=有利子負債額÷自己資本
3. Current Ratio = Current Assets/Current Liabilities
流動比率=流動資産÷流動負債
4. Fixed Assets Ratio = Noncurrent Assets/Shareholders' Equity
固定比率=固定資産÷自己資本
5. Interest Coverage = (Operating Income + Interest and Dividends Earned)/Interest Expenses
インタレスト・カバレッジ=(営業利益+受取利息及び配当金)÷支払利息
■ Productivity Indicators 生産性指標
(Yen in Millions / 百万円)
会計年度
1人当り売上高
1人当り営業利益
1人当り当期純利益
Fiscal Year Ended
Net Sales per Head
Operating Income per Head
Net Income per Head
2005
218.0
4.8
2.5
2008
149.2
0.8
(1.0)
2009
156.1
1.6
0.3
Note:
1. Net Sales per Head = Net Sales/Number of Employees(Fiscal Year-end)
1人当り売上高=売上高÷前当期末平均従業員数
2. Operating Income per Head = Operating Income/Number of Employees(Fiscal Year-end)
1人当り営業利益=営業利益÷前当期末平均従業員数
3. Net Income per Head = Net Income/Number of Employees(Fiscal Year-end)
1人当り当期純利益=当期純利益÷前当期末平均従業員数
Equity Ratio
自己資本比率 Debt-to-Equity Ratio
有利子負債比率 (%)
(%)
250.0
150.0
40.0
Current Ratio
流動比率 (%)
200.0
30.0
100.0
150.0
20.0
100.0
50.0
10.0
50.0
0.0
0.0
0.0
2005
2006
2007
2008
2005
2009
200
2007
2008
2005
2009
Operationg Income per Head
1人当り営業利益 (Yen in Millions 百万円)
Net Sales per Head
1人当り売上高 (Yen in Millions 百万円)
250
2006
2006
2007
2008
2009
Net Income/Loss per Head
1人当り当期純利益 (Yen in Millions 百万円)
6.0
4.0
5.0
3.0
4.0
2.0
3.0
1.0
2.0
0.0
1.0
(1.0)
150
100
50
0
0.0
2005
2006
2007
2008
2009
(2.0)
2005
2006
2007
-5-
2008
2009
2005
2006
2007
2008
2009
■ Performance Indicators 投資指標
Fiscal Year Ended
Net Income per Share (yen)
Net Assets per Share (yen)
Cash Dividends per Share (yen)
Payout Ratio (%)
Dividends On Net Assets (%)
Price Earning Ratio (times)
Price Book-value Ratio(times)
会計年度
1株当り当期純利益(円)
1株当り純資産(円)
1株当り配当額(円)
配当性向(%)
純資産配当率(%)
株価収益率(倍)
株価純資産倍率(倍)
2005
98.08
1,239.47
23.00
23.0
1.9
18.15
1.44
2006
129.75
1,332.98
30.00
23.2
2.3
12.52
1.22
2007
33.36
1,339.15
18.00
54.0
1.3
15.17
0.38
2008
2009
(53.56)
17.32
1,223.22 1,258.17
8.00
8.00
46.2
0.5
0.6
(4.07)
32.68
0.18
0.45
Note:
1. Net Income per Share = Net Income/Number of Shares Outstanding(Yearly Average)
1株当り当期純利益=当期純利益÷期中平均株式数
2. Net Assets per Share = Net Aseets/(Number of Shares Outstandin-treasury stock)
1株当り純資産=純資産÷(期末発行済株式数-自己株式数)
3. Payout Ratio = Cash Dividends/Net Income per Share
配当性向=1株当り配当金額÷1株当り当期純利益
4. Dividends On Net Assets = Cash Dividends/Net Aseets
純資産配当率=配当金額÷純資産
5. Price Earning Ratio=Share Price/Net Income per Share
株価収益率(PER)=株価÷1株当り当期純利益
6. Price Book-value Ratio=Share Price/Nets Assets per Share
株価純資産倍率(PBR)=株価÷1株当り純資産
Net Income per Share
1株当り当期純利益
(Yen 円)
200
Net Assets per Share
1株当り純資産 Payout Ratio
配当性向 (Yen 円)
1,600
60.0
1,200
40.0
800
20.0
400
0.0
(%)
100
0
(100)
(20.0)
0
2005
2006
2007
2008
2009
2005
2006
2007
2008
2005
2009
2.5
40.0
2.0
30.0
1.5
20.0
1.0
10.0
2007
Price Book-Value Ratio
株価純資産倍率 Price Earning Ratio
株価収益率 (Times 倍)
Dividends on Net Assets
総資産配当率 (%)
2006
2008
2009
(Times 倍)
1.5
1.0
0.5
0.5
0.0
0.0
0.0
(10.0)
2005
2006
2007
2008
2009
2005
2006
2007
-6-
2008
2009
2005
2006
2007
2008
2009
■ Consolidated Balance Sheets
連結貸借対照表
Fiscal Year Ended
Assets
Current assets
Cash and deposits
Notes and accounts receivable-trade
Short-term investment securities
Inventories
Merchandise and finished goods
Work in process
Deferred tax assets
Other
Allowance for doubtful accounts
Noncurrent assets
Property, plant and equipment
Buildings and structures
Land
Other
Intangible assets
Investments and other assets
Investment securities
Real estate for investment
Deferred tax assets
Other
Total assets
会計年度
資産の部
流動資産
現金及び預金
受取手形及び売掛金
有価証券
たな卸資産
商品及び製品
仕掛品
繰延税金資産
その他の流動資産
貸倒引当金
固定資産
有形固定資産
建物及び構築物
土地
その他の有形固定資産
無形固定資産
投資その他の資産
投資有価証券
投資不動産
繰延税金資産
その他の投資
資産合計
Liabilities and net assets
Current liabilities
Notes and accounts payable-trade
Short-term Loans Payable
Current portion of bonds
Deferred tax liabilities
Provision for bonuses
Other
Noncurrent liabilities
Bonds payable
Bonds with subscription rights to shares
Long-term loans payable
Provision for retirement benefits
Provision for directors' retirement benefits
Deferred tax liabilities
Other
Total liabilities
Minority interest
Capital stock
Capital surplus
Retained earnings
Valuation difference on available-for-sale securities
Foreign currency translation adjustments
Treasury stock
Total shareholders' equity
Total liabilities, minority interest and shareholder's equity
Shareholders' equity
Capital stock
Capital surplus
Retained earnings
Treasury stock
Valuation and translation adjustments
Valuation difference on available-for-sale securities
Foreign currency translation adjustments
Deferred gains or losses on hedges
Minority interests
Total net assets
Total liabilities and net assets
負債及び純資産の部
流動負債
支払手形及び買掛金
短期借入金
一年内償還予定社債
繰延税金負債
賞与引当金
その他の流動負債
固定負債
社債
新株予約権付社債
長期借入金
退職給付引当金
役員退職慰労引当金
繰延税金負債
その他の固定負債
負債合計
少数株主持分
資本金
資本剰余金
利益剰余金
その他有価証券評価差額金
為替換算調整勘定
自己株式
資本合計
負債、少数株主持分及び資本合計
株主資本
資本金
資本剰余金
利益剰余金
自己株式
評価・換算差額等
その他有価証券評価差額金
為替換算調整勘定
繰延ヘッジ損益
少数株主持分
純資産合計
負債純資産合計
(Yen in Millions / 百万円)
-7-
2005
2006
101,079
8,876
63,209
115,899
7,372
68,578
-
26,537
627
1,874
(45)
16,556
5,799
2,134
2,987
677
2,277
8,479
3,188
1,983
935
2,371
117,636
77,291
41,707
30,635
2008
2009
104,390
92,378
99,204
7,451
20,971
25,588
61,536
42,817
53,370
17
33,624
31,003
- 23,756
15,535
16
16
678
1,875
1,233
1,709
5,683
2,552
3,632
3,015
(38)
(48)
(32)
(29)
15,673
12,948
13,205
11,460
5,513
5,195
4,982
4,675
1,972
1,817
1,710
1,572
2,695
2,546
2,528
2,528
844
831
742
573
1,656
1,093
997
620
8,504
6,659
7,225
6,165
3,192
2,130
1,201
1,513
1,383
1,301
1,217
1,169
1,317
441
2,114
1,431
2,610
2,786
2,691
2,050
131,573 117,338 105,583 110,665
86,570
34,707
46,575
848
4,099
4,787
1,000
2007
883
4,405
6,417
1,000
4,000
72,658
34,734
34,919
48
2
936
2,016
6,633
1,217
4,000
43,760
25,932
14,778
48
3
543
2,452
27,136
1,168
4,000
20,000
1,129
566
50,845
35,233
12,284
1,048
588
1,691
23,999
119
2,000
21,500
685
625
620
1,578
437
483
528
551
66
50
5
598
258
261
272
250
82,079
92,988
79,292
70,897
74,845
2,340
6,214
6,351
20,680
971
48
(1,051)
33,215
117,636
- 34,976
34,857
33,097
33,471
6,214
6,214
6,214
6,214
6,354
6,353
6,353
6,353
- 23,358
23,924
22,158
22,533
(950)
(1,634)
(1,629)
(1,630)
906
136
(1,125)
(587)
762
173
(124)
97
129
6
(862)
(735)
14
(43)
(138)
50
2,701
3,052
2,715
2,935
- 38,584
38,046
34,686
35,819
- 131,573 117,338 105,583 110,665
■ Consolidated Statements of Income 連結損益計算書
(Yen in Millions / 百万円)
Fiscal Year Ended
Net sales
Electronic Devices
Electronic Systems
Cost of sales
Gross profit
Electronic Devices
Electronic Systems
Selling, general and administrative expenses
Personnel Expenses
Other
Operating income
Non-operating income
Interest income
Dividends income
Equity in earnings of affiliates
Rent of real estate for investment
Foreign exchange gains
Other
Non-operating expenses
Interest expenses
Rent expenses on real estate for investment
Foreign exchange losses
Other
Ordinary income
Extraordinary income
Gain on sales of noncurrent assets
Gain on sales of investment securities
Reversal of allowance for doubtful accounts
Other
Extraordinary loss
Loss on sales and retirement of noncurrent
assets
決算期
Loss on valuation of investment securities
Other
Income before income taxes and minority interests
Income taxes-current
Income taxes-deferred
Minority interests in income
Net income
投資有価証券評価損
その他
税金等調整前当期純利益
法人税、住民税及び事業税
法人税等調整額
少数株主利益
当期純利益
Number of employees (Fiscal year-end)
期末従業員数
2005
売上高
デバイス事業
システム事業
売上原価
売上総利益
デバイス事業
システム事業
販売費及び一般管理費
人件費
その他
営業利益
営業外収益
受取利息
受取配当金
持分法による投資利益
投資不動産賃貸料
為替差益
その他
営業外費用
支払利息
投資不動産賃貸費用
為替差損
その他
経常利益
特別利益
固定資産売却益
投資有価証券売却益
貸倒引当金戻入額
その他
特別損失
2006
2007
2008
2009
237,508
201,585
35,923
214,400
23,108
17,509
5,599
17,893
9,461
8,432
5,215
623
19
19
139
271
275,661 245,289 199,943 207,948
234,408 205,309 160,791 174,710
41,252
39,979
39,151
33,238
250,071 222,970 180,981 191,014
25,589
22,318
18,961
16,933
19,392
16,362
12,783
11,911
6,197
5,955
6,177
5,022
19,091
18,670
17,852
14,783
10,250
10,269
10,523
9,234
8,840
8,402
7,328
5,549
6,498
3,648
1,108
2,150
856
707
588
429
27
41
32
25
24
36
36
24
216
240
158
57
168
220
218
181
259
172
159
170
142
139
787
1,073
1,399
1,648
1,544
313
603
679
591
576
138
143
127
123
127
85
251
520
648
250
325
341
413
192
5,050
6,280
2,956
49
1,035
71
362
7
115
151
1
0
94
0
0
109
6
8
2
64
361
7
11
39
36
534
814
1,468
223
固定資産売却及び除却損
-8-
10
38
0
26
5,085
2,137
(86)
360
2,674
1
493
6,108
2,647
(312)
290
3,483
1,154
1,181
95
7
710
2,149
741
114
403
889
1,349
17
20
576
875
(1,303)
656
(902)
341
(1,399)
17
186
962
309
(58)
259
452
1,331
1,334
■ Consolidated Statements of Cash Flows 連結キャッシュ・フロー計算書
(Yen in Millions / 百万円)
Fiscal Year Ended
Ⅰ Net cash provided by (used in) operating activities
Income before income taxes and minority interests
Depreciation and amortization
Amortization of consolidation adjustments
Amortization of goodwill
Increase (decrease) in allowance for doubtful accounts
Increase (decrease) in provision for bonuses
Increase (decrease) in provision for directors' retirement
benefits
Increase (decrease) in provision for retirement benefits
Interest and dividends income
Interest expenses
Foreign exchange losses (gains)
Equity in (earnings) losses of affiliates
Loss on valuation of investment securities
Decrease (Increase) in notes and accounts receivable-trade
Decrease (increase) in inventories
Increase (decrease) in notes and accounts payable-trade
Directors' bonuses
Other, net
Sub total
Interest and dividends income received
interest expenses paid
Income taxes paid
Income taxes refund
Net cash provided by (used in) operating activities
Ⅱ Net cash provided by (used in) investment activities
Payments into time deposits
Proceeds from withdrawal of time deposits
Purchase of property, plant and equipment
Purchase of intangible assets
Purchase of investment securities
Payment for transfer of business
Other, net
Net cash provided by (used in) investment activities
Ⅲ Net cash provided by (used in) financing activities
Increase in short-term loans payable
Decrease in short-term loans payable
Proceeds from long-term loans payable
Repayment of long-term loans payable
Proceeds from issuance of bonds
Redemption of bonds
Proceeds from issuance of bonds with subscription rights to
shares
Redemption of bonds with subscription rights to shares
Purchase of treasury stock
Cash dividends paid
Other, net
Net cash provided by (used in) financing activities
Ⅳ Effect of exchange rate changes on cash and cash equivalents
Ⅴ Net increase(decrease) in cash and cash equivalents
Ⅵ Cash and cash equivalents at beginning of period
Ⅶ Increase in cash and cash equivalents
from newly consolidated subsidiary
Ⅷ Cash and cash equivalents at end of period
会計年度
Ⅰ 営業活動によるキャッシュ・フロー
税金等調整当期純利益
減価償却費
連結調整勘定償却額
のれん償却額
貸倒引当金の増減額
賞与引当金の増減額
役員退職慰労引当金の増減額
退職給付引当金の増減額
受取利息及び受取配当金
支払利息
為替差損益
持分法による投資損益
投資有価証券評価損益
売上債権の増減額
たな卸資産の増減額
仕入債務の増減額
役員賞与
その他
小計
利息及び配当金の受取額
利息の支払額
法人税等の支払額
法人税等の還付額
営業活動によるキャッシュ・フロー
Ⅱ 投資活動によるキャッシュ・フロー
定期預金の預入による支出
定期預金の払戻による収入
有形固定資産の取得による支出
無形固定資産の取得による支出
投資有価証券の取得による支出
営業譲受による支出
その他
投資活動によるキャッシュ・フロー
Ⅲ 財務活動によるキャッシュ・フロー
短期借入れによる収入
短期借入金の返済による支出
長期借入れによる収入
長期借入金の返済による支出
社債の発行による収入
社債の償還による支出
2005
2006
2007
5,085
929
108
6,108
1,069
2,149
1,000
(9)
63
108
(7)
34
105
10
24
8
46
33
-9-
-
2009
(1,303)
726
108
(8)
(393)
37
962
709
108
(3)
45
(14)
(129)
(60)
(31)
509
449
(39)
(52)
(77)
(69)
(50)
313
603
679
591
576
(33)
(7)
51
49
67
(56)
(165)
(129)
(47)
(28)
0
1
7
576
17
(12,403) (5,309) 7,130 16,962 (10,489)
(4,137) (7,061) 2,576
6,558
8,255
13,325 (7,150)
311 (7,566) 9,354
(33)
(50)
(1,023) (3,460) 2,758 (1,011)
33
1,969 (15,352) 16,599 15,718
9,993
37
51
77
69
49
(305)
(585)
(674)
(597)
(582)
(1,418) (2,588) (2,359)
(877)
(376)
272
104
284 (18,475) 13,643 14,585
9,188
(835)
611
(449)
(739)
(89)
365
(1,136)
(415)
1,935
(296)
(173)
(341)
386
1,095
(400)
450
(462)
(116)
(21)
235
(314)
(283)
(281)
(21)
(2)
321
(267)
(580)
1,000
(169)
(45)
(18)
388
573
23,197 20,424 11,183
5,149 15,024
(21,010) (6,491) (20,838) (24,931) (17,532)
- 20,000
1,500
(1,000)
- (2,000)
1,000
(48)
(48)
(48)
新株予約権付社債の発行による収入
新株予約権付社債の償還による支出
自己株式の取得による支出
配当金の支払額
その他
財務活動によるキャッシュ・フロー
Ⅳ 現金及び現金同等物に係る換算差額
Ⅴ 現金及び現金同等物の増減額
Ⅵ 現金及び現金同等物の期首残高
Ⅶ 新規連結に伴う現金及び現金同等物
の増加額
Ⅷ 現金及び現金同等物の期末残高
2008
-
4,000
-
-
-
- (4,000)
(210)
(694)
(0)
(536)
(670)
(807)
(366)
(79)
131
103
(57)
(94)
(86)
1,572 17,366 (13,261)
(291) (5,223)
144
29
(119)
(505)
(2)
864
15
(51) 13,519
4,535
3,974
6,406
6,422
6,551 20,071
1,567
6,406
6,422
181
6,551
20,071
24,607
■ Non-Consolidated Balance Sheet 単体貸借対照表
(Yen in Millions / 百万円)
Fiscal Year Ended
Assets
Current assets
Cash and deposits
Notes receivable-trade
Accounts receivable-trade
Short-term investment securities
Marchandise
Advance payments-trade
Deferred tax assets
Other
Allowance for doubtful accounts
Noncurrent assets
Property, plant and equipment
Buildings and structures
Land
Other
Intangible assets
Goodwill
Other
Investments and other assets
Investment securities
Stocks of subsidiaries and affiliates
Real estate for investment
Deferred tax assets
Other
Total assets
会計年度
Liabilities and net assets
Current liabilities
Notes payable-trade
Accounts payable-trade
Short-term loans payable
Current portion of long-term loans payable
Current portion of bonds
Provision for bonuses
Other
Noncurrent liabilities
Bonds payable
Bonds with subscription rights to shares
Long-term loans payable
Provision for retirement benefits
Provision for directors' retirement benefits
負債及び純資産の部
流動負債
支払手形
買掛金
短期借入金
1年内返済予定の長期借入金
1年内償還予定の社債
賞与引当金
その他の流動負債
固定負債
社債
新株予約権付社債
長期借入金
退職給付引当金
役員退職慰労引当金
その他の固定負債
負債合計
資本金
資本剰余金
利益剰余金
その他有価証券評価差額金
自己株式
資本合計
負債及び資本合計
株主資本
資本金
資本剰余金
利益剰余金
自己株式
評価・換算差額等
その他有価証券評価差額金
繰延ヘッジ損益
純資産合計
負債純資産合計
Other
Total liabilities
Capital stock
Capital surplus
Retained earnings
Valuation difference on available-for-sale securities
Treasury stock
Total shareholders' equity
Total liabilities and shareholders' equity
Shareholders' equity
Capital stock
Capital surplus
Retained earnings
Treasury stock
Valuation and translation adjustments
Valuation difference on available-for-sale securities
Deferred gains or losses on hedges
Total net assets
Total liabilities and net assets
資産の部
流動資産
現金及び預金
受取手形
売掛金
有価証券
商品
前渡金
繰延税金資産
その他の流動資産
貸倒引当金
固定資産
有形固定資産
建物
土地
その他の有形固定資産
無形固定資産
営業権
その他の無形固定資産
投資その他の資産
投資有価証券
関係会社株式
投資不動産
繰延税金資産
その他の投資
資産合計
- 10 -
2005
2006
2007
2008
2009
75,192
4,258
1,740
45,403
86,908
1,893
1,691
51,225
58,049
12,706
689
26,446
62,329
19,053
1,060
30,767
21,910
26,385
689
2,258
433
427
773
3,028
(17)
(1)
16,052
16,675
4,611
4,342
1,676
1,541
2,300
2,007
634
792
1,951
1,393
42
1,951
1,350
9,489
10,939
2,609
2,622
2,086
2,086
2,322
1,383
896
1,226
1,576
3,621
91,245 103,583
69,337
1,800
844
39,595
17
23,379
964
1,602
1,146
(13)
14,080
3,996
1,379
1,857
759
901
32
869
9,182
1,742
2,154
1,301
323
3,660
83,418
14,071
2,108
868
1,169
(11)
14,687
3,838
1,300
1,840
697
891
23
867
9,957
956
2,154
1,217
1,948
3,681
72,737
7,337
1,095
1,496
1,528
(9)
10,998
3,548
1,180
1,840
527
618
12
606
6,830
1,107
2,149
1,169
1,354
1,049
73,327
57,974
1,428
25,424
27,500
48,885
1,959
13,735
31,000
20,061
1,365
6,945
9,600
24,966
1,433
12,437
8,650
628
2,993
4,618
1,000
-
67,255
2,412
17,476
41,800
2,000
-
644
2,922
6,239
1,000
4,000
2,000
666
597
367
401
584
240
62,593
73,494
6,214
6,351
16,335
801
(1,051)
28,651
91,245
- 29,456
6,214
6,354
- 17,838
(950)
632
617
14
- 30,089
- 103,583
661
1,528
6,183
1,000
4,000
530
412
240
55,068
267
1,882
26,705
1,000
4,000
20,000
1,007
440
256
46,766
1,000
354
1,089
22,025
20,000
1,402
408
213
46,991
-
-
-
28,293
6,214
6,353
17,359
(1,634)
56
100
(43)
28,349
83,418
26,117
6,214
6,353
15,178
(1,629)
(146)
(122)
(23)
25,970
72,737
26,247
6,214
6,353
15,309
(1,630)
88
38
50
26,335
73,327
■ Non-Consolidated Statements of Income 単体損益計算書
(Yen in Millions / 百万円)
Fiscal Year Ended
Net sales
Electronic Devices
Electronic Systems
Cost of sales
Gross profit
Electronic Devices
会計年度
2005
Other
Operating income
Non-operating income
Interest income
Dividends income
Rent of real estate for investment
Foreign exchange gains
Other
Non-operating expenses
Interest expenses
Rent expenses on real estate for investment
Foreign exchange losses
Other
Ordinary income
Extraordinary income
Gain on sales of noncurrent assets
Gain on sales of investment securities
Reversal of allowance for doubtful accounts
Other
Extraordinary loss
Loss on sales and retirement of noncurrent assets
Loss on valuation of investment securities
Other
Income before income taxes
Income taxes-current
Income taxes-deferred
Net income
売上高
デバイス事業
システム事業
売上原価
売上総利益
デバイス事業
システム事業
販売費及び一般管理費
人件費
その他
営業利益
営業外収益
受取利息
受取配当金
投資不動産賃貸料
為替差益
その他
営業外費用
支払利息
投資不動産賃貸費用
為替差損
その他
経常利益
特別利益
固定資産売却益
投資有価証券売却益
貸倒引当金戻入額
その他
特別損失
固定資産売却及び除却損
投資有価証券評価損
その他
税引前当期純利益
法人税、住民税及び事業税
法人税等調整額
当期純利益
Number of employees (Fiscal year-end)
期末従業員数
Electronic Systems
Selling, general and administrative expenses
Personnel Expenses
2007
2008
2009
174,197
156,057
18,139
157,012
17,184
13,911
3,272
13,531
6,731
6,800
3,653
510
3
46
287
203,501 162,745 131,346 115,215
183,279 143,134 111,826 102,638
20,221
19,610
19,520
12,576
184,858 147,567 118,648 103,956
18,642
15,178
12,698
11,258
15,129
11,783
9,144
8,671
3,513
3,394
3,554
2,586
14,407
14,066
13,354
10,551
7,039
6,892
7,096
5,982
7,368
7,175
6,258
4,568
4,234
1,111
(656)
707
691
902
756
641
29
58
55
83
39
430
358
232
169
220
218
181
285
52
172
168
141
124
144
749
810
896
1,331
1,286
242
425
512
472
512
138
143
127
123
127
126
332
466
241
241
256
403
179
3,413
4,116
1,116
(1,232)
63
68
377
7
108
149
1
95
0
0
109
3
15
1
1
64
361
7
11
39
32
651
661
1,439
155
7
36
54
14
14
7
550
7
25
614
599
874
133
3,450
3,842
463
(2,563)
57
1,494
1,846
21
128
22
(11)
(211)
112
(877)
(173)
1,966
2,208
329
(1,815)
208
729
- 11 -
2006
740
768
745
754
pson
Texas
Instru
ments
Zoran
Seiko
E
t
On
Semic
onduc
tor
Sams
ung
Triquin
sson
ST-Eri
c
cale
Intern
ation
Rectifi al
er
Maxim
Frees
Toyoc
om
Epson
Emer
son
Asahi
Ka
Electr sei
onics
Broad
com
■ Major Products of Electronic Devices デバイス事業 主要取扱商品
Semiconductors 半導体
General-Use IC
汎用IC
Memory IC
メモリーIC
Special-Use IC
特定用途IC
Analog
●
●
●
●
●
Standard Logic
●
●
●
●
DRAM
●
SRAM
●
Flash Memory
●
MPU, MCU
●
DSP
●
●
Display Driver
ASSP
●
●
●
●
●
●
●
●
●
●
DMD
Custom IC
カスタムIC
Discrete
ディスクリート
●
ASIC,Full Custom IC
●
●
Transistor
●
●
Diode
●
●
Electronic Components 一般部品
LCD Panel
液晶パネル
●
Crystal Device
水晶
Board Computer
ボードコンピュータ
●
●
- 12 -
●
●
●
■ Major Products of Electronic Systems システム事業 主要取扱商品
Segment 分野
Major products 主要商品
Major Supplier 主要仕入先
Space and Defense Electronics 航空宇宙機器
Avionics Related Equipment
航空関連機器
Space Equipment
衛星関連機器
Advanced Boresight Equipment System, Telemetry Processing
System, Airborne Solid State Recorder
次世代ボアサイト整備機材、テレメトリ地上復調装置、
半導体レコーダ
High-reliability Components, Optical Encoder
宇宙用高信頼性部品、オプティカルエンコーダー
Trident Space & Defense, LLC.
BEI Precision Systems & Space Company,Inc.
Microwave Equipment
高周波電子機器
Klystron, TWT, Wattmeter
クライストロン、進行波管、高周波電力計
CPI, Inc.
Bird Electronic Corp.
Measurement & Sensors
計測・センサ
Accelerometers, Honey comb, Discharge Monitoring System
精密加速度センサー、衝突用バリアフェース、放電測定機
Endevco Corp.
Plascore Inc.
IRIS Power LP
AAI Corp.
L3 Communications,Telemetry West
Calculex, Inc.
Measurement & Inspection Equipment 試験計測機器
Industrial Inspection Equipment
検査装置
X-ray 3D Inspection Systems, Temperature Feature Tasting
Equipment, LED Inspection System, IC Test Equipment
3次元X線検査装置、温度特性検査装置、
LED検査装置、ICテスタ
Uni-Hite System Co. Ltd ㈱ユニハイトシステム
Akim Corp. アキム㈱
Chroma ATE, Inc.
Hilevel Technology, Inc.
Focused Test, Inc.
Analytical & Measuring Equipment
分析計測機器
Gneneral Analytical Instrument, Surface Analyzer, Environmental
Monitor
汎用分析機器、表面分析機器、環境計測機器
Shimadzu Corp. ㈱島津製作所
Manufacturing & Assembling Equipment
製造装置・組立装置
IC Test Handler, Ball Mounter, Microjoining System
ICテストハンドラー、半田ボールマウンタ、精密接合装置
Seiko Epson Corp. セイコーエプソン㈱
Aurigin Technology Pte Ltd. オリジンテクノロジー
Nippon Avionics Corp.,Ltd 日本アビオニクス㈱
Laser Diode & Laser processing systems
半導体レーザ・レーザ加工機
Laser Diode, High Efficiency LD System, Laser Processing Head
半導体レーザ、高出力半導体レーザ装置、レーザ加工ヘッド
Network and Security
ネットワーク・セキュリティ
Network Time Server, Components for Optical Communication
Equipment
ネットワークタイムサーバ、光通信用コンポーネント
nLight Corp.
Laser Diode, Inc.
Laserline GmbH
HIGHYAG Lasertechnologie Gmbh.
Symmetricom, Inc.
Oplink Communication Inc.
Santur Corp.
Optical Components
光学部品
Flashlamps, Xenon lamps
フラッシュランプ、キセノンランプ
Perkin Elmer Inc.
Thin film Equipment
薄膜機器
MOCVD System, SiC-CVDSystem, in-situ monitoring system
MOCVD装置、シリコンカーバイド用CVD装置、
in-situモニタリングシステム
AIXTRON AG.
LayTec GmbH
Laser Beam Measurement Equipment
レーザ光特性計測器・光学計測装置
Optical Spark Plug Senser, Highest-resolution spectrometers
ファイバー光学センサー、高分解能分光器
Lavision GmbH
LTB Lasertechnik Berlin GmbH
Diagnostic Imaging Equipment
画像診断機器
Magnetic resonance imaging, Computed tomography, Digital
radiography/X-ray, Ultra sound systems
MRI、CT、 DR/X-ray、 超音波診断装置
Hemo Dialysis Equipment
人工透析機器
Hemo dialysis machine, Hollow fiber dialyzer, Plasmapheresis &
Hemo Filtration machine
人工透析装置、ダイヤライザー、血液浄化システム
Shimadzu Corp. ㈱島津製作所
Siemens-Asahi Medical Technologies Ltd. シーメンス旭メ
ディテック㈱, Konica Minolta Healthcare Co.,Ltd. コニカミノル
タヘルスケア㈱
カ㈱
Nikkiso Corp.,Ltd 日機装㈱
Clinical Laboratory Equipment
臨床検査機器
Clinical laboratory machine
臨床検査機器
Laser Equipment レーザ機器
Scientific Equipment 科学機器
Medical Equipment 医用機器
Asahi Kasei Kuraray Medical Co.,Ltd. 旭化成クラレメディカ
ル㈱, Kaneka Medix Corporation ㈱カネカメディックス
Beckmancouiter ベックマンコールター㈱
Abbott Japan Co.,Ltd. アボットジャパン㈱
Arkray Marketing, Inc. アークレイマーケティング㈱
- 13 -
■ History of Company Operations 沿革
1844
Dry goods wholesaler "Horikoshi" started a business, at the site of the
present company headquarters, that went by the name Marubun; later
operations were expanded to include export of silk thread and import of
Western dry goods.
現本社所在地で呉服問屋「堀越」(屋号「丸文」)を創業、のち生糸の輸出業およ
び洋反物の輸入業を併営
1947
Established Marubun Corp., capitalized at ¥7.03million to sell
machinery, instruments and daily-use sundries.
機械器具および日用雑貨類の販売を目的に丸文株式会社を資本金703万円で設
立
1952
Contracted with Rocke International, Inc., to serve as their
representative office, and began import and sales of American
machinery.
Rocke International, Inc.社と代理店契約を締結し、米国製機器の輸入・販売を開
始
1957
Started to handle measuring instruments. Subsequently expanded lines
of business to import and sell many types of foreign products, including
aviation and space equipment, optical equipment and analysis
equipment.
Started handling Texas Instruments products including transistors,
diodes and semiconductors.
Ampex Corp.社と代理店契約を締結し、計測機器の取扱開始。その後、航空宇宙
機器、光学機器、分析機器等の外国製機器の輸入・販売を順次開始
1961
Kanazawa Branch Office became independent as Marubun Kanazawa
Co., Ltd. (presently Marubun Tsusho Co., Ltd. ).
金沢支店を分離独立させ、丸文金沢株式会社(現:丸文通商株式会社)を設立
1965
Marubun was first in Japan to import and sell integrated circuits, made
by Texas Instruments Inc.
Texas Instruments, Inc.社製集積回路を当社が日本国内へ初めて輸入・販売
1968
Established representative office in the United States.
米国駐在事務所を設置
1988
Established Marubun Electronics (S)Pte. Ltd.
Marubun Electronics(S)Pte Ltd.を設立
1989
Established Marubun Taiwan Inc.
台灣丸文股份有限公司を設立
1994
Established Marubun Hong Kong Ltd.
香港丸文有限公司を設立
1997
Listed on the 2nd Section of the Tokyo Stock Exchange.
東京証券取引所市場第二部上場
1998
Established Marubun/Arrow Asia Limited.
Started joint-venture business with Arrow Electronics, Inc. of the United
States of America.
MARUBUN/ARROW ASIA, LIMITEDを設立し、米国 Arrow社と合弁事業を開始
1999
Established Marubun/Arrow USA, LLC.
Established Foresight Techno Co., Ltd.
MARUBUN/ARROW USA, LLCを設立
技術サポート専門会社株式会社フォーサイトテクノを設立
2001
Listed on the 1st Section of the Tokyo Stock Exchange.
Obtained ISO 14001.
東京証券取引所市場第一部上場
ISO14001認証取得
2005
Established Marubun Semicon Corporation to sell SUMSUNG
Semiconductors.
Kobe Branch Office became independent as Marubun West
Obtained ISO 9001.
サムスン電子製半導体に特化した販売会社、丸文セミコン株式会社を設立
神戸支店を分社独立させ、丸文ウエスト株式会社を設立
1958
2007
Texas Instruments社(トランジスタ、ダイオード、半導体)の取扱開始
ISO9001認証取得
■Members board 役員構成
As of April 1, 2010 2010年4月1日現在
Chairman and Representative Director
Takashi Sato
CEO and Representative Director
Akihiko Inamura
Executive Vice President
Kazuaki Iwamoto
Senior Vice President
Shoji Mizuno
Vice President
Masahide Kato
Vice President
Tatsumi Soda
Vice President
Hisao Hosokawa
Vice President
Toshiyuki Mochizuki
Vice President
Makoto Sato
Vice President
Kiichi Horikoshi
Vice President
Shuji Aihara
Vice President
Tetsu Takashima
Vice President
Satoshi Fujino
Auditor
Masao Iwatani
Auditor
Sho Marukawa
Outside Auditor
Hisatomo Shimazu
Outside Auditor
Michio Hamaguchi
Outside Auditor
Yasuhiko Watanabe
- 14 -
代表取締役会長
代表取締役社長
専務取締役
佐藤 敬司
稲村 明彦
岩元 一明
常務取締役
取締役
取締役
取締役
取締役
取締役相談役
取締役相談役
取締役(非常勤)
取締役(非常勤)
水野 象司
加藤 正日出
曽田 辰美
細川 尚男
望月 稔之
佐藤 誠
堀越 毅一
相原 修二
髙島 哲
取締役(非常勤)
監査役
監査役
藤野 聡
岩谷 雅夫
丸川 章
監査役(非常勤)
監査役(非常勤)
監査役(非常勤)
島津 久友
濱口 道雄
渡邊 泰彦
■ Subsidiaries and Affiliates 関係会社
As of April 1, 2010 2010年4月1日現在
Share Capital or
Money Invested
資本金または出資金
Percentage of Shares
Directly or Indirectly Held
出資比率(%)
(直接または間接所有割合)
Principal Business
主な事業内容
(単位:千)(Unit:Thousands)
Marubun Semicon Corporation
丸文セミコン株式会社
JPY301,000
100.0
Devices Business
デバイス事業
Marubun Semicon (Shanghai) Co., Ltd.
US$285
100.0
Devices Business
デバイス事業
Marubun Semicon Hong Kong., Ltd.
US$384
100.0
Devices Business
デバイス事業
US$1,500
100.0
Devices Business/Holding Company
デバイス事業/持株会社
NT$60,000
100.0
Devices Business
デバイス事業
Marubun/Arrow Asia, Ltd.
US$7,201
50.0
Devices Business/Holding Company
デバイス事業/持株会社
Marubun/Arrow (S) Pte Ltd.
US$3,639
50.0
Devices Business
デバイス事業
Marubun/Arrow (HK) Ltd.
US$4,490
50.0
Devices Business
デバイス事業
THB38,000
50.0
Devices Business
デバイス事業
US$2,001
50.0
Devices Business
デバイス事業
MR0.002
50.0
Devices Business
デバイス事業
US$280
50.0
Devices Business
デバイス事業
US$2,000
50.0
Devices Business
デバイス事業
JPY100,000
100.0
Systems Business
システム事業
Marubun West Corporation
丸文ウエスト株式会社
JPY30,000
100.0
Systems Business
システム事業
Foresight Techno Co.,Ltd.
株式会社フォーサイトテクノ
JPY77,500
51.0
Systems Business
システム事業
Marubun Information and Communication Corporation
丸文情報通信株式会社
JPY50,000
90.5
The Company’s System Development
当社情報システムの開発
Hokushinrika
株式会社北信理化 (1)
JPY10,000
35.0
Systems Business
システム事業
Marubun USA Corporation
Marubun Taiwan Inc.
Marubun Arrow (Thailand) Co., Ltd.
Marubun/Arrow (Phils) Inc.
Marubun Arrow (M) SDN BHD
Marubun/Arrow (Shanghai) Co., Ltd.
Marubun/Arrow USA, LLC. (1)
Marubun Tsusho Co.,Ltd.
丸文通商株式会社
Notes: (1)…Affiliate company 関連会社
- 15 -
■ Stock Information 株式の状況
Number of Common Stock Issued 発行株式数
2010 年3月31日現在
As of March 31, 2010
Number of shares authorized
発行可能株式総数
100,000,000 shares/株
Number of shares outstanding
発行済株式の総数
28,051,200 shares/株
Number of Shareholders
株主数
4,853 people/名
Common Stock Price 株価の推移
(Yen 円)
High 最高値
Ex-rights Price
株式分割権利落後
Low 最安値
Ex-rights Price
株式分割権利落後
Close 終値
2000
2,140
2001
1,469
2002
1,090
2003
762
2004
994
2005
1,949
2006
1,860
2007
1,736
2008
817
2009
808
1,202
-
-
-
-
-
-
-
-
-
1,030
549
458
400
675
831
1,255
477
161
220
1,130
-
-
-
-
-
-
-
-
-
1,150
900
469
704
974
1,780
1,625
506
218
566
(円/yen)
3,000
2,000
1,000
0
Jan-00
Jan-01
Jan-02
Jan-03
Jan-04
Jan-05
Jan-06
Jan-07
Jan-08
Jan-09
Jan-10
Stock Volume 出来高の推移
(Thousands of Share 千株)
Stock Volume 出来高
2000
17,754
2001
8,454
2002
5,705
2003
8,638
2004
11,323
2005
18,653
2006
15,099
2007
33,631
2008
13,415
2009
27,100
(千株/Thousands of Share)
8,000
6,000
4,000
2,000
0
Jan-00
Jan-01
Jan-02
Jan-03
Jan-04
Jan-05
Public Offering of Common Stock 公募新株式発行
Jan-06
Jan-07
Jan-08
Jan-09
Stock Splits 株式分割
(Yen in Millions 百万円, Thousands of Share 千株)
Date of Issue 発行年月日
Number of New
Shares Issued
発行株式数
Issue Price
発行価格
Date of Issue 発行年月日
Splits
分割比率
January 29, 1997
1997年1月29日
2,200
1,630
May 20, 1997 1997年5月20日
1 : 1.1
April 24, 2000
2000年4月24日
2,000
1,014
May 22, 2000 2000年5月22日
1 : 1.2
February 10, 2001 2001年2月10日
2,500
1,046
May 21, 2001 2001年5月21日
1 : 1.2
- 16 -
Jan-10
■Shareholder Information 株主の状況
As of March 31, 2010
2010年3月31日現在
Composition of Shareholders 所有者別分布状況
(Thousands of Share 千株)
Number of
Shares
所有株式数
14,058
所有者
Owner
Compositon
構成比
Individual and other investors
個人・その他
Business and other corporations
事業会社・その他の法人
5,027
17.92%
Financial institutions
金融機関
4,497
16.03%
Foreign corporations
外国法人
4,251
15.16%
Financial instruments firms
金融商品取引業者
217
0.77%
Government and local public body
政府・地方公共団体
-
-
Total
合計
28,051
100.00%
50.12%
Distribution of Shares 所有者株式数分布状況
(Thousands of Share 千株)
Size of Holding
所有数
1-99
Number of
Shareholders
株主数
197
Composition
構成比
4.06%
Number of
Shares
所有株式数
5
Compositon
構成比
0.02%
100-999
2,750
56.67%
1,000-9,999
1,721
35.46%
4,040
14.40%
158
3.26%
4,054
14.45%
10,000-99,999
100,000Total 合計
754
2.69%
27
0.56%
19,196
68.43%
4,853
100.00%
28,051
100.00%
Major Shareholders 大株主
(Thousands of Share 千株)
Number of
Shares
所有株式数
3,467
株主名
Shareholders
% of Shares
Outstanding
持株比率
12.35%
1 Yoshio Horikoshi
堀越善雄
2 Arrow Electronics, Inc.
アローエレクトロニクス
2,350
8.37%
3 Marubun Research Promotion Foundation
(財)丸文研究交流財団
2,304
8.21%
4 Treasury Stock
丸文(自己株式)
1,914
6.82%
5 The Master Trust Bank of Japan, Ltd. Trust Account
日本マスタートラスト信託銀行㈱ 信託口
1,408
5.02%
6 Chiba Public Golf Course, Ltd.
㈱千葉パブリックゴルフコース
1,199
4.27%
7 Kiichi Horikoshi
堀越毅一
925
3.29%
8 Marubun Employee Stockholders Society
丸文社員持株会
608
2.17%
9 Japan Trustee Services Bank, Ltd. Trust Account
日本トラスティ・サービス信託銀行㈱ 信託口
601
2.14%
10 Koji Horikoshi
堀越浩司
584
2.08%
15,364
54.77%
2008
4,701
2009
4,853
上位10名計
Total of Top Ten Shareholders
Number of Shareholders
株主数の推移
Number of Shareholders 株主数
2002
3,202
2003
3,491
2004
3,702
- 17 -
2005
3,914
2006
3,416
2007
4,783
■ Corporate Information 会社概要
As of April 1, 2010 2010年4月1日現在
Registrated Name
Marubun Corporation
社 名
丸文株式会社
Founded
1844
創 業
1844年(弘化元年)
Established
July 1,
設 立
1947年7月1日
(昭和22年7月1日)
Paid-in Capital
6,214,500,000yen
資 本 金
6,214,500,000円
Head Office Address
8-1, Nihonbashi Odenmacho,Chuo-ku, 本 社 所 在 地
Tokyo 103-8577
Fiscal Year End
March 31, every year
決 算 期
毎年3月31日
Number of Employees
1,334(As of March 31, 2010)
従 業 員 数
1,334名 (2010年3月31日現在)
Domestic Offices
Shinsuna Operation
国 内 拠 点
新砂事業所
〒103-8577
東京都中央区日本橋大伝馬町8番1号
Minamisuna Technical Center
南砂テクニカルセンター
East Japan Logistics Center
東日本物流センター
Minamisuna Logistics Center
南砂物流センター
Central Japan Operation
中部支社
West Japan Operation
関西支社
Tachikawa Branch
立川支店
Ohmiya Branch
大宮支店
Utsunomiya Carelectronics Office
宇都宮カーエレクトロニクスオフィス
Himeji Carelectronics Office
姫路カーエレクトロニクスオフィス
Matsumoto Satellite Office
松本サテライトオフィス
Kyushu Satellite Office
九州サテライトオフィス
- 18 -
© Copyright 2026 Paperzz