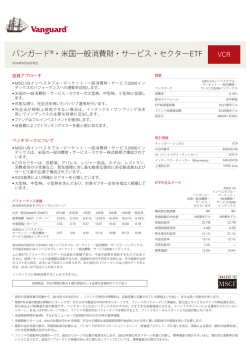
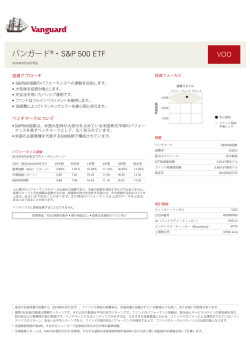
®
バンガード
・米国メガキャップETF
Vanguard Mega
Cap ETF
MGC
MGC
2016年9月30日現在
As of March 31, 2016
投資アプローチ
Investment approach
投資フォーカス
Investment focus
• CRSP USメガキャップ・インデックスのパフォーマンスへの連動を目指
•します。
Seeks to track the performance of the CRSP US Mega Cap Index.
Fund remains fully invested.
••ファンドはフルインベストメン卜を維持します。
••低経費によってトラッキングエラーを最小限に抑えます。
Low expenses minimize net tracking error.
About the benchmark
ベンチマークについて
• The CRSP US Mega Cap Index represents approximately the top 70% of
investable
companies in the U.S. equity market.
• CRSP
USメガキャップ・インデックスは、米国株式市場における投資可能企
•業のうち時価総額上位約70%のパフォーマンスを表します。
The index is designed to accurately represent the mega-cap segment of the
U.S. equity market and deliver low turnover.
• このインデックスは、米国株式市場における超大型株セグメントのパフォー
マンスを正確に表しつつ、売買回転率を低く抑えるように作られています。
Performance history
Total returns2 for period ended in March 31, 2016
パフォーマンス実績
2
MGC (Inception 12/17/2007)
Quarter
2016年9月30日までのトータルリターン
Net asset value (NAV) return3
MGC(設定2007年12月17日)
Market
price return4
3
基準価額(NAV)リターン
4
市場価格リターン
Spliced Mega Cap
Index
1.02%
四半期
0.96
3.80%
1.03
3.79
Year
to date
1 year
3 years
5 years
Since
inception
1.02%
年初来
0.96
7.46%
1.87%
1年間
1.80
15.45%
11.65%
3年間
11.64
10.97%
11.56%
5年間
11.55
16.18%
6.53%
設定来
6.53
6.90%
1.03
7.39
1.93
15.54
11.73
10.95
11.66
16.17
6.906.60
合成メガキャップ・
MSCI US Large Cap 300 Index through
January
US Mega Cap
3.81
7.51 30, 2013;
15.51CRSP11.06
16.28Index 6.99
インデックス
thereafter.
The performance data shown represent past performance, which is not a guarantee of future
2013年1月30日まではMSCI USラージキャップ300インデックス、その後はCRSP USメガキャップ・
results. Investment returns and principal value will fluctuate, so investors shares, when sold,
インデックス。
may be worth more or less than their original cost. Current performance may be lower or
higher than the performance data cited. For performance data current to the most recent
上に掲げたパフォーマンスのデータは過去の実績であり、今後の結果を保証するものではあり
month end, visit our website at vanguard.com/performance.
ません。投資リターンと元金価額は変動するため、投資家が持分を売却する時には、その価値が当初
のコストを上回る、あるいは下回ることがあります。また現在のパフォーマンスは上述のデータを上
Investors cannot invest directly in an index.
回る、あるいは下回ることがあります。
Investment Products: Not FDIC Insured • No Bank Guarantee • May Lose Value
インデックスに直接投資することはできません。
大型株
時価総額
• 米国市場における超大型株への分散したエクスポージャーを提供します。
Employs a passively managed, full-replication approach.
••完全法を用いたパッシブ運用です。
投資スタイル
バリュー ブレンド グロース
中型株
中心傾向
Central tendency
ファンド保有
Expected
range
予想レンジ
of fund holdings
小型株
概要
Quick facts
ベンチマーク
Benchmark
経費率1
Expense ratio1
配当スケジュール
Dividend schedule
CRSP USメガキャップ・
インデックス
CRSP US Mega
Cap Index
ETF純資産総額
ETF total net assets
0.07%
0.09%
四半期毎
Quarterly
10.38億米ドル
$987 million
ファンド純資産総額
Fund total net assets
11.72億米ドル2007
$1,126 million
Inception date
設定日
December
17, 2007
年12月17日
Trading information
MGC
Ticker symbol
取引情報
CUSIP number
ティッカー・シンボル
IIV (intra-day ticker)
CUSIP番号
Index ticker (Bloomberg)
IIV(イントラデイ・ティッカー)
Exchange
インデックス・ティッカー(Bloomberg)
921910873
MGC
MGC.IV
921910873
CRSPMET
MGC.IV
NYSE Arca
CRSPMET
上場取引所
NYSE Arca
投資商品:FDIC保険対象外 • 銀行保証なし • 投資元金損失のリスクあり
1
2
2
As reported in the most recent prospectus. A fund s current expense ratio may be lower or higher than the figure reported in the prospectus.
Figures for periods of less than one year are cumulative returns. All other figures represent average annual returns. Fund performance figures assume the
直近の目論見書の記載から(2016年12月22日付)。ファンドの現在の経費率は、目論見書に記載されている数値よりも低い、または高い可能性があります。
reinvestment of dividends and capital gains distributions; the figures are pre-tax and net of expenses. The above widely used comparative index represents
1
unmanaged or average returns on various financial assets that can be compared with the fund s total returns for the purpose of measuring relative performance.
期間1年未満の数値は累積のリターンです。それ以外の数値は平均の年次リターンです。ファンドのパフォーマンス実績は、配当金とキャピタルゲインの再投資を含む、
税引前および経費差引後の数値です。ベンチマークとなるインデックスが示すのは、さまざまな金融資産にかかる、ファンドマネジャーによる運用がされていないリター
As of 4 p.m., Eastern time, when the regular trading session of the New York Stock Exchange typically closes.
4 ン、あるいは平均リターンであり、ファンドの相対的なパフォーマンスを検討する上で、ファンドのトータルリターンとの比較対象となります。
Market price returns are calculated using the midpoint between the bid and offer prices at the time NAV is calculated, typically 4 p.m., Eastern time.
3
3
米国東部時間午後4時、すなわちニューヨーク証券取引所の大引け時の基準価額。
4
市場価格リターンは、NAVの計算が行われる時間、すなわち通常は米国東部時間午後4時における売り買い気配値の中間値を用いて計算します。
Vanguard Mega Cap ETF
バンガード・米国メガキャップETF
MGC
MGC
2016年9月30日現在
As of March 31, 2016
経費率の比較
Expense ratio 1comparison
1
ETFの主なデータ
ETF attributes
Number of stocks
Median market cap
構成株式銘柄数
Price/earnings ratio
時価総額の中央値
Price/book ratio
株価収益率
Return on equity
1.11%
Mega Cap ETF
バンガード・米国 288
メガキャップ・ 289
メガキャップETF
インデックス
$106.5B
$105.7B
281
279
20.3x
20.3x
1,054億米ドル
1,054億米ドル
2.8x
2.9x
22.1倍18.9%
22.1倍19.2%
株価純資産倍率
Earnings growth rate
株主資本利益率
Foreign holdings
0.29%
0.07%
Large-Cap
米国籍
Core
Funds
米国大型株
Average
コア・
ミューチュアル
ファンド
平均値
Ten largest holdings and % of total net assets
保有上位10銘柄と純資産総額に占める割合 (%)4
2.9倍 7.0%
18.2% 0.0%
17.9% 0.0%
̶
7.0% 8.1%
7.0%
Standard deviation3
米国株以外の株式
0.0%11.4%
0.0%11.4%
標準偏差3
4
2.9倍 7.2%
Turnover rate 2
利益成長率
売買回転率2
Large-Cap
Mega Cap
バンガード・
米国籍
Core
Funds ETF米国
米国大型株
Avg ETFs
コアETF メガキャップ
only
ETF
平均値
CRSP US Mega
CRSPCap
US Index
7.0%
̶
10.8%
10.8%
Top 10 sector diversification as % of common stock
セクター別の構成比率(普通株式の割合比較) (%)5
5
Apple Inc.
Apple
Inc.Inc.
Alphabet
Alphabet
MicrosoftInc.
Corp.
Technology
3.7%
3.6%
テクノロジー
Financials
2.8
2.9 2.7
金融
Health Care
Microsoft
Corp.
Exxon Mobil
Corp.
2.6 2.2
ヘルスケア
Consumer Services
14.714.3
General
Electric
Co.
Exxon
Mobil
Corp.
2.2 1.9
Industrials
消費者サービス
13.710.5
Johnson & Johnson
Amazon.com
Inc.
Berkshire
Hathaway
Johnson & Johnson Inc.
2.1 1.9
Consumer Goods
資本財
Oil & Gas
消費財
10.810.4
10.1 6.9
Facebook Inc.
Facebook Inc.
AT&T Inc.
Berkshire Hathaway Inc.
Amazon.com Inc.
General Electric Co.
Top ten as % of total net assets
AT&T Inc.
1.8 1.6
1.5
1.7
1.4
1.6
21.4%
1.5
純資産総額に占める上位10銘柄の割合
1
Telecommunications
石油・ガス
Utilities
通信サービス
Basic Materials
公益
素材
7.4
3.1
2.9
3.2
3.0
1.9
1.9
22.0%
1
Represents the expense ratio for the Vanguard ETF as reported in the most recent prospectus. There are material differences between mutual funds and ETFs.
Unlike mutual funds, ETFs are priced continuously and bought and sold throughout the day in the secondary market (at a premium or discount to net asset value)
with the assistance of a stockbroker, which entails paying commissions. Sources: Lipper, a Thomson Reuters Company, and Vanguard, December 31, 2015.
2
For most recent fiscal year. Turnover rate excludes the value of portfolio securities received or delivered as a result of in-kind purchases or redemptions of the
fund s capital shares, including Vanguard ETF Creation Units.
直近の目論見書に記載されているバンガード ETF の経費率です。ミューチュアルファンドと ETF との間には大きな違いがあります。ETF はミューチュアルファンドと異なり、
A measure of the volatility of a fund̶based on the fund s last three years of monthly returns̶used to indicate the dispersion of past returns. A higher standard
流通市場において終日にわたって絶えず値付けされ、証券ブローカーの仲介によって、基準価額にプレミアム/ディスカウントを加えて売買されます。この仲介に対しては
deviation means a greater potential for volatility. For funds with less than 36 months of performance history, standard deviation is not calculated.
手数料が支払われます。出所:Lipper, a Thomson Reuters Company、および Vanguard、2015 年 12 月 31 日
3
4
2
2.0 1.7
18.2%
18.4%
16.9
17.014.7
The holdings listed exclude any temporary cash investments and equity index products.
最新の会計年度の数字。売買回転率の計算には、バンガ一ドETFのクリエーション・ユニット(原資産バスケット)の引渡しを含む、現物による設定・解約の結果受渡しさ
Sector categories are based on the Industry Classification Benchmark system.
れる証券価額は含まれません。
5
Vanguard ETF Shares are not redeemable with the issuing Fund other than in very large aggregations worth millions of dollars. Instead, investors must buy or sell
ファンドの変動率の指標の一つで、過去のリターンの分散の程度を示します。過去3年間の月次リターンを基に計算し、標準偏差の値が大きいほど、潜在的な変動率が高い
Vanguard
ETF Shares in the secondary market and hold those shares in a brokerage account. In doing so, the investor may incur brokerage commissions and may
ことになります。過去のパフォーマンス実績が36ヵ月に満たないファンドについては、標準偏差は計算されません。
pay
more than net asset value when buying and receive less than net asset value when selling.
4
記載された保有銘柄は一時的な現金投資および株式インデックス商品を含みません。
All
ETF products are subject to risk, which may result in the loss of principal.
5 For more information about Vanguard ETF Shares, visit vanguard.com, call 866-499-8473, or contact your broker to obtain a prosp
ectus or, if available, a
セクターは、業種分類ベンチマーク(ICB)基準による分類です。
summary prospectus. Investment objectives, risks, charges, expenses, and other important information are contained in the prosp
ectus; read and
バンガードETFにおける受益証券の設定または交換は、通常数百万ドル単位のクリエーション・ユニット(原資産バスケットおよび現金)の引き渡しによってのみ行われます。
consider it carefully before investing.
投資家は、流通市場においてバンガードETFの受益証券の売買を行い、証券取引口座にこれらの受益証券を保有しなければなりません。その際、投資家は仲介手数料を課され
© 2016 The Vanguard Group, Inc. All rights reserved. U.S. Patent Nos. 6,879,964; 7,337,138; 7,720,749; 7,925,573; 8,090,646; 8,417,623.
ます。また、ETF購入の際には基準価額を上回る金額を支払い、あるいは売却時には基準価額を下回る金額を受け取る可能性があります。
Vanguard Marketing Corporation, Distributor.
FA3137_0316
すべての ETF 商品はリスクにさらされており、元金が失われる可能性があります。
3
バンガードETFについての詳しい情報は取扱い証券会社にお問い合わせください。また、投資目的、リスク、手数料、経費、その他重要情報等を十分にご検討ください。
© 2016 The Vanguard Group, Inc. 無断転載を禁じます。米国特許番号6,879,964; 7,337,138; 7,720,749; 7,925,573; 8,090,646; 8,417,623.
FA3137_0916
© Copyright 2026 Paperzz