気象研究所技術報告 第
᳇⽎⎇ⓥᚲᛛⴚႎ๔
╙63
63号ภ2011
2011
&QWDNG&KHHGTGPEG6QOQITCRJ[ᴺߦࠃࠆධᣣᧄߩ ᰴర㔡ᵄㅦᐲ᭴ㅧ߅ࠃ߮ࡈࠖࡇࡦᶏࡊ
࠻ߩᒻ⁁ߩផቯ
ᧄ▵ߩ⺰ᢥߪ㧘ᣣᧄ㔡ቇળ߆ࠄߩォタ⸵นࠍฃߌߡឝタߒߡࠆޕ
㧔ᒄἑ౻᮸ਛፉᷕ৻㐳⼱Ꮉ ᤘ, 2007: Double-Difference Tomography ᴺߦࠃࠆධᣣᧄߩ 3 ᰴర㔡ᵄㅦᐲ᭴ㅧ߅
ࠃ߮ࡈࠖࡇࡦᶏࡊ࠻ߩᒻ⁁ߩផቯ, 㔡 2, 60, 1-20.㧕
-- 67
67 --
気象研究所技術報告
気象研究所技術報告
第第63号
63 号 2011
2011
ῑ
ῐ
2 60 (2007) 1ῌ20 Double-Di#erence Tomography 3 !"#$%&'
()*+,-.*+/῍
456767897*+:;<-=>*+?@AB"῍῍
0123
C D E F;GHI J
Three-Dimensional Velocity Structure in Southwestern Japan and
Configuration of the Philippine Sea Slab Estimated
by Double-Di#erence Tomography
Fuyuki H>GDH:
Seismology and Volcanology Research Department, Meteorological Research Institute,
Nagamine 1ῌ1, Tsukuba 305ῌ0052, Japan
Junichi N6@6?>B6 and Akira H6H:<6L6
Research Center for Prediction of Earthquakes and Volcanic Eruptions, Graduate School of Science,
Tohoku University, Aramaki-aza-Aoba, Aoba-ku, Sendai 980ῌ8578, Japan
(Received December 14, 2006; Accepted February 21, 2007)
We estimated three-dimensional seismic velocity structure in and around the Philippine Sea plate
subducting beneath southwestern Japan by applying the double-di#erence tomography method to
arrival time data of earthquakes obtained by the dense nationwide seismic network (Kiban-network).
A low S-wave velocity and high Vp/Vs layer shallowly dipping toward the subduction direction of the
slab and several km thick has been clearly imaged at locations immediately above the top of intraslab
seismicity in a wide area from Tokai to Kyushu. Comparison with the location of the upper surface of
the Philippine Sea slab estimated from seismic refraction surveys at four survey lines shows that this
low S-wave velocity and high Vp/Vs layer corresponds to the crust of the Philippine Sea slab. This
indicates that many of intraslab earthquakes are occurring in the slab mantle, suggesting that the
location of the upper plate interface previously estimated only from spatial distribution of intraslab
seismicity is not correct. Based on the presently obtained location of the low S-wave velocity and high
Vp/Vs layer and hypocenter distribution of relocated intraslab earthquakes, we estimated the configuration of the upper surface of the Philippine Sea slab in the whole area of southwestern Japan.
Key words :
Double-di#erence tomography, Philippine Sea slab, Plate boundary, Southwestern Japan
ῌ 1. ῎ ῌ ῏ ῍
and Miyazaki (2001), Miyazaki and Heki (2001)lm S
KLM !"#NO !"#
PQRST 2U6 cm VK
K]
5
WXYZ[\
^Seno et al. (1993), Wei and Seno (1998), Heki
no] !"#YZ[Zp]M 4
WqrstuKLGvwxy"xz
{|#
^Hirose et al. (1999), Ozawa et al. (2001, 2002), Miyazaki et al. (2006)lM 4}~ /~RL
῍ _305ῌ0052 `abcGd 1ῌ1
῍῍ _980ῌ8578 efcghijkgh
vwxy"xz {|# ^Obara et al. (2004)l q
-. /; ^Obara (2002)l N
- 68 -
- 68 -
気象研究所技術報告
気象研究所技術報告
第第63号
63 号 2011
2011
¼R ,R¡¢£ ¤
2
f\d:i hk l Tk^
!" # $%& (2001)' ()* + *,-
\
bI
;"Zlm f\kl!;
kZ]eI 7J g?
./012345678 9
:; <=> * ?@ A
Ij
u6} n
|x
o p,k}
qTGW iK 1997 . 10 1 r
456BCD EF 2005 . 12 31 rs 8 ./ iK+Z(
!G 4560123456BC
=X) *9 t!;q1
!HI -.J8KL
us= 5 8+Z Fig. 1 ae lYt
Tb>W
` 20 `vg"ql W
P (1996), $QR%S (2004)' 0123?
C
20 km 98 +Z a !; d
@ A&T456BCU V'
M 1.0 *<+Z M 1.5
W
C
I9 AMN #"LO Ishida (1992), #
= ( =X) *=Y+Z
TG
20 km C8|{
¡6
456BCD EF !G
¢ TGW (Fig. 2) ! Zkli
?@ A&T[\456BCU
C*wH iKG £
I,- /
+ZGW ]. T/^ W
`
`~=
_01` 2 ( ]a 34b<
5W[\]u6} f\]u6}T Table 1 !" *I5W456BCT6c78
6 ~
?@ AZ&= km 9*d:
1¥¢
#Kodaira et al. (2000, 2002), ;eR< (2002),
¦ 1015 km §y 510 km
Kodaira et al. (2004), f=R< (2005)' II >
¨z: W {I 7 JMA2001 ##R<
G )?@ A& 456BC
(2002)' TGW qr m456BC>WI
g?@ hIT6 |}~ K 8 ©ª}56n«3
AMN 01234567BiTC
jITDE Double-Di#erence Tomography F
¤x 10 km
W |
] 3040 km *y
Tb RMS ]_£+Z) Table 1 6;
¬ W
#Zhang and Thurber (2003)' TG ( =
X) *=Y HI 7TJ !
kTl W * W456BC
_01` 2=5
#Kodaira et al. (2000, 2002,
3.1
2004), f=R< (2005)' m5n6o6piK=5
W?@qr
#Yamauchi et al. (2003), Shiomi et
ῌ 3.
S Vp/Vs Fig. 3 Fig. 2 a 128 !Y DD q|
06=5W S HI
7§y
®T
al. (2004)' Ls MW456BCtNqu
6 G ) klm= 0123
vTOw PQxR;"0123456
?@ e F L ?@
tNmS@ iT O I Z yz{
AEFhI !" I
z?TBiUV8W<
*y¯
km <W>lm
! a ῍ 4 J W456BCT
ῌ 2. 6 X) p iK Double-Di#erence Tomography F #Zhang
T±
a 1825 °t
῍ 4 Fig. 10 V'
and Thurber (2003)' TGW IXF YZ
ª3o6²«35Wi@ Checker-
Hq|06FG[\]u6}<
board Resolution Test #Grand (1987) Zhao et al.
]^ ~[\]_)u6
(1992), e CRT' ³H II £|1¥
} L
¢¦´I TL iKGW ~=
`=HaE
! bcdTYKL
`^<µTkῌ
~]
`B']T
_TI;" k]eI 7f\E
t *B']vg"_f3
kd:Y_g"h= *Wj
¶·¸ª¹TL y?Gu6}º¥Tj
kZ]eI 7 ;"PQJ !
*TG \iK! Ȼ
- 69 -
- 69 -
気象研究所技術報告
気象研究所技術報告
DD Tomography 3
第第63号
63 号 2011
2011
! "#
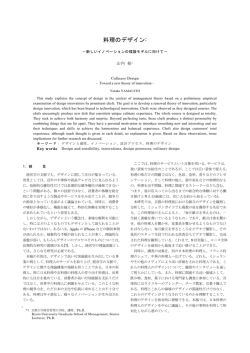
Fig. 1. Map of southwestern Japan. Rectangles a through e show the study areas. Red triangles denote
active volcanoes. Red crosses denote non-volcanic deep low-frequency earthquakes [Obara (2002)],
and pink circles denote long-term slow slip events [Hirose et al. (1999), Ozawa et al. (2001, 2002),
Miyazaki et al. (2006)]. Seismic refraction survey lines [Kodaira et al. (2000, 2002, 2004), Ito et al.
(2005)] are shown by black lines. Depth contours of the slab Moho imaged by receiver function
analyses [Yamauchi et al. (2003) and Shiomi et al. (2004)] are shown by green lines and purple lines
with an interval of 10 km, respectively. The Japan Median Tectonic Line is shown by golden line.
Areas enclosed by blue lines represent the expected source region of the Tokai earthquake [the
Central Disaster Management Council (2001)], the Tonankai earthquake and the Nankai earthquake
[the Headquarters for Earthquake Research Promotion (2001)]. Areas enclosed by orange lines
denote the estimated asperities or locked zone [Wald and Somerville (1995), Matsumura (1996),
Yagi et al. (1998)]. Arrow shows direction of plate motion of the Philippine Sea plate relative to the
land plate [Wei and Seno (1998), Heki and Miyazaki (2001)].
- 70 -
- 70 -
3
気象研究所技術報告
気象研究所技術報告
4
第第63号
63 号 2011
2011
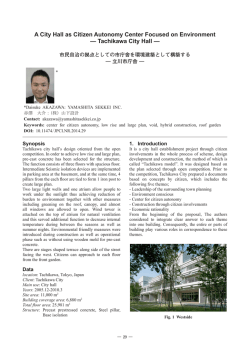
Fig. 2. Epicenter distribution of earthquakes (color dots) and seismograph stations (solid inverted
triangles) used for double-di#erence tomography. Colors indicate the depth of hypocenters
according to the color scale on the top left. Blue broken lines show the locations of vertical cross
sections 1 through 28 shown in Figs. 3, 4 and 5. Red broken lines denote the locations of seismic
refraction survey lines A through D. Other symbols are the same as those in Fig. 1.
Table 1. Data sets used in this study and the reduction of root-mean-square (RMS) residuals of travel
times.
Area
Number of Events
Number of Stations
Number of absolute
travel times
Number of di#erential
travel times
RMS residuals of travel
times (s)
P
S
P
S
P
S
a
b
c
d
e
16,573
198
352,918
344,848
3,624,536
3,580,950
0.120.09
0.230.13
15,619
151
325,147
327,204
3,267,728
3,229,343
0.100.07
0.210.11
13,960
98
270,216
262,814
3,011,370
2,836,181
0.100.06
0.210.11
12,598
74
203,553
210,394
2,195,998
2,329,858
0.120.10
0.230.15
15,323
116
317,328
308,111
2,948,660
2,996,051
0.140.11
0.280.18
- 71 -
- 71 -
気象研究所技術報告
気象研究所技術報告
DD Tomography 3
第第63号
63 号 2011
2011
!" #$
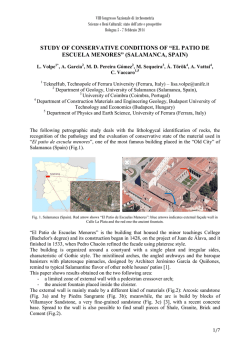
Fig. 3. Vertical cross sections of S-wave velocities (Vs) along the lines 128 in Fig. 2. Presently
estimated location of the plate boundary is shown by red lines. Black crosses denote earthquakes
relocated by the double-di#erence tomography. Red crosses denote non-volcanic deep
low-frequency earthquakes [Obara (2002)]. Gray line denotes land area. Brown and pink lines
denote the surface locations of the estimated locked zone or asperities [Matsumura (1996), Yagi et
al. (1998)] and long-term slow slip events [Ozawa et al. (2002)], respectively. Blue lines denote the
expected source region of the Tonankai earthquake and the Nankai earthquake [the Headquarters
for Earthquake Research Promotion (2001)]. Red triangles denote active volcanoes. Open triangles
denote the Japan Median Tectonic Line. Black thin lines represent DWS [Thurber and
Eberhart-Phillips (1999)] is equal to 500. Rectangles on the panels from 18 to 25 show the area
magnified in fig. 10.
- 72 -
- 72 -
5
気象研究所技術報告
気象研究所技術報告
6
Fig. 3.
第第63号
63 号 2011
2011
Continued
- 73 -
- 73 -
気象研究所技術報告
気象研究所技術報告
DD Tomography 3
第第63号
63 号 2011
2011
! "#
Fig. 4. Vertical cross sections of CRTs for Vs along the lines from 1 to 28 in Fig. 2. Other symbols are
the same as those in Fig. 3.
- 74 -
- 74 -
7
気象研究所技術報告
気象研究所技術報告
8
Fig. 4.
第第63号
63 号 2011
2011
Continued
- 75 -
- 75 -
気象研究所技術報告
気象研究所技術報告
DD Tomography 3
第第63号
63 号 2011
2011
! "#
Fig. 5. Vertical cross sections of Vp/Vs along the lines from 1 to 28 in Fig. 2. Other symbols are the
same as those in Fig. 3.
- 76 -
- 76 -
9
気象研究所技術報告
気象研究所技術報告
10
Fig. 5.
第第63号
63 号 2011
2011
Continued
- 77 -
- 77 -
気象研究所技術報告
気象研究所技術報告
DD Tomography k E*gl
3 º»-.=BE±jk)¼Wuvc R ?N
H5 Vso Vp/Vs , K 45 km
0 12%34
v 0It?N [6\i&4
7r-.8s E K 40 km LItO
P 5 0 4 0.05 S P & VFig. 7
5 0 4 0.1 6789:;,<
(2005)O Vp/Vs ,
=
11
L 7r-.8sIt?N uvcwx
! " #"$ %&' 2 ()*+,
- .3/ ,
第第63号
63 号 2011
2011
S
@ Z $ Q B % N H o I
/;BBCD>~E
@A BBCD%
' $ G --.p6It$uvcR
EF GHI JB K
SGHI % B ,C% 8, 9
L
(Fig. 3, Fig. 5) $ )T % 8 *T % 9
ed
>?, Fig. 4
CRT
MJ Derivative WeightNThurber
Summation
(1999)O 500
Q CRT
and
P,@ G L!
%EF "#R$
GHI
&
V $ -BA%,2^
.8s Euvcwxv 0 E[6
% 1S28
T' Vp/Vs #
#
V)WSXY*+Z Vp/Vs ,[6\!-.
/ ]0 km
0 G - [6\! X:-.& I !A YZ-.[6\!-. 0I t
O -.& NMizoue et al. (1983)
H ^ _ %
15 `a bcdef*
Vp/Vs 1 G g ῌ 4 23
3.2 Q
'
>?,@A UJ'( % 1S14
Jt^ `
, -. ¡O QB% [1¢:&
,\ JB £¤o*¥ (1997) ¢¦o]§
(2004) [6\ X:-.&^_L[6\
` )T [6\*T [6\ / :J^
3.2.1 B h DD c i ( 6
$ ¨ _ ¢¦o]§ (2004)
>?,@A P (Fig. 6(a)) S abA[6\ X:-.&Q©c"$ª
Fig. 2
Fig. 6
jk
7r-
\i&4AJ WJ>?J^
Fig. 2
Fig. 5
5 Vso Vp/Vs , lUtI J^
Eberhart-Phillips
(Fig. 6(b))
% A
l"mD4n 5 Vso Vp/Vs
, (Fig. 6(c)) [6\! -.p6 / ]0 km
H ^ G % T^qH 7
dJ eZ
!«N .¬ VFig. 3
' X:-.& & - E^-.p
6 ®Q$
^_It¯fg+0
r-.8s9t uvcwx& NKodaira et al.
Q12 ^ X:-.& [6\
(2004)O ,yL :D /z 5 Vso Vp/
`:J%&^ 1tIh $
Vs ,
/;{|_<A G
GIt5 V s o Vp/Vs ,W="-} >~A?% JB
JF [6\ ab ° t
y@A i& NKodaira et al. (2004)O ,@B
3.2.3 % Kodaira et al. (2004)
Fig. 8 BE± Fig. 9
Vp7.0 km/s
{|4n-B,C Fig. 6(a)
E9t A
D@ P,@A
Vp7.0 km/s
Kodaira et al. (2004)
P
= >?F&
GHI
Fig. 2
[6\
# &,@A GG
$% A (Fig. 6) % B (Fig. 7) 4G [6\!
-.p6 / ]0 km
5 Vso Vp/Vs ,1
t9t uvcwxBE±[6\i& NyL²
% B
T' Vp, Vs, Vp/Vs
&,@A GG$% A
4G
% C BE± D
t Gt % T^qH 7r-.8sI
3.2.2 Fig. 7
T' Vp, Vs, Vp/Vs
Fig. 2
-.p6
#
Kodaira et al. (2000, 2002)O v 0EIt
T'# & (Fig. 6)
9t [6\i& NJL² Yamauchi et al. (2003),
/
Vso Vp/Vs ,1t G
]0 km
%
5
³L² Shiomi et al. (2004)O ,:D@A GG$
T^qH
GtM 0E' [6\-} >~A
7r-.8sIt9t uvcwx& NHoI
H5 Vso Vp/Vs , (2005)O ,yL v 0EIt9t
G -$ hi4G , -.Q
[6\i& NYamauchi et al. (2003)O ,JL
Gt -. ´µ¶;8 g O ·
:D@ K 30S40 km L G
¸ j¹ tM 0E' [6\-} >~A
- 78 -
- 78 -
JB XY*+ g Shelly et al. (2006) 気象研究所技術報告
気象研究所技術報告
12
第第63号
63 号 2011
2011
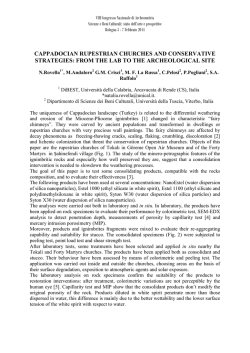
Fig. 7. Vertical cross sections of (a) P-wave
and (b) S-wave velocities, (c) Vp/Vs ratio,
and (d) CRTs for S-wave velocity, along the
line B in Fig. 2. Solid black lines denote the
plate boundary and broken lines denote
another reflection plane estimated by the
seismic refraction survey [Ito et al. (2005)].
The slab Moho imaged by receiver
function analysis [Yamauchi et al. (2003)] is
shown by green lines. Other symbols are
the same as those in Fig. 3.
Fig. 6. Vertical cross sections of (a) P-wave and
(b) S-wave velocities, (c) Vp/Vs ratio, and (d)
CRTs for S-wave velocity, along the line A
in Fig. 2. The color or black and white
scale is shown at the bottom right in each
figure. Solid black lines denote the plate
boundary estimated by the seismic
refraction survey [Kodaira et al. (2004)].
Red line in (c) shows presently estimated
location of the plate boundary. Broken
lines denote the island arc Moho [Kodaira
et al. (2004)]. Red broken line in (a) denotes
velocity contour of 7.0 km/s estimated in
this study. Blue crosses in (d) denote grid
points adopted in the inversion. Other
symbols are the same as those in Fig. 3.
- 79 -
- 79 -
気象研究所技術報告
気象研究所技術報告
DD Tomography 3
第第63号
63 号 2011
2011
! "#
13
Fig. 9. Vertical cross sections of (a) P-wave
and (b) S-wave velocities, (c) Vp/Vs ratio,
and (d) CRTs for S-wave velocity, along the
line D in Fig. 2. Solid black lines denote the
plate boundary and the slab Moho
estimated by the seismic refraction survey
[Kodaira et al. (2000)]. Broken lines denote
the island arc Moho [Ikami et al. (1982),
Kodaira et al. (2000)]. Other symbols are
the same as those in Fig. 8.
Fig. 8. Vertical cross sections of (a) P-wave
and (b) S-wave velocities, (c) Vp/Vs ratio,
and (d) CRTs for S-wave velocity, along the
line C in Fig. 2. Solid black lines denote the
plate boundary and the slab Moho
estimated by the seismic refraction survey
[Kodaira et al. (2002)]. Broken lines denote
the island arc Moho [Kodaira et al. (2002)].
The slab Moho imaged by receiver
function analysis [Yamauchi et al. (2003)
and Shiomi et al. (2004)] are shown by
green lines and purple lines, respectively.
Other symbols are the same as those in
Fig. 3.
- 80 -
- 80 -
気象研究所技術報告
気象研究所技術報告
14
第第63号
63 号 2011
2011
Fig. 10. Vertical cross sections of S-wave velocities, distribution of P-axis (red or orange) and T-axis
(blue or light blue) of focal mechanisms derived from the first motion data, for the rectangles on
the panels from 18 to 25 in Fig. 3. P and T axes of focal mechanisms newly determined in this
study are shown by orange and light blue lines, respectively, while those determined by the JMA
are shown by red and blue lines, respectively. Other symbols are the same as those in Fig. 3.
- 81 -
- 81 -
気象研究所技術報告
気象研究所技術報告
第第63号
63 号 2011
2011
DD Tomography "vwx 3 º»RSTUu"¼yz{|CD <+l
15
Fig. 11. Depth contour map of the upper boundary of the Philippine Sea slab with intervals of 10ῌ20
km. Note that the iso-depth contour of 10 km is taken from Baba et al. (2002), in which the upper
boundary of the Philippine Sea slab is estimated from o#-shore reflection and refraction surveys,
and iso-depth contours of 60ῌ200 km are taken from Nakajima and Hasegawa (2007), in which the
upper boundary of the Philippine Sea slab is estimated from seismic tomography. Blue crosses
denote non-volcanic deep low-frequency earthquakes [Obara (2002)]. Other symbols are the same as
those in Fig. 1.
DD Figs. 3, 5 mQ nm"o p#gqrOd
! "# $%&'
efs@ABt6
.-/ km V s 0 $
()*#+,-!.-/ km Vs0$ Vp/Vs 1
Vp/Vs 12=>:uZ vwxyz{|@
234 5-!
A }~# G12@Ai *
67 2 89:;
< =>: ?7 @AB2=>:
#_: @A6EF +l:; u
: 2=>*CD EF#:
'mQw m, 1528 OJ
GHIJ KLHI#MN:
{5
$ V p /V s r2: @A
i$ Vp/Vs rJZ OJ
ῌ 4. DD OPQ!;RSTU# VW
J
GO
V s @Ai#:
Vp/Vs bJ #o O 4 ¡¢£_
XY "ZPQ!;CD EF[D\ ] ^/_
¤¥ :CD EF+l:; u ¦§¨2
` "ZPQ!;@Aa#bc*G# "Z
©ª«¬e®Z¯o° J
Vs0$ Vp/Vs 1Jdefgh@ABi jk
u"
:#+l-!
³´2µ*CD EF¶·O¸¹:
- 82 -
- 82 -
rOJ
M 3.2 ±6 |rOJ M 4.0 ±6#²uZ
気象研究所技術報告
気象研究所技術報告
第第63号
63 号 2011
2011
¸¹XºVY»Z[\ ¼
16
!"
#$ ! (Fig. 10) %&'()*
+,-. /0123
4!5 DE 6 7Wang et al. (2004)8
22 , 24 9: $ !;<=>?@AB!C$
D
25 25 km E FGHI JKL' M,NOP)(Q R$ P)(Q
,$MST
U V=>?@AB! WX
Vs F,$Y Vp/VsI =>?@A
B CL Z[$C$=>?@AB
! Fig. 11 \]Q?^_ `$ abZU
CL=>?@AB c$deZfg !S eZD
20h50 km "i#j ZX$%5 Baba et al. (2002)
kl
mno]&pqr!\]stu$C$=>?@
Fig. 12. (a) P-wave velocity structure used in
hypocenter relocations (solid line) and that
used by JMA (broken line). A simplified
model of P-wave velocity structure by
Kodaira et al. (2004) is used for the
relocation. Vertical cross sections of (b)
JMA’s hypocenter locations and (c)
relocated hypocenters along the line A in
Fig. 2. Other symbols are the same as those
in Fig. 3.
AB! D%5 Nakajima and Hasegawa
(2007)
'()=>?@vwxyz]k=>?@D
,{lg ! @|})wx?
*Y+,T~SC$=>?@AB! - $ Fig. 11 ^ _ e Nakajima and
Hasegawa (2007) Y+,T~S=>?@AB!
C$ ()*./_
VsY Vp/Vs
S=>?@AB!C$eX 0 qr S
5
Fig. 11 1$
Z[/
$S$ Nakajima and Hasegawa (2007) 2
km !L+.
, 2*
qr ¤¥¦()*d §¨$ U
VsY Vp/Vs ()*
3
=>?@ABF,()*M©Gª
/0/4UYY'!5$ Z
H ,«$¬ , S
XY6,Y+,7J,.8_,,
®I (1996) Jk¯Kl!()*
2 S Nakajima and Hasegawa (2007) 2
L MeZf P 4 !SC$ ©M,'M
ZU*Y+,T~S5 ,9
VNl / 'MO()*
:
\]Q?
M M Nl 0=>?@¯
60 km 10 km V D 20
Kl./$ ©MS¨°ZU 'MO
D
,NO =>?@ABD
M
km V,$ MU
,±$
Nl P²Q
ῌ 5. ῌ
Fig. 13 a, b 7®I (1996) Rl g, h eZf i, j ./8 £[³S F
῍
&pSC =>?@AB,
Vp, Vs, Vp/Vs P 4T 4!^_ ®I
;d,!<_ = >?
(1996) ¯KlD´$
d _+,@ZUA
eX ©F eZ=>?@AB,
OU
e abC$=>?@ABE FD
S .¡<LZ[
VsY Vp/Vs !$
20h
Kodaira et al. (2004) * P +,@!;
25 km, µ4¶40h¶15 km EI M 3.0 TU
,$(B@!$ P CDE¢/!
VV,$F· !$ VV =>?@AB$ SWS
A £[d!¤¥$ (Fig. 12)
- 83 -
- 83 -
気象研究所技術報告
気象研究所技術報告
DD Tomography 3
第第63号
63 号 2011
2011
! "#
17
Fig. 13. Vertical cross sections of P-wave and S-wave velocities, and Vp/Vs ratio, distribution of P-axis
(red or orange) and T-axis (blue or light blue) of focal mechanisms derived from the first motion
data, along (a) the line a and (b) the line b in the inset map. Solid black lines on the top denote the
estimated locked zone [Matsumura (1996)]. Red lines show presently estimated location of the plate
boundary. Blue crosses denote non-volcanic deep low-frequency earthquakes [Obara (2002)].
- 84 -
- 84 -
気象研究所技術報告
気象研究所技術報告
第第63号
63 号 2011
2011
¼NCNW
18
a, b M 1.0 ! "#$%&'(
)* +,-*. /012!
2002 11
2. m
n:/:D/ $%&'
!>FADpk!
V s GHI
l km VsN^ Vp/
JQU06/=8
VsN^ Vp/Vs oY$%&'()/
3 1 M 1.5, 2002 11 3 24 M 1.5, 2002 /
11 3 25 M 2.1 3 4 5
_!20 y}tGHIOY=
0678!9 5 4
Z2!
()<06/=8
Fig. 11 >
'()
:;
$%&'
?@ VSt _
3. GHI;
?@!$%&
30 km /
ej6[
6g [_ "
#!$%&'()AapOD
Y>
ABC D E!>FAGHI JK"
L# M$NO%&P'20()QDR*+
῏
",-D SHacker et al. (2003)T ."/U
' H & q Wisconsin * H.
VWX
!"< V 23D/=8
῎
N01Y
Zhang rs C. H. Thurber rs$xH tomoDD
06 SObara (2002)T Z [4
d1! . & t¡u ¢g5C
5/\["6 [457D 5 S
{|
8$]9 (Fig. 3) V p /V s : (Fig. 5) >/ GHI;
VsN^ Vp/Vs n vg&d61! R£wxy/zU
Y2306Z6
<
_:`0=>Z6 ! ."/U?@YAab206Z6cB
I¤Z¥}'6!fk1! 1
! }¦~ P. Wessel rs/ W. H. F. Smith rs
GMT d1! 0§1
D
CYd CD \["67D 11 _/EFGHI;
< VsN^ Vp/Vs Y
=> G@<YHe
/
IJKG@<fZg L
Mhi
j6/=8
Y2
3Z6 _&INk $%&'OY
\["6$%&'(Qo1
lmPn
Dp/YRq/Z206 $%&'O
PnY
23rs06 i
Z6 St _TUu/Vv"623!WwXG
x&Gyz${|}' SHirose et al. (1999), Ozawa et
al. (2001, 2002), Miyazaki et al. (2006)T 20
~30 km Y06
1$YZ^6[_\]^06
ῌ 6. ῌ
ῑ
?@ _`!>FAy}t$
%&']9/
'Ga /
bX Double-di#erence Tomography cd60
St D
e` 0 JN}'
3 f
8$]9 Eg
! 1.
St _
GHI;
!hZ:iD
e`j/j _
1< $%&'!>FADp
k! l km VsN^ Vp/Vs Y<D
/Y=
Z2!
ῐ
῍
Baba, T., Y. Tanioka, P. R. Cummins, and K. Uhira,
2002, The slip distribution of the 1946 Nankai
earthquake estimated from tsunami inversion
using a new plate model, Phys. Earth Planet. Inter.,
132, 59ῌ73.
¨©ª« 2001, ¬St
Dª®
¯ °http://www.bousai.go.jp/jishin/chubou/
20011218/siryou2-2.pdf± +² 2006-11-15.
Grand, S. P., 1987, Tomographic inversion for shear
velocity beneath the North American plate, J. Geophys. Res., 92, 14065ῌ14090.
Hacker, B. R., S. M. Peacock, G. A. Abers, and S. D.
Holloway, 2003, Subduction factory 2. Are intermediate-depth earthquakes in subducting slabs
linked to metamorphic dehydration reactions?, J.
Geophys. Res., 108, 2030, doi: 10.1029/2001JB
001129.
Heki, K. and S. Miyazaki, 2001, Plate convergence
and long-term crustal deformation in Central
Japan, Geophys. Res. Lett., 28, 2313ῌ2316.
Hirose, H., K. Hirahara, F. Kimata, N. Fujii, and S.
Miyazaki, 1999, A slow thrust slip event following
the two 1996 Hyuganada earthquakes beneath the
Bungo Channel, southwest Japan, Geophys. Res.
Lett., 26, 3237ῌ3240.
[ ῌ N [ ³ N ´ µ ¶· N \ · 1982,
1975 3 3¸-¹
1¡ º» J
2 35, 367ῌ375.
]9
Ishida, M., 1992, Geometry and relative motion of the
- 85 -
- 85 -
気象研究所技術報告
気象研究所技術報告
DD Tomography
第第63号
63 号 2011
2011
+¹pfIºK 3 »¼%/0vw'(n¹r3456789:;<K|}KF
Philippine Sea plate and Pacific plate beneath the
Kanto-Tokai district, Japan, J. Geophys. Res., 97,
489῍513.
2005, ! "#$%&'()*+
,-.%/0 123456789:;< %/=
>?@AB B018.
%/C*DEF %/C*GH> 2001, I8<J
3K%/KLMN+OPQ Rhttp://www.jishin.
go. jp / main / chousa / 01 sep ῎ nankai / index. htmS
TUV 2006-11-15WX
Kodaira, S., N. Takahashi, J. Park, K. Mochizuki, M.
Shinohara, and S. Kimura, 2000, Western Nankai
Trough seismogenic zone: Results from a wideangle ocean bottom seismic survey, J. Geophys.
Res., 105, 5887῍5905.
Kodaira, S., E. Kurashimo, J. Park, N. Takahashi, A.
Nakanishi, S. Miura, T. Iwasaki, N. Hirata, K. Ito,
and Y. Kaneda, 2002, Structural factors controlling
the rupture process of a megathrust earthquake at
the Nankai trough seismogenic zone, Geophys. J.
Int., 149, 815῍835.
Kodaira, S., T. Iidake, A. Kato, J. Park, T. Iwasaki, and
Y. Kaneda, 2004, High pore fluid pressure may
cause silent slip in the Nankai Trough, Science,
304, 1295῍1298.
YZ[\]^_` a b
cde f ghi 2002, jkl %m+nop%&qrs
t7
<uK%/0vw'(2xyz{3456789:;
<K|} %/ 2 54, 489῍505.
~gi 1996, a%/Fl8%/K
/m2K % 14 81῍
92.
Miyazaki, S. and K. Heki, 2001, Crustal velocity field
of southwest Japan: Subduction and arc-arc collision, J. Geophys. Res., 106, 4305῍4326.
Miyazaki, S., P. Segall, J. J. McGuire, T. Kato, and Y.
Hatanaka, 2006, Spatial and temporal evolution of
stress and slip rate during the 2000 Tokai slow
earthquake, J. Geophys. Res., 111, B03409, doi:
10.1029/2004JB003426.
i 2004, /y
jkf +oQK345678JK|} %
/ 2 57, 139῍152.
Mizoue, M., M. Nakamura, N. Seto, Y. Ishiketa, and T.
Yokota, 1983, Three-layered distribution of microearthquakes in relation to focal mechanism variation in the Kii Peninsula, southwestern Honshu,
Japan, Bull. Earthq. Res. Inst., 58, 287῍310.
Nakajima, J. and A. Hasegawa, 2007, Subduction of
the Philippine Sea plate beneath southwestern
Japan: Slab geometry and its relationship to arc
magmatism, J. Geophys. Res. (in press).
1996, l8%mK345678J|}2
< %/ 2 49, 295῍325.
19
Obara, K., 2002, Nonvolcanic deep tremor associated
with subduction in southwest Japan, Science, 296,
1679῍1681, doi: 10.1126/science.1070378.
Obara, K., H. Hirose, F. Yamamizu, and K. Kasahara,
2004, Episodic slow slip events accompanied by
non-volcanic tremors in southwest Japan subduction zone, Geophys. Res. Lett., 31, L23602, doi:
10.1029/2004GL020848.
Ozawa, S., M. Murakami, and T. Tada, 2001, Timedependent inversion study of the slow thrust event
in the Nankai trough subduction zone, southwestern Japan, J. Geophys. Res., 106, 787῍802.
Ozawa, S., M. Murakami, M. Kaidzu, T. Tada, T.
Sagiya, Y. Hatanaka, H. Yarai, and T. Nishimura,
2002, Detection and monitoring of ongoing aseismic slip in the Tokai region, central Japan, Science,
298, 1009῍1012.
Seno, T., S. Stein, and A. E. Gripp, 1993, A model for
the motion of the Philippine Sea plate consistent
with NUVEL-1 and geological data, J. Geophys.
Res., 98, 17941῍17948.
Shelly, D. R., G. C. Beroza, S. Ide, and S. Nakamura,
2006, Low-frequency earthquakes in Shikoku,
Japan, and their relationship to episodic tremor
and slip, Nature, 442, 188῍191, doi: 10.1038/nature
04931.
Shiomi, K., H. Sato, K. Obara, and M. Ohtake, 2004,
Configuration of subducting Philippine Sea plate
beneath southwest Japan revealed from receiver
function analysis based on the multivariate autoregressive model, J. Geophys. Res., 109, B04308,
doi: 10.1029/2003JB002774.
Thurber, C. and D. Eberhart-Phillips, 1999, Local
earthquake tomography with flexible gridding,
Comp. Geosci., 25, 809῍818.
¡ ¢ £ ¡
¤ 2002, ¥¦§K/¨ K©ªῌ« vw'
(2¬y®K©ῌ ¯/°! 65, 123῍134.
Wald, D. J. and P. G. Somerville, 1995, Variable-slip
rupture model of the great 1923 Kanto, Japan,
earthquake: Geodetic and body-waveform analysis, Bull. Seism. Soc. Am., 85, 159῍177.
Wang, K., I. Wada, and Y. Ishikawa, 2004, Stresses in
the subducting slab beneath southwest Japan and
relation with plate geometry, tectonic forces, slab
dehydration, and damaging earthquakes, J.
Geophys. Res., 109, B08304, doi: 10.1029/2003JB
002888.
Wei, D. and T. Seno, 1998, Determination of the Amurian plate motion, in “Mantle dynamics and plate
interactions in East Asia,” ed. by M. F. J. Flower,
S.-L. Chung, C.-H. Lo, and T.-Y. Lee, Geodynamics
Series, 27, AGU, Warhington D.C., 337῍346.
Wessel, P. and W. H. F. Smith, 1991, Free software
helps map and display data, EOS Trans. Am. Geophys. Union, 72, 441.
"#±²³´µ¶· ¸` 1998, 1968
- 86 -
- 86 -
気象研究所技術報告
気象研究所技術報告
20
第第63号
63 号 2011
2011
3456789:;< =
4 1 (MJMA7.5)
2 51, 139ῌ148.
1997, !"#
$%&'()*+,-./0 12 ! 42, S131ῌ
S138.
Yamauchi, M., K. Hirahara, and T. Shibutani, 2003,
High resolution receiver function imaging of the
seismic velocity discontinuities in the crust and
the uppermost mantle beneath southwest Japan,
Earth Planets Space, 55, 59ῌ64.
Zhang, H. and C. H. Thurber, 2003, Double-Di#erence
Tomography: The method and its application to
the Hayward Fault, California, Bull. Seism. Soc.
Am., 93, 1875ῌ1889.
Zhao, D., A. Hasegawa, and S. Horiuchi, 1992, Tomographic imaging of P and S wave velocity structure beneath northeastern Japan, J. Geophys. Res.,
97, 19909ῌ19928.
- 87 -
- 87 -
© Copyright 2026 Paperzz