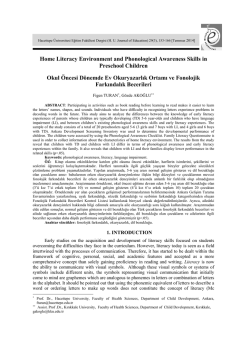
J. Black Sea/Mediterranean Environment
Vol. 22, No. 1: 35-45 (2016)
RESEARCH ARTICLE
DNA barcoding of Scombrid species in the Turkish
marine waters
Dilruba Seyhan, Cemal Turan*
Molecular Ecology and Fisheries Genetic Laboratory, Marine Sciences and Technology
Faculty, Iskenderun Technical University, 31220, Iskenderun, Hatay, TURKEY
*Corresponding
author: [email protected]
Abstract
In order to obtain barcods of nine Scombrid species (Thunnus alalunga, Thunnus
thynnus, Euthynnus alletteratus, Auxis rochei, Katsuwonus pelamis, Sarda sarda,
Scomber colias, Scomber scombrus, Scomberomorus commerson), occurring in the
Turkish Seas, mitochondrial DNA Cytochrome Oxidase subunit I (COI) gene was
sequenced. COI contained 177 variable and 457 conservative nucleotides of which 175
were parsimony informative over 634 bp. Mean genetic diversity within and between
species were 0.002 and 0.117 respectively. The number of detected different haplotypes
were 22 out of 35 sequences, and haplotype diversity was 0.96. The highest genetic
diversity (0.005) within species were observed for S. commerson, and lowest genetic
diversity (0.000) was observed for K. pelamis and E. alletteratus. The highest and lowest
nucleotide divergence was observed between S. commerson and S. colias (0.201) and
between T. alalunga and T. thynnus (0.005) respectively. In Neighbour joining tree, two
main phylogenetic nodes were detected; in the first node, S. scombrus and S. colias
grouped together, and in the second main node, three branches were detected on which S.
commerson was branched first and most divegent from the others and sisterly grouped
with S. sarda. On the other hand, A. rochei, E. alletteratus, K. pelamis, T. thynnus and T.
alalunga were grouped together in third branch in which T. thynnus and T. alalunga were
clustered together.
Key words: DNA Barcoding, mtDNA, COI, biodiversity monitoring, Scombridae
Introduction
Scombrid fishes have a worldwide importance for their economic and ecological
value and contain 15 genera and 51 species (Collette et al. 2001). This family
includes mackerels, bonitos and tunas, showing a worldwide distribution from
tropical to subtropical oceans (Collette 2003). Scombrids are epipelagic and
generally migratory marine fish, characterized by an elongate and fusiform body
although moderately compressed in some genera (Collette et al. 2001).
Generally, these species have a varied diet with a preference for small pelagics
35
(e.g. clupeids, mullets, carangids). They feed also on crustaceans, mollusks and
cephalopods.
There are ten species of this family (Scomberomorus commerson (Lacepède
1800), Auxis rochei (Risso 1810), Euthynnus alletteratus (Rafinesque 1810),
Katsuwonus pelamis (Linnaeus 1758), Sarda sarda (Bloch 1793), Scomber
colias Gmelin 1789, Scomber scombrus Linnaeus 1758, Thunnus alalunga
(Bonnaterre 1788), Thunnus thynnus (Linnaeus 1758), Orcynopsis unicolor
(Geoffroy Saint-Hilaire 1817) which are distributed in the Turkish seas (Fricke
et al. 2007; Turan, 2007). While S. commerson is a Red Sea migrant and the
others (A. rochei, E. alletteratus, K. pelamis, S. sarda, S. colias, S. scombrus, T.
alalunga, T. thynnus, O. unicolor) are origanated from the AtlantoMediterranean. On the other hand, Acanthocybium solandri (Cuvier 1832)
distributed along the Red Sea, Pacific Ocean and Atlantic Ocean, has been
reported from the Mediterrenean (Collette and Nauen 1983; Romeo et al. 2005),
but the way of enterance into the Mediterrenean is still unknown, and there is no
record about current population existence. Moreover, Scomberomorus tritor
(Cuvier 1832) was also reported by Collette and Russo (1979) and Collette and
Nauen (1983) from the Mediterranean coastal waters of France and Italy, but no
further report exists on the occurence in the Mediterrenean.
Molecular genetic studies on mtDNA have proven useful for examining
hypotheses about the phylogeny and phylogeography of marine species (Meyer,
1993; Avise, 1994; Turan et al. 2015a). Sequence analysis of mtDNA regions
may be a quick tool to reveal phylogenetic relationships of marine species
(Avise, 1994; Turan et al. 2008; Tabata and Taniguchi, 2000). Since different
regions of mtDNA evolve at different rates, specific mtDNA regions have been
targeted for inter and intra specific variation (Hauser et al. 2001; Mohindra et al.
2007; Turan et al. 2015b).
DNA barcoding is a global initiative that provides a standardized and efficient
genetic marker to catalogue and inventory marine and freshwater biodiversity,
with significant conservation applications. The DNA barcoding approach is
concentrated on a single part of the mitochondrial genome, chosen because it
presents portions conserved across taxa that are appropriate for primer design,
while including polymorphism among and within species (Hebert et al. 2003;
Kress and Erickson, 2008). The first studies for barcoding marine species in
Turkish waters was by Kochzius et al. (2008) and Kochzius et al. (2010) who
studied DNA barcoding using three mitochondrial genes 16S rRNA (16S),
cytochrome b (cyt b), and cytochrome oxidase subunit I (COI) for the
identification of 50 marine fish specieson in European waters, including Turkish
seas and found that cyt b and COI are suitable for unambiguous identification of
marine fishes. The cytochrome oxidase subunit I (COI) region of the
mitochondrial genome is sufficiently diverse so as to allow the specific
36
identification of a great majority of animal species (Kochzius et al. 2008;
Kochzius et al. 2010).
In addition to simple identification of Scombrids by DNA barcoding, the current
level of interspecific and intraspecific genetic variation at Scombrid species
which distrubuted in Turkish waters is very important to know. In spite of the
wide scientific interest given to this family because of their commerical value,
there are rare studies which investigated genetic structure of these species in
Turkish waters.
The goal of this study is to evaluate the usefulness of DNA barcoding in the
monitoring of the Scombrid species biodiversity distrubuted along the Turkish
waters at two levels: by confirming the taxonomic identification, and by
determining intraspecific and interspecific variations for nine species commonly
found off Turkish marine waters.
Materials and Methods
Specimens of S. scombrus were collected from Izmir Bay, T. thynnus, T.
alalunga and S. sarda specimens were collected from Fethiye and Antalya, and
the others A. rochei, E. alletteratus, K. pelamis, S. commerson and S. colias
were collected from Iskenderun Bay in winter season of 2012-2013. All samples
were put in plastic bags individually and frozen at -20 °C till they were
transported to the laboratory. All tissue samples were stored at -20 °C and 95 %
ethanol till the analysis.
Total genomic DNA was extracted from cauadal fins and muscle samples. High
salt method described by Asahida et al. (1996) was followed for extracting
genomic DNA. Each PCR reaction was performed in a total volume of 50 μl
containing 0.4 µM of each primer, 0.2 mM of dNTP and 1.25U of Taq DNA
polymerase (Thermo Scientific) in a PCR buffer that included 20mM of Tris–
HCl (pH 8.0), 1,5mM of MgCl2, 15 mM of KCl and 1-2 μl template DNA.
Denaturation step at 94°C for 30 s, 50 °C for 30 s, and 72 °C for 45 s for 30
cycles and followed by a final extension for 7 min at 72°C. The set of primers
used for PCR amplification described by Ward et al. (2005) as as follows:
COIF: 5’-TCAACCAACCACAAAGACATTGGCAC-3’
COIR: 5’-TAGACTTCTGGGTGGCCAAAGAATCA-3’
Visualization of amplified COI gene was done on agarose gel. Quantitation of
the PCR product was completed using spectrophotometer. The DNA sequencing
was attempted to determine the order of the nucleotides of a gene. The chain
termination method by Sanger et al. (1977) was applied with Bigdey Cycle
Sequencing Kit V3.1 and ABI 3130 XL genetic analyzer. The initial alignments
of partial COI sequences were performed with Clustal W program (Thompson et
al. 1994) and final alignment was completed manually with BioEdit (Hall
37
1999). After sequence alignment, sequence divergences were calculated using
the Kimura two parameter (K2P) distance model (Kimura 1980). The molecular
phylogenetic tree was constructed using Mega5 (Tamura et al. 2011). A
distance-based method as neighbour joining (NJ) (Saitou and Nei 1987) and a
cladistic phylogenetic tree as maximum parsimony (MP) criterion were used.
The reliability of the inferred phylogenies was evaluated using the bootstrap
method (Felsenstein 1985) with 1000 replicates. One species, Xiphias gladius,
was included as an out group taken from GenBank (HQ024917).
Results
There were 177 variable and 457 conservative nucleotides of which 175 were
parsimony informative over 634 bp sequences. The average nucleotide
composition was 23.6% A, 29% T, 18.8% G and 28.7% C. Twenty two
haplotypes were found out of 35 sequences, and there was no shared haplotypes
between species (Table 1).
Kimura 2 paramater method was chosen as a best method for intra- and
interspecific variations. Mean genetic diversity between and within species was
calculated as 0.117 and 0.002, respectively. The matrix of pairwise distances
within species is presented in Table 2. Intraspesific genetic diversity within K.
pelamis and E. alletteratus was observed to be zero while it was highest within
S. commerson specimens (0.005). The lowest genetic distance is observed
between T. alalunga and T. thynnus (0.005) while the highest one is observed
between S. colias and Indo-Pacific originated S. commerson (0.201).
Table 1. The number of haplotype and its distribution among species
T.thynnus K.pelamis T.alalunga S.commerson S.scombrus S.colias A.rochei E.alletteratus S.sarda
Hap1
Hap2
Hap3
Hap4
Hap5
Hap6
Hap7
Hap8
Hap9
Hap10
Hap11
Hap12
Hap13
Hap14
Hap15
Hap16
Hap17
Hap18
Hap19
Hap20
Hap21
Hap22
2
1
1
2
1
1
1
1
1
1
2
1
3
1
1
1
2
1
1
5
1
4
38
Table 2. The matrix of intraspesific genetic diversity given
in bold (transversal diagonal) and distances between species
T. thynnus (1)
K. pelamis (2)
T. alalunga (3)
S. commerson (4)
S. scombrus (5)
S. colias (6)
A. rochei (7)
E. alletteratus (8)
S. sarda (9)
1
0.002
0.016
0.005
0.124
0.159
0.170
0.092
0.095
0.108
2
3
4
5
6
7
8
9
0.000
0.013
0.131
0.163
0.166
0.092
0.089
0.108
0.004
0.128
0.160
0.169
0.092
0.094
0.109
0.005
0.190
0.201
0.145
0.147
0.138
0.002
0.108
0.168
0.174
0.183
0.003
0.142
0.165
0.178
0.002
0.095
0.109
0.000
0.116
0.001
Neigbour Joining and Maximum Parsimony phylogenetic approaches resulted in
similar tree topologies. In Neighbour joining phylogenetic tree (Figure 1), two
phylogenetic nodes were detected; in the first node, S. scombrus and S. colias
grouped together. In the second node two branches were detected; S. commerson
was in the first branch and A. rochei, E. alletteratus and K. pelamis, T. thynnus
and T. alalunga are grouped in the second branch with sister group to S. sarda.
In Maximum Parsimony phylogenetic tree (Figure 2), two phylogenetic nodes
were detected; in the first node, S. scombrus and S. colias grouped together. In
the second node two main branches were observed while the first branch is
composed of S. commerson, and the second branch is composed two another
branches. One of them is composed of S. sarda while T. thynnus and T.
alalunga and K. pelamis are grouped together with sister group E. alletteratus
and another branch is composed of A. rochei.
Discussion
Generation of DNA barcoding of nine Scombrid species which are distributed in
the Turkish Seas were investigated in the present study. All the species under
the six genera were clearly separated by different clusters in the NJ and MP
trees with a high bootstrap value. The universal primers amplified the target
region in all nine species, generating 35 COI barcodes of 634 bp. No shared
haplotypes was detected betwen species, and the barcode sequences clearly
discriminated taxonomic status of all nine Scombrid species examined.
Genetic diversity within species was calculated zero for K. pelamis and E.
alletteratus. This low genetic diversity may be explained with overfishing of
these species in Turkish waters, but the number of samples sequenced for these
species was low which most probaly caused the detected low genetic diversity.
A similar result reported by Keskin and Atar (2013) using DNA barcoding to
identify 89 commercially important freshwater and marine fish species found in
Turkish ichthyofauna and COI reffered the lowest genetic distance (except
intraspecific distances) between Thunnus alalunga–Thunnus thynnus (0.012).
Chow et al. (2006) studied the Intra and inter specific nucleotides sequence
variation of rDNA (ITS1) and analyzed the genus Thunnus. Intraspecific
39
nucleotide sequence variation was ranging from 0.003 to 0.014 (K2P) whereas
variation between species within the genus Thunnus ranged from 0.009 to 0.05.
Chow et al. (2006) also reported the genetic distance as 0.029 between T.
alalunga and T. thynnus and 0.013 while it is 0.005 in the present study.
Figure 1. Neigbour joining phylogenetic tree based on COI sequences. Xiphias gladius
was used as outgroup. Numbers on nodes indicate the bootstrap values.
Fish drawings: Froese and Pauly (2015)
A similar result was reported by Mudumala et al. (2011) the genetic distance
values between T. alalunga and K. pelamis but contrarily, the genetic distance
values between T. alalunga and T. thynnus is very low in the present study.
Vinas and Tudela (2009) studied genetic identification of eight Scombrid
species (T. atlanticus, T. tonggol, T. albacares, T. obesus, T. maccoyii, T.
alalunga, T. orientalis and T. thynnus) using mtDNA control region, mtDNA
COI gene and nuclear DNA ITS1 region and reported that reliablity of COI gene
is questionable. Vinas and Tudela (2009) also reported that COI gene is not a
good marker for inferring evolutionary relationships in Thunnus species. In the
prsent study, T (28.9%) and C (28.7%) content were highest in the COI region.
The present finding is in accordence with many studies. Mudumala et al. (2011)
studied phylogenetic relationships of A. rochei, A. thazard, E. affinis and T.
tonggol species inferred from mitochondrial DNA sequences in the COI gene
and reported the nucleotide compositions as A 24.0%, T 30.2%, G 18.4% and C
27.4%. Kochzius et al. (2010) aimed to evaluate the applicability of the three
mitochondrial genes 16S rRNA (16S), cytochrome b (cyt b), and cytochrome
40
oxidase subunit I (COI) for the identification of 50 European marine fish species
(inculuding S. Japonicus and S. Scombrus) by combining techniques of DNA
barcoding and microarrays.
Figure 2. Maximum Parsimony phylogenetic tree based on COI sequences. Xiphias
gladius was used as outgroup. Numbers on nodes indicate the bootstrap values.
Fish drawings: Froese and Pauly (2015)
As a result, while cyt b and COI are equally well suited for DNA barcoding of
fishes. On the other ahnd, 16S has drawbacks in discriminating closely related
species. This study was also first DNA barcoding attemt on marine fish species
of Turkey. Al these studies and many further have shown that genetic
identification by ‘‘COI barcodes’’ can provide a useful tool to identify seafood
for consumer protection to control fisheries, and to detect possibly cryptic
species, and even to describe new species.
In conclusion, the present study has strongly authenticated the efficacy of COI
in identifying the scombrid species with designated barcodes. The present
results also suggest that COI barcoding can be taken up as pragmatic approach
for resolving unambiguous identification of scombrid species in marine waters
of Turkey with applications in its management and conservation.
DNA Barkodlama ile Türkiye Denizlerinde bulunan
Scombrid türlerinin ayırımı
Özet
Türkiye denizlerinde bulunan Scombridae familyasına ait dokuz türün (Thunnus
alalunga, Thunnus thynnus, Euthynnus alletteratus, Auxis rochei, Katsuwonus pelamis,
41
Sarda sarda, Scomber colias, Scomber scombrus, Scomberomorus commerson)
barkodlama tekniği ile tanımlanması için mtDNA COI bölgesi kullanılmıştır. 634 bç
olarak incelenen COI bölgesinin 457 bç’lik kısmı evrimsel süreçten etkilenmemiş
bölgelerden oluşurken, 177 bç’lik bölge ise türler arasında çeşitli sebeplerden ötürü
değişen bölge olarak tespit edilmiştir. 175 bç’lik bölge ise türler arasında belirteç görevi
görmüştür. Türiçi ve türler arası genetik çeşitlilik sırasıyla 0.002 ve 0.117 olarak
belirlenmiştir. Toplamda 22 farklı haplotip belirlenirken haplotip çeşitliliği ise 0.96
olarak tespit edilmiştir. En yüksek türiçi genetik çeşitlilik S. commerson bireylerinde
gözlemlenirken (0.005) en düşük türiçi genetik çeşitlilik ise K. pelamis ve E. alletteratus
bireyleri arasında (0.000) gözlemlenmiştir. En yüksek ve en düşük nükleotid farklılığı ise
sırasıyla S. commerson - S. colias (0.201) ve T. alalunga - T. thynnus (0.005) arasında
tespit edilmiştir.
Acknowledgements
This study is the Master Thesis of D.S. Thanks to the Scientific and Technological
Research Council of Turkey (TUBITAK-111T481) and BAP-8420 for financial support.
References
Alvarado Bremer, J.R., Naseri, I., Ely, B. (1997) Orthodox and unorthodox
phylogenetic relationships among tunas revealed by the nucleotide sequence
analysis of the mitochondrial control region. J. Fish Biol. 50: 540–554.
Alvarado Bremer, J.R., Viñas, J., Mejuto, J., Ely, B., Pla, C. (2005)
Comparative phylogeography of Atlantic bluefin tuna and swordfish: the
combined effects of vicariance, secondary contact, introgression, and population
expansion on the regional phylogenies of two highly migratory pelagic fishes.
Mol. Phylogenet. Evol. 36: 169–187.
Asahida, T., Kobayashi, T., Saitoh, K., Nakayarma, I. (1996) Tissue
preservation and total DNA extraction from fish stored at ambient temperature
using buffers containing of urea. Fisheries Science 62: 727-730.
Avise, J.C. (1994) Molecular Markers, Natural History and Evolution. Chapman
and Hall, New York, USA, 511 pp.
Chow, S., Nakagawa, T., Suzuki, N., Takeyama, H., Matsunaga, T. (2006)
Phylogenetic relationships among Thunnus species inferred from rDNA ITS1
sequence. Journal of Fish Biology 68: 24–35.
Collette, B.B. (2003) Family Scombridae Rafinisque 1815-mackerels, tunas, and
bonitos. In: Annotated Checklist of Fishes (ed., C. A. Sci), San Francisco,
California. 19: pp. 28.
Collette, B.B., Nauen, C.E. (1983) F.A.O. Species Catalogue. Vol. 2. Scombrids
of the World. An Annotated and Illustrated Catalogue of Tunas, Mackerels.
FAO, Rome.
42
Collette, B.B., Reeb, C., Block, B.A. (2001) Systematics of the tunas and
mackerels (Scombridae). In: Tuna: Physiology, Ecology, and Evolution. (eds.,
B.A. Block, E.D. Stevens) Fish Physiology, 19.Academic Press, San Diego,
California, pp. 1–33.
Collette, B.B., Russo, J.L. (1979) An introduction to the Spanish mackerels,
genus Scomberomorus. In: Proceedings of 1979 Colloquium on the Spanish and
King Mackerel Resources of the Gulf of Mexico (eds., E.L. Nakamura, H.R.
Bullis, Jr.) Publ. Gulf States Marine Fisheries Commission (4), pp. 3-16.
Felsenstein, J. (1985) Confidence limits on phylogenies: An approach using the
bootstrap. Evolution 39 (4):783-791.
Fricke, R., Bilecenoglu, M., Sari, H.M. (2007) Annotated checklist of fish and
lamprey species (Gnathostoma and Petromyzontomorphi) of Turkey, including a
Red List of threatened and declining species. Stuttgarter Beitr. Naturk. Sea A.
706: 1-172.
Froese, R., Pauly, D. (2015) FishBase. (http://www.fishbase.us). (Accessed
10.11.2015).
Hall, T.A. (1999) BioEdit: a user-friendly biological sequence alignment editor
and analysis program for Windows 95/98/NT. Nucl. Acids Symposium Series
41: 95-98.
Hauser, L., Turan, C., Carvalho, G.R. (2001) Haplotype frequency distribution
and discriminatory power of two mtDNA fragments in a marine pelagic teleost
(Atlantic herring, Clupea harengus). Heredity 87: 621–630.
Hebert, P.D.N., Cywinska, A., Ball, S.L., deWaard, J.R. (2003). Biological
identifications through DNA barcodes. Proceedings of the Royal Society of
London B 270: 313–321.
Keskin, E., Atar, H.H. (2013) DNA barcoding commercially important fish
species of Turkey. Molecular Ecology Resources 13: 788–797.
Kimura, M. (1980) A simple method for estimating evolutionary rate of base
substitutions through comparative studies of nucleotide sequences. Journal of
Molecular Evolution 16: 111-120.
Kochzius, M., Nölte, M., Weber, H., Silkenbeumer, N., Hjörleifsdottir, S.,
Hreggvidsson, G. O., Marteinsson, V., Kappel, K., Planes, S., Tinti, F.,
Magoulas, A., Garcia Vazquez, E., Turan, C., Hervet, C., Campo Falgueras, D.,
Antoniou, A., Landi, M., Blohm, D. (2008). DNA microarrays for identifying
fishes. Marine Biotechnololgy 10: 207–217.
43
Kochzius, M., Seidel, C., Antoniou, A., Botla, S. K., Campo, D., Cariani, A.,
Vazquez, E. G., Hauschild, J., Hervet, C., Hjörleıfsdottir, S., Hreggvidsson, G.,
Kappel, K., Landi, M., Magoulas, A., Marteinsson, V., Nölte, M., Planes, S.,
Tinti, F., Turan, C., Venugopal, M.N., Weber, H. Blohm, D. (2010). Identifying
fishes through DNA barcodes and microarrays. PLoS One 5 (9): 1-15.
Kress, W.J., Erickson, D.L. (2008). DNA barcodes: Genes, genomics, and
bioinformatics. PNAS: 105 (8): 2761–2762.
Meyer, A. (1993) Evolution of mitochondrial DNA in fishes. In: Biochemistry
and Molecular Biology of Fishes. Elsevier Science Publishers 2: 1-38.
Mohindra, V., Singh, R.K., Palanichamy, M., Ponniah, A.G., Lal, K.K. (2007)
Genetic identification of three species of the genus Clarias using allozyme and
mitochondrial DNA markers. Journal of Applied Ichthyology 23: 104–109.
Mudumala, V.K., Somvanshi, V.S., Lakra, W.S. (2011) Phylogenetic
relationships of coastal tunas inferred from mitochondrial DNA sequences in the
cytochrome C oxidase I (COI) gene - a study on DNA barcoding. IOTC-2011WPNT. 01-12.
Romeo, T., Azzurro, E., Mostarda, E. (2005) Record of Acanthocybium solandri
in the Central Mediterranean Sea, with notes on parasites. Journal of Marine
Biology Ass.UK 85: 1295–1296.
Sachithanandam, V., Mohan, P.M., Muruganandam, N., Chaaithanya, I.K.,
Arun, Kumar, P., Siva Sankar, R. (2012) DNA Barcoding, phylogenetic
diversity studies of Etroplus suratensis fish from Pooranankuppam brackish
water, puducherry. International Journal of Current Research and Review 4(8):
33-42.
Saitou, N., Nei, M. (1987) The neighbour-joining method: a new method for
reconstructing phylogenetic trees. Molecular Biology and Evolution 4: 406-425.
Sanger, F., Nicklen, S., Coulson, A.R. (1977) DNA Sequencing with chainterminating inhibitors. Proceedings of the National Academy of Sciences 74:
5463-5467.
Tabata, K., Taniguchi, N. (2000) Differences between Pagrus major and Pagrus
auratus through mainly mtDNA control region analysis. Fisheries Science 66:
9-18.
Tamura, K., Peterson, D., Peterson, N., Stecher, G., Nei M., Kumar, S. (2011)
MEGA5: Molecular evolutionary genetics analysis using maximum likelihood,
44
evolutionary distance, and maximum parsimony methods. Molecular Biology
and Evolution 28: 2731–2739.
Thompson, J. D., Higgins, D.G., Gibson, T.J. (1994). CLUSTAL W: improving
the sensitivity of progressive multiple sequence alignment through sequence
weighting, position-specific gap penalties and weight matrix choice. Nucleic
Acids Reserach 22: 4673–4680.
Turan, C. (2011) The systematic status of the Mediterranean Spicara species
(Centracanthidae) inferred from mitochondrial 16S rDNA sequence and
morphological data. Journal of Black Sea/Mediterranean Environment 17: 4-21.
Turan, C., Ergüden, D., Çevik, C., Gürlek, M., Turan, F. (2015a) Molecular
systematic analysis of shad species (Alosa spp.) from Turkish marine waters
using mtDNA genes. Turkish Journal of Fisheries and Aquatic Sciences 15 (1):
149-155.
Turan, C., Gunduz, I, Gurlek, M., Yaglıoglu, D. (2008) Systematics of
Scorpaenidae species in the Mediterranean Sea inferred from mitochondrial 16S
rDNA sequence and morphological data. Folia Biologica 57: 219-226.
Turan, C., Gurlek, M., Erguden, D., Yaglioglu, D., Ozturk, B., Uyan, A.,
Reyhaniye, A. N., Ozbalcilar, B., Erdogan, Z. A., Ivanova, P., Soldo, A.
(2015b). Population Genetic Analysis of Atlantic Bonito Sarda sarda (Bloch,
1793) using Sequence Analysis of mtDNA D-Loop Region. Fresenius
Environmental Bulletin 45 (3): 231-237.
Turan, C. (2007) Atlas and Systematics of Marine Bony Fishes of Turkey. (ed.
C. Turan), Nobel Yayınevi, Adana, Turkey. 549p. (in Turkish).
Vinas, J., Tudela, S. (2009) A validated methodology for genetic identification
of tuna species (Genus: Thunnus). PLoSONE 4(10): e7606.
Ward, R.D., Zemlak, T.S., Innes, B.H., Last, P.R., Hebert, P.D.N. (2005) DNA
barcoding Australia’s fish species. Phil. Trans. R. Soc. B. 360: 1847–1857.
Received: 02.01.2016
Accepted: 15.01.2016
45
© Copyright 2026 Paperzz