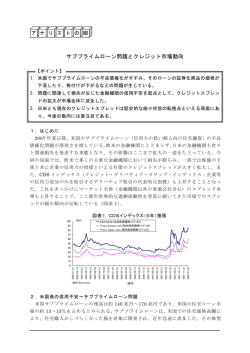
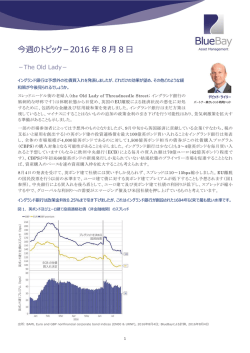
2015 年第 4 四半期見通し 2015 年 10 月 債券市場レビュー 第 4 四半期見通しサマリー 市場見通し 今回のプルデンシャル・フィクスト・インカム(以下、PFIM)四半期見 通しでは、チーフ・インベストメント・ストラテジストのロバート・ティッ プ(Robert Tipp)が、米連邦準備制度理事会(FRB)の過去の利 上げサイクル、第 3 四半期にみられたボラティリティ上昇の要因、 さらに債券市場で浮上している投資機会についてご説明します(3 ページ参照)。 エマージング債券に注目— 過去から学ぶ 今四半期は、エマージング債チーム の責任者であるデヴィット・ベッシー (David Bessey、左側)とエマージン グ・ソブリン債ストラテジスト兼ポート フォリオ・マネージャーのキャシー・ ヘプワース(Cathy Hepworth)が PFIM のチーフ・エコノミストであるユルゲン・オデニウス(Jürgen FRB に起因する過去のボラティリテ Odenius)は、ユーロ圏における量的緩和(QE)が拡大する可能性、 ィ上昇局面と、当セクターの最近の乱高下を比較します。 日本経済が引き続き苦闘している理由、中国の景気減速が世界経 全概要については 11 ページをご覧ください。 済に及ぼす影響について検証し、経済に関するグローバルな視点 をご提供します( 6 ページ)。 セクター別展望 社債(7 ページ): 拡大したスプレッド水準と健全なファンダメン タルズを踏まえ、社債市場について前向きなスタンスを取って います。米国金融セクターの銘柄を選好します。 ビデオによる見通し プルデンシャル・フィクスト・インカム(PFIM)のウェブサイトの PrudentialFixedIncome.com では、PFIM の投資専門家による見 通しをビデオでご提供いたします。今四半期は以下の通りです。 クレジット・ポートフォリオ・マネジメントの責任 者であるスティーブン・ケルナー(Steven Kellner)は、社債セクターが今後年末にか けて 良好なパフォーマンスが見込まれる理 由についてご説明します。 グローバル・レバレッジド・ファイナンス(9 ページ):ハイイール ド債(エネルギーを除く)は来年アウトパフォームすると予想し ています。欧州ハイイールド債のスプレッドについてはユーロ 安、エネルギー価格の低下、コモディティに対するエクスポー ジャーが低いことなどから、前向きな見方をしています。 エマージング債券(11 ページ): コモディティ輸入国や一部の輸 出国のハードカレンシー建て債券の投資価値を選別して見出 しています。 チーフ・インベストメント・ストラテジストのロバ ート・ティップは予想される FRB の利上げと の関連で現在の市場環境に関する視点をご 提供します。 地方債(12 ページ): 相対的な割安さ、および年末にかけてテ クニカル面が下支え要因となることから、前向きに見ていま す。 エマージング社債ポートフォリオ・マネージャ ーのテレンス・ウィート(Terence Wheat)は エマージング社債市場で大きなニュースとな る投資テーマ、および当セクター内で投資機 会が存在する分野についての洞察をご提供 します。 グローバル金利(13 ページ): 当セクターでは臨機応変なスタ ンスを取り、米国物価連動国債(TIPS)に投資機会を見出して います。日本国債とカナダ国債に対してはそれほど前向きな 見方をしていません。 モーゲージ債(13 ページ): MBS は金利から見て魅力的であ るものの、他の高格付けスプレッド・セクターは相対価値ベー スで依然割安と見ています。 証券化商品(14 ページ): PFIM は最優先トランシェに対して非 常に強気な見方を維持するとともに、現在の市場の混乱は、 配分を増やす好機とみなしています。 その他の洞察… 「The Art and Science of CLO Analysis(CLO 分析の技術と科 学)」(ウェブサイト:http://www3.prudential.com/fi/pdf/prudentialfixed-income-clo-analysis-0915.pdf)の中で、証券化商品リサー チ・チームのプリンシパルであるジョン・ディ・パオロ(John Di Paolo)(CFA、FSA)、レバレッジド・ファイナンス・チームのプリン シパルであるブライアン・ジュリアーノ(Brian Juliano,)、レバレッ ジド・ファイナンス・チームのヴァイスプレジデントであるエドウィン・ ウィルチェス(Edwin Wilches)(CFA)は CLO セクターのニュアン スをうまく捉えるのに必要な定性的・定量的な特性について説明し ます。 2 ページ 債券市場見通し 波乱の物語 2015 年の夏は、高いボラティリティを予想していた者にとって予想 通りの展開となりました。米連邦準備制度理事会(FRB)が 2006 年以降初めて利上げに踏み切る可能性を前に積み上がっていた 圧力は、様々な市場に脅威をもたらしました。実際に目にした「リ スクオフ」の動きの一部は、米ドル高、信用スプレッドの拡大、コモ ディティ価格の下落、新興国株式と現地通貨建て新興国債券の 軟化といった既存のトレンドの継続でしたが、新たなトラブルの兆 候も浮上しました。 まず、中国当局は資本逃避の加速に対応して、8 月初めに自国 通貨(人民元)の大幅な切り下げという異例の措置を講じました(4 ページを参照)。投資家は中国の経済と通貨がさらに弱含むとす れば、世界経済の減速や世界各国通貨の下落ペースの加速など の影響や波及効果が引き起こされるのではないかと考えたため、 低調な市場環境がさらに悪化しました。8 月中旬の時点で、市場 のムードは極めて暗くなったため、年の大半を通じてかなり落ち着 いたレンジで推移していた米国株でさえ 10%超下落しました。こ れは米国株としては 2011 年以降で最大の下げ幅であり、しかも わずか数日間で起こったのは注目に値します(4 ページを参照)。 激しい動きを背景に、市場の不安を示す主要な指標である VIX 指数は一時 50 を突破し、世界金融危機を除く過去 20 年間で最 も高い水準まで急上昇しました。また、今夏はリスク選好度の急 速な低下を背景に市場全体にわたりスプレッドが拡大した一方で、 固有の要因が存在する分野で特に圧力が高まりました。これに該 当するのは、エネルギーなどの特定のセクターやブラジルなどの 特定の国々でした。 FRB の利上げ:笑い事ではない FRB の利上げサイクルは、1 回限りの短期的なものであろうと複数年にわたる連続的なものであろうと、往々にして悲惨な結果に終わり ます。直近の例によると、市場の圧力は量的緩和縮小を契機に生じ、ここ数カ月間では FRB のいわゆる「利上げ開始」をめぐる不安が 高まり始めるのに伴い再び台頭しました。 7 04年-06年利上げ 08年の金融危機 フェデラル・ファンド Fed Funds U.S. Corp Agg OAS 米国社債総合OAS 6 99年-00年利上げ2001年 9月11日同時多発テロ 後の景気減速、不正会 計問題 5 4 3 97年利上げ 97年アジア危機 98年ロシア危機 2 1 0 出所:ブルームバーグ. 3 ページ 13年量的緩和 停止示唆、株 式市場の混 乱、新興国通 貨の下落 15年利上げ観測 スプレッドの 拡大 債券市場見通し 米国債利回りは 2015 年上半期には景気に対する楽観的な見方 と FRB による利上げ懸念を背景に上昇するも、第 3 四半期には 反転 図に示す四半期の状況 8 月の中国通貨切り下げは、 最後まで平静さを保っていた米国株式市場の腰を折った 2.6 6.0 2175 6.1 2125 2.4 6.1 2075 6.2 6.2 2025 2.2 2.0 6.3 1975 6.3 1.8 6.4 1.6 6.4 6.5 6.5 Chinese Yuanvs vs.米ドル U.S. Dollar 中国人民元 S&P 500 Index (rhs) S&P500インデックス(右軸) 1875 1825 8 月には市場の不安が急速に高まったことで、VIX 指数は世界金 融危機の時期を除き過去 20 年間で最も高い水準に上昇 1.4 第 3 四半期にはスプレッドが継続的に拡大 bps 500 100 90 10-year U.S. 米国 10 年国債利回り Treasury Yield (%) 1925 BB BB 格ハイイールド債スプレッド High Yield Spreads EM EM ハード・カレンシー・スプレッド Hard Currency Spreads VIX 450 U.S. IG Corp. Spreads (rhs) 米国投資適格社債スプレッド(右軸) bps 530 480 430 80 400 380 70 330 60 350 280 50 40 30 300 180 250 130 20 10 230 200 80 0 「図に示す四半期の状況」のチャートの出所:ブルームバーグ、 VIX データは CBOE。 市場が利上げを予想する時に何を予想するべきか 3 ページのチャートに見られるように、過去の FRB の利上げサイ クルでは市場の混乱が散見されるため、FRB の行動の結果とし て不安定な状況がもたらされる可能性があります。ただし、幸いに も FRB は状況を見据えながら運営を行っており、利上げがリスク を伴うことを認識しています。このため、株価の下落と信用スプレ 4 ページ 債券市場見通し ッドの拡大によって既に事実上金融引き締め状態になっていると の判断から、FRB は 9 月の FOMC 会合で利上げを見送ることを 決定し、状況を悪化させることを回避しました。FRB の 9 月の利 上げ見送りを受けて、市場は沈静化したため、イエレン議長は利 上げの時期が十分に近づいているとのシグナルを発信しました。 市場は四半期末(9 月末)にかけて落ち着きを取り戻しました。右 のパフォーマンス一覧に示されるように、広範な高格付け債券市 場の指標となる総合指数の四半期および年初来リターンは 1%を 上回りましたが、債券市場の長期セグメントと低格付けセグメント はリスクオフのセンチメントを背景に様々な度合いで打撃を受けま した。 低調な雇用統計によって最初の利上げはさらに遠のく 10 月初めに発表された米国の雇用統計を受けて、雇用の伸びが 過去 2 カ月間で大幅に鈍化していることや賃金の伸びが低迷して いることが明らかになりました。成長が低迷し、極めて弱い分野が あるという世界的な状況の中で、米国の経済成長減速の可能性 を示唆するこうした兆候は、FRB に 10 月の利上げを思いとどまら せるだけでなく、12 月の利上げに対するハードルも大幅に引き上 げる可能性があります。 今の状況は? 全体として、債券市場では今年の夏に、投資妙味が高まりました。 スプレッドはファンダメンタルズや市場利回りの水準と比較して極 めて魅力的な水準まで拡大しました。しかし、投資家は世界経済 の低迷、低水準の金利、迫り来る FRB の利上げ開始によって市 場が不安定化する可能性について引き続き神経を尖らせていま す。こうした懸念は単に投資家の行動を抑制するだけではなく、場 合によっては、資金調達圧力が実際にファンダメンタルズに打撃 を与えるという悪循環に近い状況を生み出します。 セクター別パフォーマンス (2015 年第 3 四半期トータル・リターン) 米国債 トータル・リターン (%) 2015 年 年初来 第 3 四半期 1.76 1.80 地方債 CMBS 1.65 1.54 1.77 2.24 エージェンシーMBS 米国総合 1.30 1.23 1.61 1.13 米国投資適格社債 欧州レバレッジド・ローン 0.83 0 -0.10 3.40 欧州投資適格社債 米国レバレッジド・ローン -0.34 -1.22 -1.88 1.61 ハードカレンシー建てエマージング債 欧州ハイイールド債 -1.71 -2.07 -0.07 0.36 米国ハイイールド債 S&P 500 株価指数 -4.90 -6.44 -2.53 -5.29 -10.54 -14.91 現地通貨建てエマージング債(ヘッジなし) 出所:バークレイズ、ただし、エマージング債は JP モルガン、ハイイールド債はメリ ルリンチ、レバレッジド・ローンはクレディ・スイス、欧州社債は iBoxx(ヘッジなし)。 パフォーマンスは 2015 年 9 月 30 日現在。インデックスの名称については後述のイ ンデックスの 記載をご覧ください。過去の運用実績は将来の運用成果を保証するも のでも、信頼できる指標となるものでもありません。直接インデックスに投資すること はできません。 このため、FRB の利上げを待つ間に、市場ではさらにほころびが 生じて、ボラティリティが継続的に高まる余地があります。しかし、 最終的に FRB が利上げに着手しても、利上げは恐らく極めて小 幅なものにとどまるとみられます。短中期的には、不透明感を背 景にスプレッドの拡大した状態が続く可能性がある一方で、長期 的にはスプレッド・セクターが大幅にアウトパフォームする結果に つながる可能性があります。 さらに、長期米国債利回りは比較的低水準のレンジ内にとどまる ため、利回り追求姿勢に引き続き拍車がかかるとの見方を維持し ています。そして、このプロセスが進展するのに伴い、投資家の懸 念とそれに伴う市場の大幅かつ頻繁な変動が、セクターや銘柄の 選別やデュレーションや通貨の管理を通じて超過収益を生み出す 機会を提供し続けると予想します。 要点:短期的に不透明、長期的な見通しは依然として債券(特 にハイ・イールド債セクター)にとって有利で、アクティブ運用を 通じて価値を付加する好機があります。 5 ページ 2015 年第 4 四半期セクター見通し 世界経済の成長見通しは依然 低調で、大きなリスクにさらさ れている 世界経済の見通しは、FRB の最終的な利上げ開始や新興国固 有のリスクの中で、金融引き締めによる影響を受け続けています。 先進国では、米国と英国の金融引き締め見通しが景気サイクル の進んだ段階を反映したものであるのに対して、ユーロ圏と日本 の中央銀行は追加金融緩和を検討しています。 しかし、金融政策の正常化は、下記の図に示すように世界の負債 比率が過去最高の水準にあるという背景の中で起こるとみられま す。以前に負債比率を押し上げた外国資本は新興国から流出し つつあり、これにコモディティ価格の下落と利回り上昇が加わり、 経済成長に対する大きな逆風となっています。それでも、大規模 な景気刺激策には弾みがついている模様であり、中国の経済成 長を短期的に押し上げる可能性があります。ただし、中期的な見 通しは依然として不透明です。 世界/先進国/新興国の負債比率* (対 GDP 比 %) 300 世界 World Advanced Economies 先進国経済 Emerging Economies (rhs) 新興国経済(右軸) 270 170 160 140 120 110 180 2 ユーロ圏 — QE 拡大の見通し 景気低迷の兆候は 、 外生的要因によるものであろうと、内需によ るものであろうと 、 ECB の QE プログラムの拡大を引き起こすと みられます。政策変更は 12 月の金融政策会合で発表され、その 際にマクロ経済見通しも修正される可能性があります。その一方 で、ECB は主にユーロ高を阻止し 2%のインフレ目標を達成する ため、口先介入を続けるとみられます。ECB のチーフ・エコノミスト のピーター・プラート氏の言葉を引用すると、「我々には使命があ り、できることは何でもやる」ということです。3 130 210 一方、インフレ指標は依然として軟調で、目標を大きく下回ってい ます。それでも FRB は、コモディティ価格の下落とドル高による一 回限りのディスインフレ効果を見極める態勢を整えている模様で す。フィッシャーFRB 副議長が 2015 年 8 月のジャクソン・ホール でのスピーチで指摘したように、FRB は「…インフレ率が 2%に回 復するまで引き締め開始を待つべきではありません」。1 しかし、 中国における予想以上に急速な景気減速が新たなディスインフレ につながるのではないかとの懸念の中で、FRB は 9 月の利上げ を見送りました。世界経済の見通しをめぐるこうした不透明感が大 きく変化していないのはほぼ間違いありませんが、イエレン FRB 議長は 9 月の FOMC での決定直後に、同議長を含む大半の FOMC 参加者が今年後半の利上げ開始を予想していると指摘し、 同議長としては極めて明確な形で FRB の利上げを示唆しました。 中国に起因する潜在的なディスインフレ・ショックをめぐる懸念を背 景に、欧州中央銀行(ECB)の金融政策担当者は警戒姿勢を取っ ています。こうした懸念は持続的な「低インフレ」を背景に広がって います。コモディティ価格の下落は総合インフレ率を引き続き押し 下げる一方で、コア・インフレ率は 1%近辺にとどまっています。 ECB は 9 月に発表した直近の四半期見通しの中で、2016 年の 総合インフレ率予想を 1.5%から 1.1%へと大幅に下方修正し、 2017 年の予想については小幅に引き下げて 1.7%としました。 180 150 240 する中で、民間内需は堅調です。これは個人消費を主な原動力と して第 2 四半期 GDP 成長率が最近上方修正されたことにも見て 取れます。 100 出所:国際決済銀行(BIS)、プルデンシャル・フィクスト・インカム。 *家計、 非金融企業、公的部門全体の負債比率として定義し、推定値は 40 カ国の 代表的な先進国・新興国に基づいています。 米国 — FRB による最終的な利上げ開始 米国の景気拡大が、それ自体で当初の利上げに耐えられる水準 まで成熟している点に関しては、疑う余地はほとんどありません。 雇用市場が 9 月の予想外の冷え込みにもかかわらず堅調に推移 http://www.federalreserve.gov/newsevents/speech/fischer20150829a.htm 参照 http://www.federalreserve.gov/newsevents/speech/yellen20150924a.htm 参照 3 http://www.bloomberg.com/news/articles/2015-09-10/praet-says-ecb-vigilant-inpreventing-unwarranted-tightening-iee7erdg 1 2 6 ページ 2015 年第 4 四半期セクター見通し 日本 — アベノミクス第 2 弾 中国/新興国(除く中国)の負債比率*(対 GDP 比 %) 300 日本経済は苦闘しており、テクニカルなリセッション(景気後退)に 陥るリスクが第 3 四半期から継続しています。しかし、労働市場は 依然として引き締まった状況にあり、失業率は 3.3%と 20 年来の 低水準まで低下しています。このため、賃金と消費の伸びが見込 まれます。一方、8 月のコア・インフレ率(生鮮食品とエネルギーを 除く消費者物価指数)は前年同月比 1.1%の小幅な上昇となりま したが、他の国々とは異なり 総合インフレ率は低水準(前年同月 比 0.2%)を維持しています。円が安全な避難先とみなされている ことや、最近数カ月にわたる金融市場の乱高下局面における円高 は、日本の経済成長とインフレ見通しにとって逆風となっています。 持続的な景気の弱さを受けて、スタンダード・アンド・プアーズ (S&P)が 9 月に日本国債を「A+」(見通しは安定的)に格下げしま した。財政の安定性に関する国際通貨基金(IMF)の懸念に同調 する形で、S&P は債務の悪化傾向が中期的に収まる可能性が低 いとの見方を示しました。安倍首相は 9 月に「アベノミクス第 2 弾」 を発表しました。特に直近の政策発表は名目 GDP を 2020 年ま でに 20%増やし、人口減少を抑制し、特に高齢者を対象とする社 会福祉を構築することを目標に掲げています。これらの目標を下 支えする具体的な施策はまだ発表されていませんが、潜在成長 率が約 0.5%であることを踏まえると、名目成長の目標達成は難 しいことが判明する可能性が高いと言えます。安倍首相は、タイミ ングは不透明ながらも日銀が政府に追随して新たな形態の景気 刺激策を講じるための素地を作った、との観測が広がっています。 エマージング市場 — 貿易条件ショックの中でのデレバレッジ(負 債圧縮) 新興国市場は米国の金融引き締めによる打撃を受けています。 右図に見られるように、特に急激な米ドル高は広範かつ一貫した 負債の増加を受けた通貨のミスマッチを露呈させました。大半の 国々では、負債の増加は民間部門がその多くを占め、公的部門 の変化(特に対外債務)は相対的に控え目な水準にとどまってい ます。コモディティ輸出国では、最近のコモディティ価格ショックに よってこうした歪みが増幅されたのに対して、コモディティ輸入国で は歪みが大幅に緩和されています。資本流出が増加する中で、政 策当局はこれまで主要な緩衝材として為替レートに大きく依存して きましたが、これはソブリン債のファンダメンタルズにとって全体的 に下支え材料となる展開です。 250 China 中国 130 新興国経済(除く中国)(右軸) Emerging Economies excluding China (rhs) 125 120 115 200 110 105 150 100 95 100 90 出所:国際決済銀行(BIS)、プルデンシャル・フィクスト・インカム。 *家計、 非金融企業、公的部門全体の負債比率として定義し、推定値は 40 カ国の 代表的な先進国・新興国に基づいています。 世界経済の成長をめぐる懸念は、中国の最近の景気減速によっ て増幅しています。第 3 四半期見通しで論じたように、地方政府 の大規模な財政逼迫はこの景気減速によって大幅に悪化してい ます。 しかし、それ以降政策当局は大幅な軌道修正に着手しています。 以前の財政緊縮は事実上解消された一方で、通貨ペッグ制の緩 和と資本勘定解放のため以前に導入した施策の一部撤回によっ て、金融政策の柔軟性は回復しています。これは政策当局が緩 和的な金融市場の状況をもたらすのに役立つとみられます。短期 的に見ると、これは経済成長の加速にとってとまではいかなくとも、 安定化にとって良い兆候ですが、中期的に中国を持続的な成長 軌道に乗せることができるか否かについては依然として不透明で す。特に持続的な成長達成は、国有企業体制を中心とする実体 経済の構造改革に決定的に左右されますが、これはまだクリティ カル・マス(普及するポイント)に達していません。 米国および欧州の投資適格社債 第 3 四半期には世界経済の成長減速と大量の新規発行をめぐる 懸念を背景に、米国と欧州の投資適格社債の上昇は抑制されま した。米国社債はイベントリスクの高まりによっても打撃を受け、ト ータル・リターンは+0.83%、米国債に対する超過リターンは-146 bps となりました。同年限の米国債に対する米国社債のスプレッド は第 3 四半期に 24 bps 上昇して 169 bps となっています。欧州 7 ページ 2015 年第 4 四半期セクター見通し 社債のスプレッドも拡大し、32 bps 上昇の 155 bps で四半期を終 えました。欧州社債のリターンは四半期が-0.34%、年初来が1.88%となっています。 トータル・リターン スプレッドの変化 第3 第3 年初来 四半期 年初来 四半期 半には一段と厳しい新たな資本バッファー基準、すなわち「総損失 吸収能力」(TLAC)規制の発表が予想され、これが S&P による格 下げにつながりかねないため、大手銀行はボラティリティ上昇に見 舞われる可能性があります。 OAS 産業セクター内では自動車・化学・一部の小売・製薬などの企業 を選好しています。また、利益が米ドル高に影響されやすい多国 籍企業や輸出主導型企業よりも米国中心型の発行体を重視して います。さらに、流通市場の既発債に対してディスカウント(コンセ ッション)で売買されたり、「イベント」が過ぎ去った一部の新発産 業銘柄に焦点を当てています。エネルギー・セクターに対しては慎 重な姿勢を維持していますが、当セクターのより拡大したスプレッ ド水準を踏まえた投資機会を模索しています。短期ゾーンでは BBB 格債を引き続き選好していますが、来たる短期金融市場規 制の変更に起因するスプレッドの激しい変化に留意しています。 2015 年 9 月 30 日 米国社債 0.83% -0.10% 24 bps 38 bps 169 bps 欧州社債 -0.34% -1.88% 32 bps 54 bps 155 bps データはバークレイズ米国社債インデックスおよび iBoxx ユーロ・コーポレー ト・インデックス(ヘッジなし)。出所:バークレイズ、iBoxx マークイット。2015 年 9 月 30 日現在。過去の実績は将来の結果を保証するものでも、信用できる指 標となるものでもありません。直接インデックスに投資することはできません。 米国社債 第 3 四半期の米国社債市場のファンダメンタルズ(エネルギー、 金属・鉱業を除く)は良好に推移し、多くの消費関連セクターが米 国の経済成長率の改善による恩恵を受けました。投資家が世界 経済の成長減速、コモディティ価格の下落、FRB の利上げ開始時 期をめぐる不透明感、デットファイナンスによる買収に起因する負 債の増加、配当の支払い、自社株買戻しが及ぼす影響への対応 を図る中、市場はしばしば厳しい状況に陥りました。年初来発行 額が前年を 20%上回る中、産業セクターを中心とする新規発行も 困難な状況をもたらしました。 第 3 四半期には、イベントリスクの高まりとエネルギー/コモディテ ィ価格の下落が産業セクターと BBB 格債券に対する重石となっ たため、金融セクターは大幅にアウトパフォームしました。年初来 のリターンは金融セクターが+1.37%、対して産業セクターが0.80%bps となっています。 堅調な米国経済の成長見通し、FRB による短期金利引き上げ開 始に伴いイールドカーブがフラット化する見通し、市場のボラティリ ティに起因する特定のセクターや発行体に対する広範な投資機会 を踏まえ、現在の拡大したスプレッド水準では社債に対して前向き な見方をしています。新規発行に対する投資家の需要は引き続き 旺盛で、大半の新規案件が応募超過となっている一方で、欧州と 日本では量的緩和(QE)を継続しており利回りが米国を大幅に下 回っているため、米国外の需要は依然として落ち着いています。 過去数四半期と同様に、シニア債、ジュニア債両方を含む米国金 融銘柄を引き続き選好します。金融セクターの発行体は自己資本 規制や流動性規制に対応するためバランスシートの強化を続行し、 イベントリスクには比較的影響されません。しかし、第 4 四半期後 また、スティープなクレジットカーブや金利上昇に伴う年金や保険 会社の需要拡大の可能性を踏まえ、長期債も選好しています。さ らに、政府の年金債務の増加による影響を受けない課税対象地 方債については、イベントリスクに概ねさらされないとの理由から、 引き続き選好しています。 欧州社債 欧州社債市場では世界経済の成長不安が主な原因でボラティリ ティが上昇する中、7 月~8 月の新規発行の急減を背景にスプレ ッドはレンジ内にとどまりました。9 月には供給ラッシュを背景に、 流通市場のスプレッドが低ベータと高ベータの両セクターにわたっ て拡大しました。欧州社債のスプレッドは第 3 四半期に 32 bps 上 昇し、劣後債がアンダーパフォームを主導しました。過去数四半 期と同様に、供給の大半を占めたのは、米国企業が利回りの相 対的に低い欧州市場で発行した「リバース・ヤンキー債」でした。 現在、ファンダメンタルズが多くの業種にわたってかなり堅調なこ とや、欧州の大半の国々で景気が底打ちしたことを踏まえると、欧 州社債のスプレッドは魅力的にみえます。ただし、新規発行ペー スが記録的な水準を維持し、流動性の引き締まった状況が続く場 合、スプレッドはさらに拡大する可能性があります。フォルクスワ ーゲンの排ガスをめぐるスキャンダル、中国の成長減速懸念、ギ リシャとスペインの選挙、そして流動性の低下などによる副次的影 響も、市場に対する重石となる可能性があります。 よりポジティブな点として、欧州中央銀行(ECB)が実施中の量的 緩和(QE)は引き続き支援材料になるとみられます。また、ECB は経済成長を後押しするために「必要なことは何でも」行うと発言 していることから、QE プログラムが 2016 年初めに拡大される可 当ページのデータの出所:バークレイズ 8 ページ 2015 年第 4 四半期セクター見通し 能性があるという点も好材料です。これに加えて、多くの業種や発 行体は原油価格の下落によってもたらされる「エネルギーの配当」 による恩恵を受けるとみられますが、こうした恩恵は今後数四半 期でなくなる見込みです。欧州の発行体は、M&A と株主重視の 施策が米国の水準を大きく下回る中で、イベントリスクにさらされ る心配が少ないと見られます。 第 3 四半期の PFIM の戦略は概ね変化はありませんでした。売 られ過ぎと判断した銘柄や魅力的なディスカウント(コンセッション) (四半期末で 20~30 bps)で発行された新発債への投資機会を 追求してきました。また、ユーロ圏周辺国の債券よりも英国や北欧 の銘柄を引き続き重視してきました。セクター別では、金融セクタ ーよりも、 送配電企業、空港運営会社など健全なバランスシート を持つ規制対象企業を含む、欧州の産業セクターを選好していま す。ハイブリッド 証券については、高格付けで安定した公益企業 が発行する特定の銘柄群に魅力があると考えますが、通信業界 などにみられる格付けを引き上げるために発行されたハイブリッド 証券は回避しています。銀行セクターでは、非ユーロ圏の発行体 や一部のシニア債を選好し ています。 グローバル・ポートフォリオでは、米国や欧州において選好する投 資アイデアを取り入れています。産業セクターよりも金融・保険セ クターを選好しながら米国銘柄をオーバーウェイトとし、また銀行 セクターより 産業セクター、保険セクターを選好しながら一部の欧 州銘柄もオーバーウェイトしています。残存期間の短い BBB 格社 債や米国の課税対象地方債を引き続き重視しています。米国で はスプレッド・カーブがスティープ化していることから、長期の社債 を選好しています。ユーロ 圏社債については、スプレッドが必ずし もリスクに見合わない長期の社債に対してはより選別的な姿勢を とっています。同一または類似の信用格付けの企業が発行した米 国社債とユーロ社債に関しては、引き続き両債券間の利回り格差 に着目していきます。 周期的な供給圧力が米欧両市場に対する重石となる局面が予想 されますが、特に QE プログラムがスプレッド縮小の支援 材料に なるとみられる欧州では、スプレッドが中長期的に縮小する余地 があると考えて います。第 4 四半期の主要なリスク要因としては、 世界経済の成長鈍化、大量の発行(ただし、市場ボラティリティの 高まりのため、四半期末には機動的な発行が低下しました)、流 動性の低下、そして米国ではイベントリスクの高まりなどが挙げら れます。 見通し:拡大したスプレッド水準、健全なファンダメンタルズ、ス プレッドが再び縮小する可能性を踏まえて、ポジティブなスタン スを取っています。引き続き米国の金融セクターを選好しま す。 グローバル・レバレッジド・ ファイナンス 第 3 四半期には中国経済をめぐる懸念、コモディティ価格の下落、 個人投資家の資金流出を背景に、ハイイールド債のスプレッドは 拡大しました。当セクター内のパフォーマンスはコモディティ関連ク レジットと非コモディティ関連クレジットの間で二分化された状態が 続いている一方で、特定銘柄のイベントは、米国のスプレッドが広 範にわたって拡大する原因となりました。現在、PFIM は、米国市 場は実現するとみられる以上の痛みを織り込むスプレッドが広範 に拡大していると見ています。さらに、スプレッドが然るべき水準ま で縮小するのに長い時間がかかるとしても、スプレッドのキャリー 自体は魅力的です。欧州のハイイールド債市場は、コモディティに 対するエクスポージャーが低かったことなどから、米国のハイイー ルド債市場をアウトパフォームしました。欧州のハイイールド債に ついては、限定的な新規発行と ECB の QE プログラム拡大の可 能性を踏まえ、前向きな見方を維持しています。 トータル・ リターン 第3 四半期 年初来 スプレッドの変化 第3 年初来 四半期 OAS 2015 年 9 月 30 日 米国 ハイイールド債 -4.90% 欧州 ハイイールド債 -2.07% 0.36% +103 bps +96 bps +573 bps 米国レバレッジド・ ローン -1.22% 1.61% +57 bps +23 bps +581 bps 欧州レバレッジド・ ローン 0.0% 3.40% +21 bps -4 bps +536 bps -2.53% +162 bps +158 bps +662 bps 出所:BofA メリルリンチ、クレディ・スイス。2015 年 9 月 30 日現在。過去の実績 は将来の結果を保証するものでも、信用できる指標となるものでもありません。 直接インデックスに投資することはできません。欧州のリターンは、ユーロ・ヘ ッジ付きです。 米国ハイ・イールド債およびレバレッジド・ローン 米国におけるスプレッドの拡大は比較的広範にわたるものでした が、コモディティ・セクターと非コモディティ・セクターでは各々のス 当ページのデータの出所:欧州社債=マークイット iBoxx、すべてのハイ・イールド債=BofA メリルリンチ、すべてのレバレッジド・ローン=クレディ・スイス。 9 ページ 2015 年第 4 四半期セクター見通し プレッド拡大を促した固有の要因が存在しました。第 3 四半期に は原油価格が 25%下落して同四半期末時点で 1 バレル=約 45 ドルとなったため、エネルギー・セクターは出遅れセクターとなりま した。石炭セクターも同様に需給面の問題に直面したため、この 2 つのコモディティ・セクターで 2015 年初来のデフォルト件数の約 3 分の 2 を占めています。 ムーディーズの予想によると、コモディティ関連クレジットの問題に もかかわらず、今後 12 カ月間の米国のデフォルト率は 3.4%と歴 史的な低水準にとどまるとみられ、大半のデフォルトは金属・鉱業 セクターに集中しています。さらに長期で見ると、次の信用サイク ルにおけるデフォルト率は、コベナンツの緩和によって借手の柔 軟性が高まるため、過去を下回る可能性が高いとみられます。 他の特定のセクターでは、スプレッドの拡大の背景にはマクロ関 連の要因よりもむしろ銘柄固有の要因がありました。無線通信事 業者が競争の極めて激しい環境の中、第 3 四半期にはムーディ ーズによるスプリントの格下げを受けて、市場では流動性の高い 銘柄の一つに対するリプライシング(条件改定)が行われました。 第 3 四半期には、買収資金の調達を目的としてフロンティア・コミ ュニケーションズが実施した 66 億米ドルの債券発行も通信セクタ ーを圧迫しました。アルティスやオリンなど、買収資金の調達を必 要とした他の企業は、市場の需給を均衡させるためにクーポンの 引き上げや発行規模の縮小が求められ、それを実行することで各 セクターのリプライシングが促されました。その他として、第 3 四半 期に航空宇宙関連企業のボンバルディアの債券は、低調な売上 高と高水準の現金消耗率を理由に軟調に推移しました。 第 3 四半期の市場のボラティリティを踏まえ、何社かは発行の先 送りをしたため、発行額は大幅に減少し、8 月の発行額は今年最 低となりました。資金調達を先送りした発行体は、状況が安定す れば市場に戻って来るとみられます。市場のボラティリティは、現 物債券と CDX のベーシスが 3 年半ぶりの拡大した水準に達した ことにも反映されました。 ポジショニングに関して言えば、最大のオーバーウェイトは公益、 テクノロジー、資本財セクターで、最大のアンダーウェイトはエネル ギー、金融セクターでした。 レバレッジド・ローンのリターンは-1.22%と、四半期としては 2011 年第 3 四半期以来最も悪いパフォーマンスを記録しましたが、年 初来は依然として 1.61%と、第 3 四半期を通じてハイイールド債 市場を 400 bps 以上アウトパフォームしました。ローン市場も相対 的に安定して推移し、平均価格のレンジは債券市場の 9 ポイント に対して、4 ポイントに収まりました。そのような相対的な安定性に もかかわらず、ローン市場において四半期末時点でパーを上回っ て取引されていたのは、6.5%のみでした。これは年間で最も低調 な水準であり、資金流出額は米国ハイイールド債市場の 67 億米 ドルに対して 109 億米ドルとなりました。 第 3 四半期はローン発行額も低調で、139 件の合計は 590 億米 ドルと、第 2 四半期の新規発行額を 1,000 億米ドル下回りました。 デフォルトも低水準にとどまり、デフォルト率は 1.3%で当四半期を 終えました。 欧州ハイイールド債およびレバレッジド・ローン 欧州では、スプレッドが第 3 四半期に格付け全体にわたって拡大 しましたが、ボラティリティが最も高かったのはアベンゴアなど特定 のクレジットでした。特にペトロブラスなど、コモディティ関連のフォ ーリン・エンジェル銘柄も、ハイイールド債指数に加わったのに伴 い、スプレッド拡大に寄与しました。 今後、欧州市場では新発債に対する魅力的なディスカウント(コン セッション)や発行ペースの落ち着き、そしてエネルギー価格の下 落と為替レートの競争力改善を背景に欧州経済が安定しつつあ る兆候などを踏まえ、スプレッドが縮小するとみています。そうした 側面とは逆に、厳しい流動性水準や中国経済の成長鈍化をめぐ る懸念など、マイナスの点もありますが、PFIM は欧州ハイイール ド債市場に対して全体的に前向きな見方をしています。 当資産ク ラス内ではリスクを重視し、シングル B 格銘柄が魅力的なスプレッ ドを提供すると考えます。欧州レバレッジド・ローン市場は、健全な 需要と限定的な供給、安定的なファンダメンタルズを背景に、特に 米国ハイイールド債市場と比較して堅調なリターンを上げていま す。今後に関しては、ローン市場の格付けは一般に欧州ハイイー ルド債市場を下回りますが、後者のスプレッドは前者を上回るた め、高格付けユニバースでは高めのスプレッドが提供されます。 見通し: ポジティブ。米国ハイイールド債(エネルギーを除く)は 管理可能な新規発行、米国の消費者(内需)に対する高いエク スポージャー、投資家の利回り追求姿勢を背景に、今後1年間 でアウトパフォームする見込みです。スプレッドのキャリーは現 水準では魅力的です。米国のレバレッジド・ローン市場のテク ニカル要因は、個人投資家の資金流出とCLO組成の減少を背 景に、厳しい状況にあります。欧州ハイイールド債について は、ユーロ安、燃料費の低下、コモディティに対するエクスポー ジャーの低下を踏まえ、前向きな見方をしています。 10 ページ 2015 年第 4 四半期セクター見通し エマージング債券 エマージング債券の第 3 四半期のリターンはまちまちでした。ハ ードカレンシー建てソブリン債のリターンは小幅なマイナスとなり、 エマージング社債がこれに続き、現地通貨建て債券(ヘッジなし) と新興国通貨は大幅なマイナス・リターンを記録しました。 トータル・リターン 第3 年初来 四半期 EM ハ ー ド カ レ -1.71% ンシー建て債券 EM 現地通貨建 て 債 券 ( ヘ ッ ジ -10.54% なし) スプレッドの変化 第3 年初来 四半期 OAS/利回り 2015 年 9 月 30 日 -0.07% 80 80 433 bps -14.91% 30 59 7.09% EM 通貨 -6.35% -7.48% 76 -58 4.97% EM 社債 -2.76% 0.85% 102 89 442 bps ディティ価格の下落や「ラヴァ・ジャット」と呼ばれる汚職事件によ る打撃を受けました。アンダーパフォームした他の国々にはコロン ビア(-11.03%)、モンゴル(-35.61%)、ナイジェリア(-11.38%)な どが含まれます。 過去の危機に目を向ける 一部の投資家は新興国市場の見通しに関する否定的な報道を踏 まえ、新興国市場が長期的な乱高下局面に入るか否かを見極め ようとしています。この見通しについては、過去の危機との比較が 有益かもしれません。 シナリオ I — 1980 年代の中南米 出所:J.P.モルガン。2015 年 9 月 30 日現在。過去の実績は将来の結果を保証 するものでも、信用できる指標となるものでもありません。直接インデックスに 投資することはできません。 ハードカレンシー建て債券でアウトパフォームしたのは、主に、ア ルゼンチン(+7.28%)、ベラルーシ(+6.19%)、ウクライナ (+50.18%)など格付けが低く固有の要因による国々で、ウクライ ナは当四半期中に投資家重視の再編計画を発表しました。アンダ ーパフォームしたのは、エクアドル(-18.67%)、ガボン(-13.25%)、 イラク(-13.28%)、ザンビア( -18.14%)などの原油・コモディティ 輸出国でした。ブラジル(-9.97%)も、「ラヴァ・ジャット」と呼ばれる 汚職事件に加えてムーディーズ(Baa3 へ)と S&P(BB+へ)による 格下げが響き、アンダーパフォームしました。東欧はコモディティ の動きに影響されづらいことや西側との強い結びつきを背景に、 最も良いパフォーマンスを上げた一方で、中南米とアフリカはアン ダーパフォームしました。 現地市場のリターンの要因となったのは、新興国通貨の低調なパ フォーマンスでした。ELMI+通貨指数の当四半期のリターンは 6.35%でした。第 3 四半期には米ドル高環境が復活し、FRB の利 上げ、新興国の成長鈍化、中国経済の見通し、世界貿易の軟化 といった懸念が全て新興国通貨市場に対する重石となりました。 ハードカレンシー建て債券と同様に、コモディティ輸出国の通貨が 特に打撃を受け、コロンビア(-15.14%)、マレーシア(-13.18%)、 南アフリカ(-10.74%)は、スキャンダルに見舞われたブラジル(19.42%)とともに大きくアンダーパフォームしました。 エマージング社債のリターンは、ブラジル(-16.86%)に対するエク スポージャーが足かせとなりました。ブラジルの社債の多くはコモ 1980 年代初めの中南米危機は、現環境の特性と同様に、低調な コモディティ価格と世界経済の成長減速に関連していました。しか し、当時は借り入れの大半が LIBOR をベースとしていたため、 FRB が利上げを実施して LIBOR が急上昇すると多くの国々は多 大な影響を受けました。現在、ソブリン債は過去 10 年間かけて償 還期日の延長に注力した結果、LIBOR に対する感応度は低くな っています。ブラジル、メキシコ、インドネシア、トルコ、そして多く の他の新興国の債券の平均年限は 10 年を上回り、実質的に全 ての債務が固定金利です。また、新興国通貨は 1980 年代初め にかけて著しく過大評価されていました。メキシコ・ペソは 1977 年 から 1981 年までの間に 31%上昇しました。現在、多くの新興国 通貨は過去 5 年の平均と過去 10 年の平均を大幅に下回る水準 で取引されています。 シナリオ II — 1990 年代後半のメキシコ、アジア、ロシア 1990 年代半ばから後半にかけて発生したメキシコ/アジア/ロシア 危機は、固定為替レートに関連した典型的な「国際収支」危機でし た。通貨ペッグ制を採用していた国々は、 通貨下落圧力に対抗す るため自国の実質金利を高水準に維持せざるを得ませんでした。 そして、この高金利は大量の短期資金の流入につながりました。 通貨ペッグ制が崩壊するのではないかと投資家が懸念するように なると、短期資金は流出し、各国中央銀行は為替レートを維持す るため外貨準備を使い果たすことを強いられました。最終的に新 興国はペッグ制の放棄に迫られ、銀行システムは圧力に見舞わ れ、信用創出の大幅な縮小に加えて、ソブリンや現地企業の資金 調達が極めて困難な状況に陥りました。当時と現在では何が違う のでしょうか?最も重要な点として、現在、大半の新興国通貨では 固定制ではなく変動制が採用されています。新興国通貨は大幅に 下落していますが、この下落は新興国経済にとって重要な安全弁 となっています。大半の新興国中央銀行では外貨準備高がわず かに減少するにとどまっており、全体的な外貨準備高は 5 年前の 水準を概ね上回っています。新興国通貨は下落によって相対的 11 ページ 2015 年第 4 四半期セクター見通し 地方債 に割安になっており、その多くは 2000 年代初め以降みられなか った水準に戻っています。これによって、輸出と外国投資の最終 的な回復に向けた下地が整うとみられます。 今後の展望 現状に目を移すと、新興国の債務水準はどうでしょうか。2007 年 以降、新興国は外貨建て債務の対 GDP 比を実際に低下させて います。いわゆる「フラジャイル・ファイブ(脆弱な 5 カ国)」(インド ネシア、トルコ、ブラジル、南アフリカ、インド)の外貨建て債務の 対 GDP 比は平均で 9.9%と、2007 年の 12.6%から低下していま す。公正を期するために言えば、政府総債務(自国通貨建てと外 貨建ての双方)の対 GDP 比は上昇していますが、それでも平均 で 46.5%と先進国の水準をはるかに下回っています。多くの国々 では 2009 年以降企業の債務が増加しており、監視する必要があ りますが、大半の国々でエマージング社債がシステミックなソブリ ン危機を引き起こす可能性は低いと考えています。 ただし、だからと言って、多くの新興国が現在直面している困難が 減じられるわけではありません。PFIM は今後数四半期において 格下げの数が格上げの数を上回ると予想しています。コモディティ 価格は多くの場合、半値に下げており、コモディティ生産者に悪影 響が及ぶことが予想されます。中国の経済成長は鈍化しており、 アジア内外の多くの貿易相手国からの輸入に下方圧力がかかっ ています。世界貿易は低調で、各国の輸出と経常収支の改善を 困難にしています。しかし、大半の国々にとって、バランスシートの 状態と通貨構造を鑑みると、こうした困難は管理可能であり、主要 新興国に対する信用危機が発生する可能性は低いと考えていま す。国別の分析を慎重に行うことで、当セクター内でミスプライスさ れた銘柄(割高・割安銘柄)を活用する機会がもたらされるはずで す。重要な点として、現在の低金利環境を踏まえると、特にハード カレンシー建て債券は魅力的な潜在リターンを提供すると考えて います。 見通し: 選別的スタンス。 特にコモディティ輸入国、およびアル ゼンチン、ロシア、カザフスタンなど一部のコモディティ輸出国 における、一部のハードカレンシー建て債券に投資価値がある と考えます。社債よりもソブリン債を選好しますが、特定の社債 には投資妙味があります。 利回りがほぼ10年ぶりの高水準 にある現地通貨建て債券の長期デュレーションを維持します。 新興国通貨については、最近の下落を受けたバリュエーション の改善を理由にショート・ポジションを縮小しました。 AAA 格の地方債はイールドカーブ全体にわたって米国債をアン ダーパフォームしましたが、長期ゾーンでは 30 年物米国債に対 する地方債の利回りレシオは第 3 四半期末時点で 106%と、横ば いでした。利回り低下を背景に、第 3 四半期のトータル・リターン はプラスとなり、高格付けと高利回りの非課税地方債のリターンは それぞれ 1.65%と 1.99%、年初来では 1.77%と 0.03%となりまし た。ハイイールド非課税地方債のリターンはプエルトリコ債の影響 (第 3 四半期:0.29%、年初来:-10.73%)を引き続き受け、年初来 ではほぼ横ばいとなりました。長期課税対象地方債のリターンは、 第 3 四半期が 1.72%、年初来で-1.61%でした。 第 3 四半期の新規発行ペースは引き続き低調でしたが、依然とし て 2014 年の水準を 8.5%上回っております。年初来の新規発行 額累計は前年同期比 32%増の 3,090 億米ドルとなっていますが、 借り換え分が新規発行全体の 50%以上を占めています。四半期 末時点の利回り低下にもかかわらず、第 3 四半期を通じて続いた ボラティリティが原因でミューチュアルファンドの資金アウトフロー につながりました。第 3 四半期の資金流出純額は 30 億ドルを上 回りましたが、年初来では 50 億ドルの資金流入超を維持してい ます。 プエルトリコでは、同自治領の発行体による最初のデフォルト、具 体的な内容を一部含む 5 年間の財政・経済再生計画、プエルトリ コ電力公社(PREPA)と債権者との間の暫定的な再生合意、そし て、PREPA と一部債権者との間の債権放棄合意の再延長など のニュース報道を投資家が消化する中で、第 3 四半期もボラティ リティの高い状況に見舞われました。債券価格は第 2 四半期末の 安値から概ね反発し、四半期のリターン改善につながりました。し かし、投資家が政府の債務再生案の発表を待つ中で、第 4 四半 期もボラティリティの上昇が続くと予想します。プエルトリコが最近 発表した報告書には、債務返済にあたって再生が「憲法上の優先 事項を反映し、かつ尊重することを目指す」と記載されていますが、 正式な提案は第 4 四半期初めまでに提出される予定です。報道 によると、政府高官とアドバイザーは政府開発銀行(GDB)の特定 の債券保有者らと債務交渉に関する会合を開きました。 年金問題に絡み、州や他の事業体に対する信用圧力が続いてい ます。イリノイ州は 7 月 1 日開始の 2016 年度予算が成立しない 中で運営を続けています。共和党の州知事と民主党が多数派を 占める議会は、構造的な財政不均衡と州の年金基金の大幅な積 み立て不足にいかに対応するかという点で引き続き対立していま す。シカゴ市も構造的な財政不均衡と年金積み立て不足の問題 に取り組んでおり、市長は自らが提案した不動産税引き上げによ 当ページのデータの出所:エマージング債=J.P.モルガン 、当ページのデータの出所:地方債の供給額=J.P.モルガン、地方債のリターン=バークレイズ。グロ ーバル金利=ブルームバーグ。 12 ページ 2015 年第 4 四半期セクター見通し って、これらの長期にわたる問題の一部に対応し始めるという政 治的意思を持っているようです。 響は、米国債が固定金利と LIBOR のスワップレートと比較して割 安になったことに最も如実に示され、スワップ・スプレッドは最終的 に記録的な低水準まで縮小しました。 第 4 四半期初めの新規発行額の増加は短期的に非課税地方債 が軟調に推移する可能性があります。しかし、金利が安定的また は低下傾向を示す環境は、ミューチュアルファンドへの資金流入 に寄与する可能性があります。これに加えて、非課税地方債の相 対的な魅力は機関投資家の需要を下支えするとみられます。こう した要因が年末にかけてのテクニカル面での良好な環境と相まっ て、第 4 四半期のアウトパフォームにつながるかもしれません。プ エルトリコ、イリノイ州、シカゴ市に関連するニュースによってこれ らの発行体の債券がニュースの見出しに登場するとみられる中で、 2015 年を通じて地方債市場への重石となってきた信用状況が第 4 四半期も続くとみられます。ニュース報道にもかかわらず、PFIM はこれらの信用状況が地方債市場全体に対するシステミック・リス クをもたらすことはないとの見方を維持しています。また、年金積 立不足問題は特定の州や地方自治体にとって依然として最大の 信用リスクであると引き続き考えています。課税対象地方債は米 国社債並みのパフォーマンスを上げると予想し、新規発行を受け て社債のスプレッドが拡大する場合には、課税対象地方債は米国 社債をアウトパフォームする可能性があると考えます。 見通し: 地方債の相対的な割安さと年末にかけての良好なテ クニカル環境に基づき、ポジティブな見方をしています。 グローバル金利 第 3 四半期は世界経済の成長鈍化、国際株式市場の乱高下、そ して FRB の潜在的行動に関する見通しなどをめぐる懸念が大勢 を占めました。ボラティリティの上昇は世界の先進国市場全体に わたる長期金利の持続的な低下につながりました。 オーストラリア 10 年債利回りは、中国の景気減速をめぐる懸念を 背景に、第 3 四半期に世界各国の債券価格の上昇を主導する形 で 40 bps 低下し、英国とドイツの利回りは 20 bps 超低下しまし た。FRB がほぼ 10 年ぶりの利上げに動く可能性があるにもかか わらず、米 10 年国債の利回りは 30 bps 低下して、2.00%をわず かに上回る水準で四半期を終えました。 軟化傾向とそれに伴うボラティリティ上昇の中で、10 年物利回り が安全な避難先としての米国債に対する需要により、2.00%を大 きく割り込む水準に押し下げるとの想定も考えられました。しかし、 新興国の通貨安と資本流出との間の強い結びつきを踏まえ、各 国中央銀行は既存の米国債ポジションの売却に動いたため、米 国債のバリュエーションの上昇は抑制されました。この売却の影 米スワップ・スプレッドがさらに縮小した背景には、固定利付き社 債が大量に発行され、ヘッジ目的で変動金利にスワップされたこ とにありました。これは米国に限った現象で、他の先進国市場の スワップ・スプレッドは第 3 四半期に安定推移、もしくは拡大しまし た。上述の影響が薄れるのに伴い、第 4 四半期にかけてスワッ プ・スプレッドの拡大を見込んだポジションに対して前向きな見方 を維持します。 世界の需要減退もコモディティ価格を引き続き圧迫し、米国のイン フレ期待の大幅な低下につながりました。5 年物のインプライド・ブ レークイーブン・インフレ率は第 3 四半期終了時点で 1.05%に接 近し、金融危機後の最低水準を記録しました。その結果、物価連 動国債(TIPS)は相対的に投資妙味があり、今後、名目米国債を アウトパフォームする可能性があります。 今後については、世界のマクロ経済状況に下支えされて米国債と ドイツ国債がプラスの絶対リターンを提供すると考えます。米国債 利回りは概ねレンジ内の動きにとどまるとみていますが、サイクル の現時点で景気が加速していないため、FRB は利上げを躊躇し、 米国債のさらなる良好なパフォーマンスにつながると考えられます。 欧州では、ECB の QE プログラムの継続と拡大の可能性が引き 続きドイツ国債を下支えすると見ています。 日本国債とカナダ国債に関しては、依然としてそれほど前向きな 見方をしていません。日本国債の利回りは、短期から残存期間 7 年までについては利回りがほとんどないため、第 4 四半期にはア ンダーパフォームする可能性があります。同様に、カナダ国債のイ ールドカーブはややスティープ化して、世界の他の市場をアンダー パフォームする可能性があります。 見通し: オポチュニスティック。米国TIPS、および10年物ドイツ 国債利回りの緩やかな低下に投資機会があるとみています。 日本国債とカナダ国債に関しては、それほど前向きな見方をし ていません。 モーゲージ債 第 3 四半期のエージェンシー・モーゲージ担保証券(MBS)のトー タル・リターンは 1.30%となり、米国債に対する超過リ ターンは22 bps となりました。年初来では 1.61%のリターンを上げていま す。第 3 四半期には FRB の利上げをめぐる不透明感や、より広 当ページのデータの出所:グローバル金利=バークレイズ。 13 ページ 2015 年第 4 四半期セクター見通し 範なマクロ面に絡むリスクオフの投資テーマを背景に、MBS はス プレッドのボラティリティ上昇に見舞われました。 第 3 四半期には、モーゲージ貸出金利がかなり狭いレンジにとど まったため、MBS セクターはプリペイメント(期限前返済)の減速 による恩恵を受けました。MBS の新規組成は、 季節的な住宅購 入活動に応じて増加したものの、モーゲージ貸出金利の水準から するとかなり抑制されました。FRB は MBS 再投資プログラムを続 行したため、供給消化に一役買いましたがが、プリペイメントが全 体として減速するのに伴い、月間の再投資額も縮小しました。 FRB 高官と連邦公開市場委員会(FOMC)議事録における最近 の発言からは、将来の MBS 再投資に関して具体的な計画が策 定されていないことが示唆されます。PFIM は MBS 再投資が 2016 年にかけても続くと考えています。 連邦政府抵当金庫(GNMA、ジニーメイ)セクターは、年初来パフ ォーマンスが最も悪いセクターとなっていますが、オバマ大統領が 1 月に住宅ローン保険料(MIP)の引き下げを発表した際に生じた 価格急落局面からは回復しています。MIP 引き下げに起因するプ リペイメントはその後減少し、投資家によるエクスポージャーの積 み戻しを促しました。 現在の MBS のスプレッドは米国債と比較して魅力的であると考 えます。金利が急低下したり、政府の政策リスクが再燃しない限り、 プリペイメントは控え目な水準にとどまると予想します。また、FRB の再投資プログラムは、最初の利上げ実施後もかなり長い期間に わたって継続すると予想しています。全体として、第 4 四半期の MBS のパフォーマンスは FRB の利上げ開始に関する市場の予 想や、広範なマクロ・リスクを踏まえた投資テーマによる影響を受 けると予想されます。 こうした環境の中で、前倒しの資金調達圧力が TBA ダラーロール 市場にマイナスの影響を及ぼすとの予想から、TBA よりも特定プ ールを引き続き選好します。中期モーゲージと比較して高い流動 性と魅力的なバリュエーションを備えた 30 年物モーゲージを引き 続き選好します。最後の点として、投資機会の浮上に応じて、引き 続き選別的に GNMA のポジションを組み入れていく方針です。 見通し: MBSは米国債と比較して魅力的にみえますが、他の 高格付けスプレッド・セクターの方が相対価値ベースで依然と して割安な水準にあります。 証券化商品 第 3 四半期は市場のボラティリティ上昇を背景として、また、他の スプレッド商品(例:社債)同様、スプレッドが拡大しましたが、ファ ンダメンタルズが依然として堅調で、スプレッドの拡大幅は他のセ クターを概ね下回りました。従来、第 4 四半期の環境は証券化商 品のスプレッドにとって良好であり、スプレッドが資産担保証券 (ABS)と商業用モーゲージ担保証券(CMBS)でこれほど拡大し たのは 2010 年、2012 年以来となりました。したがって、現在のス プレッドは証券化商品への配分を増やす絶好の機会であると考え、 引き続き資本構造上最上位のトランシェが最も投資妙味があると 見ています。 CMBS – 最もシニア部分の CMBS は、第 3 四半期に米国債をア ンダーパフォームしましたが、ファンダメンタルズは依然として魅力 的です。新発 10 年物スーパーシニア・コンデュイット型 CMBS の スプレッドは約 20bps 拡大し、スワップ(S)+120 bps 近辺の水 準となりました。資本構造上最下位の CMBS のパフォーマンスは 悪化し、スプレッドは BBB-格で 125 bps 拡大しました。第 3 四半 期にはエージェンシーCMBS のパフォーマンスも悪化し、スプレッ ドは 20 bps 拡大して S+70a となりました。AAA 格付けの単一の 資産/単一の借り手 (SASB)フローターのスプレッドは四半期を 通じて LIBOR (L) +115 -125 bps の水準で安定推移しました。シ ニア・メザニン・トランシェを含め SASB 証券化商品には投資価値 が散見されるとの見方を維持していますが、当セクターにはばら つきがあるため、担保を考慮することが最も重要です。シニア CMBS のスプレッドは広範にわたる市場のリスク解消による影響 を受け易いものの、CMBS のファンダメンタルズは依然として堅調 です。現在、商業用不動産価額は 2007 年のピークを 13%上回っ ていますが、キャップレートと価格は現水準では持続可能であるよ うにみえます。 新規発行の CMBS に関しては、融資引受基準が 一部緩和されていますが(インタレスト・オンリー・ローンや不動産 流通市場の拡大など)、新たに組成されたローンに対するデット・ サービス・カバレッジ・レシオ(DSCR)は金融危機前の水準を依然 として上回り、プロフォーマ・ベースの引受の利用は引き続き限定 的です。このため、新規発行の CMBS、特にスーパーシニア債に おいては広範にわたる信用の問題が引き起こされるとは予想して いません。レガシーCMBS のファンダメンタルズに関して言えば、 2006/2007 年の CMBS プールの債務不履行は依然として高水 準にありますが、緩やかながらも減少し続けています。金融危機 前に発行されたレガシー債の損失は AJ クラスやそれ以下のクラ スなど、劣後トランシェに限定される見通しです。コンデュイット型 CMBS 発行市場の 2014 年発行額は 600 億ドルでした。PFIM は 2015 年発行額を引き続き 650 億ドルと予想しています。これ は年初の大半の予想を約 15%下回ります。連邦住宅抵当公庫 当ページのデータの出所:モーゲージ債=バークレイズ。 14 ページ 2015 年第 4 四半期セクター見通し (ファニー・メイ)と連邦住宅金融抵当公庫(フレディ・マック)は 2014 年に集合住宅を担保として 500 億ドルの CMBS を組成し ましたが、2015 年の発行額は 600 億ドルとなる見込みです。市 場は引き続き第 3 四半期の新規供給額約 170 億ドルを消化でき ていますが、ディスカウント幅は 3~5 bps 拡大しています。 CMBS セクターのネット発行額はほぼゼロとなり、レガシー債の償 還分が新規発行分を相殺しました。一方、ネット・ベースのデュレ ーションの長期化はテクニカル面で大きな逆風となっており、市場 は 2016 年から 2017 年にかけての償還分のリファイナンスに対 処する必要があります。 ABS – 第 3 四半期には広範な市場の軟調、金利をめぐる不透明 感、ディーラーの流動性の低下に伴い、ABS のスプレッドが拡大 しました。米証券取引委員会(SEC)による投資会社法の規則 2(a)-7 の「マネー・マーケット・ファンド(MMF)改革」に関する改正 と銀行に対する規制がスプレッド・カーブの短期部分に対する圧 力となる中で、ベンチマークとなる短期 ABS は社債と歩調を合わ せる形で再びアンダーパフォームしました。ベンチマークのクレジ ットカード ABS や自動車ローン ABS のスプレッドは 5~10 bps 拡大しました(例えば、3 年物の AAA 格クレジッ トカード ABS の スプレッドは L+40 bps に、1 年物の AAA 格プライム自動車ロー ン ABS のスプレッドは L+35 bps にそれぞれ拡大)。注目すべき 点として、連邦政府保証民間学生ローン(FFELP)ABS 市場では、 債券が法律上の最終満期までに返済されない水準にまで担保の プリペイメントの速度が鈍化していることに対する懸念を理由に、 ムーディーズとフィッチが多数の債券を格下げ方向のクレジット・ ウォッチに設定したことを受けて、当四半期には圧力に見舞われ ました。プリペイメントの速度は、学生ローン債務の支払い負担軽 減のため政府支援プログラムが原因となり、低下しています。プリ ペイメントの緩やかな速度にもかかわらず、原ローンは 97%が依 然として政府保証付きであり、証券化商品の信用力が強化される 中で、元本損失に見舞われる可能性は極めて低いとみられます。 これらの債券のスプレッドは年限に応じて 50~100 bps 拡大して いますが、FFELP や民間学生ローンに関しては新規投資に絶好 のタイミングであるとは考えていません。格下げ見通しや、予想以 上に緩やかなプリペイメント速度を受けたリスク・プレミアムの見直 しを背景に強制売りが引き起こされれば、スプレッドがさらに拡大 する可能性があります。学生ローンは別として、ベンチマーク以外 の ABS のスプレッドは平均で 10 bps 拡大しました(例えば、例え ば、5 年物のシニア・レンタカーABS のスプレッドは L+100 bps に、3 年物のシニア・サブプライム消費者ローン ABS のスプレッド は L+170 bps にそれぞれ拡大)。第 3 四半期末時点の新規発 行 ABS 供給額は 1,450 億ドルと、昨年のペースを小幅に上回り ました。クレジットカードや自動車など、キャリーが相対的に低水 準で、長期的な上振れ余地が限定的なベンチマーク・セクターに 対しては中立のスタンスを取り、より優れた経済性を備えファンダ メンタルズが強固な特定の非ベンチマーク・セクターや銘柄の積 み増しを模索していきます。 非エージェンシー住宅モーゲージ – 政府支援機関(GSE)のクレ ジット・リスク移転案件にとっては、他のリスク資産同様に、困難な 四半期となりました。例えば、ファニーメイの CAS M1 のスプレッド は 35 bps 拡大し、長期 M2 債のスプレッドは 100 bps 拡大しまし た。これは、これまでに発行された全ての案件における優れた信 用パフォーマンスに反する動きでした。金融危機前に発行された シニア・レガシー債は CRT をアウトパフォームしたものの、それで も第 3 四半期には 0.5~1 ポイント下落しました。年間の返済率 が発行残高の約 15%に達し、新規発行が最小限にとどまる中で、 債券のテクニカル要因は良好な状況が続いています。また、ファ ンダメンタルズも引き続き改善しています。ローン組成支払い比率 は過去 4 年以上にわたり着実に上昇しており、住宅価格上昇 (HPA)は引き続き加速し(2015 年には 4~5%、2016 年は 2~ 4%と予想されます)、雇用の伸びは堅調に推移しています。2006 年/2007 年シニア債の re-REMIC(不動産モーゲージ投資コンデ ュイット)のシニア・トランシェに投資価値があるとの見方を維持し ています。ジュニア・トランシェによる信用補完によって信用プロフ ァイルが大幅に改善されているにもかかわらず、re-REMIC のシ ニア・トランシェは L+230~330 bps と極めて魅力的な水準で取 引されています。また、不良債権の証券化商品のシニア・トランシ ェにも投資価値を見出しており、これらの短期キャッシュフロー利 回りは約 4%に上り、原不動産価値に対して約 50%の信用強化 が図られています。この他、2005 年とそれ以前に発行された、十 分に信用補完されているサブプライム証券を引き続き選好してお り、これらの債券は L+175~225 bps のレンジで取引されていま す。非エージェンシー住宅モーゲージの投資家はデュレーションを ヘッジしていないため、金利がさらに上昇すると打撃を受ける可能 性があるとの見方を維持しています。米国以外に関して言えば、 英国ではレガシー債保有者のポジション見直しに拍車がかかった ため、不良債権の証券化商品のスプレッドは大幅に拡大しました。 今年、5 年物の AAA 格債券のスプレッドは約 100 bps 拡大して いますが、約 75 bps は第 3 四半期に生じて 、スプレッドは L+175 bps となりました。この水準は魅力的であると考える一方 で、大量の資産売却(特に英国政府によるノーザン・ロックのポジ ション解消)とスプレッドに及ぼす影響を注視しています。 CLOs - AAA 格の米国ローン担保証券(CLO)発行市場のスプ レッドは 10 bps 拡大し 3 L+150 bps となりました。これにより、 スプレッドは年初から概ね横ばいとなっています。スプレッド拡大 は、市場のボラティリティや規制面での進展がもたらした逆風によ るものでした。ただし、特に銀行、アセット・マネジャー、保険会社 当ページのデータの出所:証券化商品=バークレイズ、CLO=プルデンシャル・フィクスト・インカム 15 ページ 2015 年第 4 四半期セクター見通し などの需要が引き続き旺盛だったため、スプレッドの拡大は抑制 されました。流通市場では平均残存年限の短い CLO のスプレッド が 30 bps 拡大して L+140 bps となっています。これらの CLO のスプレッドが拡大した 背景には、プリペイメントのペースの鈍化、 規制動向に起因する銀行のバランスシートに対する懸念などがあ りました。例えば、金融危機以前の債券はボルカー・ルールを遵 守していません。欧州では、発行市場における AAA 格の CLO の ス プレッドは 5 bps 拡大して 3L+135 bps となりました。米国と は異なり、欧州ではリスク・リテンション規制の実施に関わる課題 や限定的な CLO 投資家基盤を背景に、供給が引き続き抑制され ています。CLO が発行市場および流通市場の双方で優れた相対 的価値を提供しているとの見方を維持しています。米国の発行市 場では、AAA トランシェに投資する投資家にとって、スプレッドや 融資条件を交渉する上で好ましい環境が続いています。長期的に は、CLO のスプレッドが縮小すると確信しています。一方、短・中 期的には、供給と規制動向がスプレッド動向を引き続き左右する とみられ、ファンダメンタル面で魅力的な資産クラスのポジションを 引き続き機動的に積み増す上で好ましい環境がもたらされると考 えられます。 見通し:資本構造上最上位のトランシェに対する非常にポジティ ブな見方を維持します。現在の市場の混乱は、配分を積み増 す絶好の機会であるとみています。シニア・メザニン・トランシェ のキャッシュフローに対して選別的にポジティブな見方をする 一方で、低格付けの新発CMBSについては、ローンの引受基 準が劣化しているため、ネガティブな見方をしています。 16 ページ 2015 年第 4 四半期セクター見通し 留意事項 本資料は、経済状況、資産クラス、有価証券、発行体または金融商品に関する資料作成者の見解、意見及び推奨を示したものです。本資料に記載されている情 報は、現時点でプルデンシャル・フィクスト・インカム(以下「PFI」)が信頼できると判断した情報源から入手したものですが、その情報の正確性、完全性、および情 報が変更されないことを保証するものではありません。本資料に記載した情報は、現時点(または本資料に記載したそれ以前の日付)における最新の情報です。 基礎となる前提条件および見解は予告なく変更されることがあります。PFIは情報の一部または全部を更新する義務を負うものではありません。また、情報の完全 性または正確性について明示黙示を問わず何ら保証または表明するものでなく、誤謬についての責任を負うものでもありません。 本資料を当初の配布先以外の方(当初の配布先の投資アドバイザーを含む)に配布することは認められておりません。またPFI の事前の同意なく、本資料の一部 または全部を複製することや記載内容を開示することを禁止いたします。本資料は特定の証券、その他の金融商品、または資産運用サービスの勧誘を目的とし たものではなく、投資に関する判断材料として用いるべきではありません。どのような投資戦略やリスク管理技術も、いかなる市場環境においてもリターンを獲得 できることや、リスクを解消できることを保証することはできません。過去のパフォーマンスは将来の運用成績を保証するものではなく、また信頼できる指標となる ものでもありません。投資は損失となることがあります。本資料に記載されている情報や本資料から導出した情報を利用したことにより(直接的、間接的、または 派生的に)被り得るいかなる損失ついても、一切責任を負いません。PFIおよびその関係会社は、それぞれの自己勘定を含め、本資料で示した推奨や見解と矛盾 する投資判断を下す可能性があります。 本資料はそれぞれのお客様の置かれている状況、投資目的、あるいはニーズを考慮しておりません。また、特定のお客様もしくは見込み客に対して特定の証券、 金融商品、または投資戦略を推奨するものでもありません。いかなる証券、金融商品、または投資戦略についても、これらが特定のお客様もしくは見込み客にとっ て適切であるかどうかに関する決定は下しておりません。本資料に記載された証券または金融商品についてのご判断はご自身で行ってください。 本資料に表示する予測や予想は本資料作成日時点のものであり、予告なく変更されることがあります。実際のデータはこれらの予想や見通しとは異なり、本資料 には反映されない可能性があります。予想や見通しは非常に不確実なものです。したがって、いかなる予想や見通しも幅広い見込まれる結果を単に表すものとし てみなされるべきものです。予測や予想は推測されたもので、仮定事項に基づく値であり、後日大幅に修正される可能性があるため、経済や市場の状況の変動に 伴って大きく変更されるおそれがあります。PFI はいかなる予想や見通しに関する更新や変更の義務を負うものではありません。 利益相反:PFI およびその関連会社が、本資料で言及した有価証券の発行体との間で、投資顧問契約や他の取引関係を結ぶ可能性があります。時には PFIおよ びその関連会社や役職員が、本資料で言及した有価証券や金融商品をロングもしくはショートするポジションを保有する可能性、およびそれらの有価証券や金融 商品を売買する可能性があります。PFIの関連会社が、本資料に記載する推奨とは無関係の異なる調査資料を作成して発行することがあります。営業、マーケテ ィング、トレーディングの担当者など、本資料作成者以外のPFIの従業員が、本資料に表示する見解とは異なる市場に関するコメントもしくは意見を、口頭もしくは 書面でPFIのお客様もしくは見込み客に提示する可能性、または、本資料に表示する見解とは異なる独自の投資案を提示する可能性もあります。利益相反もしく はそのおそれについて、詳しくは PFIのフォーム ADV 第 2A部をご覧ください。 PFI は、米国で登録している関連投資顧問会社であるプルデンシャル・インベストメント・マネジメント・インク(以下「PIM Inc」)およびプルデンシャル・ファイナンシャ ル(プラメリカ・ファイナンシャル)を通して事業を行っています。欧州および一部のアジアの国においては、PIM Inc および PFI はプラメリカ・インベストメント・マネジ メントおよびプラメリカ・フィクスト・インカムとして事業を行っています。プラメリ カ・ファイナンシャルは、英国プルーデンシャル社とはなんら関係がありません。 情報提供については、ドイツでは、プラメリカ・リアル・エステート・インターナショナル AG が担当しています。英国では、プラメリカ・インベストメント・マネジメントの 間接子会社であるプラメリカ・インベストメント・マネジメント・リミテッド(PIML)が、担当しています。PIML は英国金融行動監督機 構(FCA)の認可を受けており、 FCA の規制が適用される他(登録番号 193418)、欧州経済領域(EEA)内の様々な法域でも正式に認可を受けて います。一部のアジア諸国では、シンガポール 金融管理庁(MAS)に登録しその認可を受けた同国の投資運用会社であるプラメリカ・フィクスト・イ ンカム(アジア)リミテッドが担当しています。日本では、国内の 登録投資顧問会社であるプルデンシャル・インベストメント・マネジメント・ジャパン 株式会社が担当しています。プラメリカ、プラメリカのロゴ、およびロック・シンボル は、プラメリカ・ファイナンシャルおよびその関係会社のサービ スマークであり、多数の国・地域で登録されています。 © 2015 Prudential Financial, Inc. and its related entities. 各セクターのパフォーマンスは下記インデックスを参照しています: 米国投資適格社債:バークレイズ米国社債インデックス 欧州投資適格社債:iBoxx ユーロ社債インデックス 100%(ヘッジなし) 米国ハイイールド債:BofA メリルリンチ米国ハイ・イールド・インデックス 欧州ハイイールド債:メリルリンチ欧州通貨建てハイ・イールド(除く金融セクター)、2%コンストレイン・インデックス 米国優先担保付きローン:クレディ・スイス・レバレッジド・ローン・インデックス 欧州優先担保付きローン:クレディ・スイス・ウエスタン・ヨーロピアン・レバレッジド・ローン・インデックス:(全ての通貨に対するヘッジなし) 米ドル建てエマージング・ソブリン債:JP モルガン・エマージング・マーケット・ボンド・インデックス・グローバル・ディバーシファイド 現地通貨建てエマージング債(ヘッジなし): JP モルガン国債インデックス - エマージング・マーケット・グローバル・ディバーシファイド・インデックス エマージング社債:JP モルガン社債エマージング・ボンド・インデックス・ブロード・ディバーシファイド エマージング市場通貨:JP モルガン・エマージング・ローカル・マーケット・インデックス・プラス 地方債:バークレイズ米国地方債インデックス 米国国債:バークレイズ米国国債インデックス MBS:バークレイズ米国 MBS – エージェンシー固定金利インデックス CMBS:バークレイズ CMBS: ERISA 適格インデックス 米国総合インデックス:バークレイズ米国総合インデックス Page 17 2015 年第 4 四半期セクター見通し 留意事項 2 本資料はプルデンシャル・フィクスト・インカムが作成した"4th Quarter Outlook "をプルデンシャル・インベストメント・マネジメント・ジャパン株式 会社が翻訳したものです。 本資料は、特定の金融商品の勧誘または販売を目的としたものではありません。過去の実績は将来の成果を保証するものではありません。 本資料に記載されている市場動向等に関する意見等は本資料作成日時点でのプルデンシャル・フィクスト・インカムの見解であり、事前の通知な しに変更されることがあります。 本資料は、プルデンシャル・フィクスト・インカムが信頼できると判断した各種情報源から入手した情報に基づき作成していますが、情報の正確性 を保証するものではありません。プルデンシャル・フィクスト・インカムは、米国 SEC 登録投資顧問会社であるプルデンシャル・インベストメント・マ ネジメント・インクのパブリック債券運用部門です。 原文(英語版)と本資料の間に差異がある場合には、原文(英語版)の内容が優先します。詳細は原文(英語版)をご参照ください。 “Prudential”、プルデンシャル・ロゴおよびロック・シンボルは、プルデンシャル・ファイナンシャル・インクおよびその関連会社のサービスマークで あり、多数の国・地域で登録されています。 プルデンシャル・インベストメント・マネジメント・ジャパン株式会社は、世界最大級の金融サービス機 関プルデンシャル・ファイナンシャルの一員であり、英国プルーデンシャル社とはなんら関係がありません。 プルデンシャル・インベストメント・マネジメント・ジャパン株式会社 金融商品取引業者 関東財務局長(金商)第 392 号 加入協会 一般社団法人 日本投資顧問業協会、 一般社団法人 投資信託協会 PIMJ201510290588 Page 18 October 2015 The Fixed Income Review Q4 Outlook Summary Market Outlook Spotlight on EMD— Learning from the Past In this edition of Prudential Fixed Income’s Quarterly Outlook, Robert Tipp, Chief Investment Strategist, looks at the outcome of past Fed hiking cycles, other sources of volatility that surfaced in Q3, and the opportunities that have emerged within the fixed income markets (page 3). This quarter, David Bessey (left), Head of the Emerging Markets Debt Team, and Cathy Hepworth, EM Sovereign Strategist and Portfolio Manager, compare prior periods of Fed-induced volatility to the sector’s recent bout of turbulence. Jürgen Odenius, Prudential Fixed Income’s Chief Economist, provides his global view of the economy, examining the likelihood of QE expansion in the Euro area, why the Japanese economy continues to struggle, and the impact of China’s slowdown on the global economy (page 6). Sector Views Corporate Debt (p. 8): Given wider spread levels and healthy fundamentals, we are positive on the corporate market, favoring U.S. financial issuers. See page 11 for the full recap. Video Outlooks Our Web site, PrudentialFixedIncome.com, also features video outlooks from our investment professionals. This quarter: Global Leveraged Finance (p. 9): We believe U.S. high yield ex-energy will outperform over the next year and are constructive on European high yield spreads given the weaker euro, lower fuel costs, and lower commodity exposure. Steven Kellner, Head of Credit Portfolio Management, explains why the corporate sector should perform well for the remainder of the year. Emerging Markets Debt (p. 11): We are “selective,” continuing to find value in select hard currency bonds, particularly from commodity-importing countries and certain exporters. Robert Tipp, Chief Investment Strategist, provides perspective on the current market environment in the context of anticipated Fed rate hikes. Municipal Bonds (p. 13): Our positive view of the market is based on the relative cheapness of municipals combined with a supportive technical environment as we approach year end. Global Rates (p. 13): We are opportunistic in this sector, seeing opportunities in U.S. TIPS. We hold less constructive views of JGBs and Canadian government debt. Terence Wheat, Emerging Markets Corporate Portfolio Manager, gives some insight on the themes making headlines in the EM corporate market and areas of opportunity within the sector. Mortgages (p. 14): MBS look attractive to rates, but other high-quality spread sectors remain cheap on a relative value basis. Structured Product (p. 15): We remain very positive on top-ofthe-capital structure bonds and see the current market dislocation as an opportune time to increase allocations. Additional Insights… In “The Art and Science of CLO Analysis,” John Di Paolo, CFA, FSA, Principal, Structured Product Research Team, Brian Juliano, Principal, Leveraged Finance Team, and Edwin Wilches, CFA, Vice President, Leveraged Finance Team, explain the qualitative and quantitative characteristics needed to successfully navigate the nuances of the CLO sector. Page 2 Bond Market Outlook effects should the Chinese economy and currency weaken further—would it lead to a global economic slowdown and an even more rapid depreciation of world currencies? At that point in mid-August, the market mood became so grim that even U.S. stocks, which had been in a fairly placid range for most of the year, dropped over 10%—the biggest drop in U.S. stock prices since 2011—and notably, it happened over the course of just a handful of days (see the Quarter in Pictures). Tales of Whoa! Those expecting a volatile summer in 2015 got what they were looking for. The stresses that had been building ahead of the Fed's first potential rate hike since 2006 brought duress to a wide array of markets. Some of the “risk off” moves we witnessed were a continuation of existing trends—the rising U.S. dollar, widening credit spreads, falling commodity prices, and weakening emerging market stock and local bond markets—but new signs of trouble emerged as well. The fierceness of the move sent the VIX, a key benchmark of market anxiety, rocketing briefly above 50—the highest level of the past generation, barring the Great Financial Crisis. And while this summer swoon in risk appetite pushed spreads wider across the board, the pressure was particularly intense where idiosyncratic factors struck, which was the case in certain sectors, such as energy, and in certain countries, such as Brazil. First, in response to accelerating capital flight, the Chinese authorities allowed an uncharacteristically steep drop in the value of their currency in early-August (see the Quarter in Pictures). This aggravated the weak market environment as investors pondered the possible implications and knock-on Fed Rate Hikes: No Laughing Matter Fed tightening cycles, whether as short as one hike or a multi-year series, often end in calamity. In the most recent instance, the market stress began with taper, and it re-emerged in recent months as the fears of the Fed's so called “lift-off” began to boil. 7 Fed hikes rates in ’04-’06 followed by Great Financial Crisis Fed Funds U.S. Corp Agg OAS 6 5 4 3 Fed hikes in ‘97 culminate in Asia and Russia crises in ‘97 and ‘98. Fed hikes in ’99-00 culminates in 2001 slowdown followed by recession post 9/11 and accounting scandals. 2 1 0 Source: Bloomberg. Page 3 Approach of taper roils markets in ‘13 and fuels a bear market in EMFX. Anticipation of the Fed’s lift-off in ’15 has pushed spreads wider. Bond Market Outlook The Quarter in Pictures The August Chinese Currency Devaluation Broke the Back of the U.S. Stock Market—the Last Bastion of Quietude 6.0 Although Treasury Yields had Risen During the First Half of 2015 on Economic Optimism and Fears of Fed Rate Hikes, they Reversed Course in Q3 2.6 2175 6.1 2.4 2125 6.1 2075 6.2 6.2 2.2 2025 2.0 6.3 1975 6.3 1.8 6.4 1925 6.4 6.5 1.6 1875 Chinese Yuan vs. U.S. Dollar S&P 500 Index (rhs) 6.5 1825 August’s Spike in Market Anxiety Lifted the VIX to its Highest Level in a Generation, Outside of the Great Financial Crisis 1.4 Spreads Continued to Widen in Q3 bps 500 BB High Yield Spreads EM Hard Currency Spreads 100 90 10-year U.S. Treasury Yield (%) 450 VIX 80 U.S. IG Corp. Spreads (rhs) 400 70 bps 530 480 430 380 330 350 60 280 50 300 230 40 180 30 250 130 20 200 10 0 Source for charts in the Quarter in Pictures: Bloomberg and the CBOE for VIX data. Page 4 80 Bond Market Outlook Performance by Sector What to Expect When Markets Expect Rate Hikes (Sorted by Q3 2015 Total Returns) Uneasy conditions are a likely outcome of Fed action, since the trail of past Fed rate hike cycles is strewn with episodes of market dislocations, as observed in the preceding Fed chart. Fortunately though, the Fed is operating with its eyes open and realizes that hiking rates is not without risks. Hence, it opted to delay lift-off at the September meeting as falling stock prices and widening credit spreads were already effectively tightening financial conditions, and the Fed was reticent to exacerbate the situation. As the markets quieted after the Fed’s September pass, Fed Chair Yellen signaled that rate hikes would be coming soon enough. The markets simmered down towards quarter end, allowing the Aggregate index, a benchmark of the broad high-quality fixed income market, to post a return of more than 1% for the quarter and the year, but the returns of longer-term and lowerquality segments of the fixed income markets were hit to varying degrees by the risk-off sentiment, as indicated in the accompanying returns table. Weak Payroll Report Further Delays First Rate Hike In the first days of October, the U.S. employment report revealed that job growth had slowed significantly over the last two months of the quarter and that wage growth remained tame. Against a global backdrop of muted growth with pockets of extreme weakness, this sign that U.S. growth may be slowing is likely to both stay the Fed's hand in October and significantly raise the bar even for a December hike. So Where Does that Leave Us? Net net, value was created in the bond market over the summer. Spreads have been pushed to very attractive levels relative to fundamentals and relative to the level of market yields. But investors remain uneasy about the weak global backdrop, the low level of rates, and the potential for the Fed’s impending lift-off to destabilize markets. Concerns like these are not just holding investors back. In some cases, they are creating a near vicious cycle where funding stress actually hurts fundamentals. Total Return (%) Q3 2015 YTD U.S. Treasuries Municipal Bonds 1.76 1.65 1.80 1.77 Comm. Mortgage-Backed Securities Mortgage-Backed (Agency) 1.54 1.30 2.24 1.61 U.S. Aggregate U.S. IG Corporate Bonds 1.23 0.83 1.13 -0.10 European Leveraged Loans European IG Corporate Bonds 0 -0.34 3.40 -1.88 U.S. Leveraged Loans Emerging Markets Debt Hard Currency -1.22 -1.71 1.61 -0.07 European High Yield Bonds U.S. High Yield Bonds -2.07 -4.90 0.36 -2.53 -6.44 -10.54 -5.29 -14.91 S&P 500 Index Emerging Markets Local (unhedged) Sources: Barclays except EMD (J.P. Morgan), HY (Merrill Lynch), Senior Secured Loans (Credit Suisse), Euro Corp (iBoxx, unhedged). Performance is for representative indices as of September 30, 2015. See Notice for full index names. Past performance is not a guarantee or a reliable indicator of future results. An investment cannot be made directly in an index. So, there is room for further market unraveling and ongoing volatility as we wait for the Fed. In the end, however, when the Fed's rate hikes start, they will probably be limited to a very shallow path. While uncertainty may keep spreads wide over the near to intermediate term, over the long term, the net result could be substantial outperformance for the spreads sectors. Furthermore, we continue to expect long-term Treasury yields to remain relatively low and range bound, which will continue to fuel the search for yield. And as this process plays out, we expect investor uncertainty and the resulting wide and frequent market fluctuations to continue to provide aboveaverage opportunities for adding alpha through sector and issue selection as well as duration and currency management. Page 5 The Bottom Line: Short term uncertain; Longer-term outlook still favorable for fixed income—especially so for the higher-yielding sectors—with good opportunities for adding value through active management. Global Economic Outlook second quarter GDP that was in large part spurred by private consumption. Global Growth Prospects Still Subdued and Subject to Material Risks The global outlook remains overshadowed by a tightening in financial conditions amidst the eventual lift-off of Fed policy rates and idiosyncratic risks in the emerging economies (EEs). In the advanced economies (AEs), the prospective monetary policy tightening in the U.S. and the UK reflect the advanced stage of the economic cycle, while central banks in the euro zone and Japan are contemplating further policy easing. Monetary policy normalization, however, would be taking place within the context of an all-time high of global leverage, as shown in the chart below. Foreign capital that previously funded rising leverage has been flowing out from the EEs and, when combined with falling commodity prices and rising yields, is posing major headwinds to growth. Nevertheless, sizeable stimulus is seemingly gaining traction and may yet buoy growth in China over the near term, although the mediumterm prospects remain uncertain. Overall Leverage* (% GDP) 300 World Advanced Economies Emerging Economies (rhs) 270 180 170 160 140 130 210 120 110 180 Euro Area—Likely QE Expansion Concerns about a potential disinflationary shock emanating from China put policy makers on guard at the European Central Bank (ECB). These concerns are unfolding against the backdrop of continued “low-flation.” While the fall in commodity prices has continued to depress headline inflation, core inflation has been hovering around 1%. In its latest quarterly update in September, the ECB materially revised down its forecast for 2016 headline inflation to 1.1% (from 1.5%), while only marginally lowering its 2017 forecast (1.7%). Any signs of economic weakness—be it externally induced or domestic demand-driven—would most likely trigger a broadening of the ECB’s QE operations. It seems likely that a policy change may be announced at the December policy meeting, when the ECB will also revise its macroeconomic forecasts. In the meantime, the ECB is likely to continue to intervene verbally, in large part to stem euro appreciation and deliver on its 2% inflation target. In the words of Peter Praet, the ECB’s chief economist: “We have a mandate, and we’ll do whatever it takes.”3 150 240 Nevertheless, inflation indicators remain soft and well below target. The Fed, however, appears prepared to see through the disinflationary one-off effects from lower commodity prices and dollar strength. As Vice Chair Stanley Fischer pointed out in his Jackson Hole speech in August 2015, the Fed “...should not wait until inflation is back to 2% to begin tightening.”1 However, amidst concerns that the faster-than-anticipated slowdown in China may spell another disinflationary episode, the Fed refrained from raising rates in September. Although these uncertainties over the global outlook have arguably not changed in a substantive manner, in her clearest hint yet that the Fed would raise rates, Chair Janet Yellen indicated soon after the September decision that most FOMC participants, including herself, anticipate an initial rate hike later this year.2 100 Japan—Abenomics 2.0 Source: Bank for International Settlements and Prudential Fixed Income. *Defined as leverage across households, nonfinancial corporate and public sector; estimate is based upon 40 representative advanced and emerging economies. U.S.—Eventual Fed Lift-Off Few doubt that the U.S. expansion has matured to such an extent that, in isolation, it could not withstand an initial rate hike. Amidst solid performance of the labor market, despite an unexpected cooling in September, private domestic demand has been robust, as captured by the latest upward revision to The Japanese economy continues to struggle and risks slipping into a technical recession in the third quarter. Nevertheless, labor markets remain stretched—at 3.3% the unemployment rate has declined to a 20-year low—thus bolstering the outlook for wage and consumption growth. Meanwhile, core inflation (CPI excluding fresh food and See http://www.federalreserve.gov/newsevents/speech/fischer20150829a.htm See http://www.federalreserve.gov/newsevents/speech/yellen20150924a.htm 3 http://www.bloomberg.com/news/articles/2015-09-10/praet-says-ecb-vigilant-inpreventing-unwarranted-tightening-iee7erdg 1 2 Page 6 Global Economic Outlook energy) has edged up to 1.1% year-over-year in August, but, not unlike other countries, headline inflation remains lackluster (0.2% yoy). A major headwind for Japan’s growth and inflation outlook is the safe-haven status of the yen and its appreciation during the recent months of financial market volatility. Overall Leverage* (% GDP) 300 China Emerging Economies excluding China (rhs) 250 Continued economic weakness played a major role in S&P’s September decision to downgrade Japan’s sovereign rating (to A+ stable). Echoing concerns by the IMF over fiscal sustainability, the ratings agency suggested that adverse debt dynamics were unlikely to be stabilized over the medium term. In September, Prime Minister Abe unveiled “Abenomics 2.0.” The latest policy announcements, among other factors, aim to raise nominal GDP by 20% by 2020, mitigate the demographic decline, and step up social welfare, especially for the elderly. The concrete measures underpinning these targets remain to be announced, but the nominal growth target could well prove elusive given that potential growth is about 0.5%. Speculation is rife that Abe may have set the stage for the BoJ to follow on with some new form of stimulus, although the timing remains uncertain. Emerging Markets—Deleveraging Amidst a Terms of Trade Shock Emerging markets have been stung by tightening U.S. financial conditions, especially a soaring U.S. dollar that has exposed currency mismatches following a broad-based and persistent increase in leverage, as observed in the follow chart. In most countries, this increase has been predominantly in the private sector, with changes in public sector debt, especially external debt, relatively muted. The recent commodity price shock has compounded these strains for commodity exporters but, at the same time, has greatly alleviated strain for commodity importers. Amidst rising capital outflows, policy makers have so far opted to heavily rely on exchange rates as a primary shock absorber, a development that is overall supportive for sovereign credit fundamentals. 130 125 120 115 200 110 105 150 100 95 100 90 Source: Bank for International Settlements and Prudential Fixed Income. *Defined as leverage across households, nonfinancial corporate and public sector; estimate is based upon 40 representative advanced and emerging economies. Global growth concerns have been exacerbated by the recent slowdown in China. As discussed in our Q3 Outlook, a substantial tightening in local government finances greatly aggravated this slowdown. However, since then policy makers have embarked on a major course correction. The earlier fiscal tightening has been effectively unwound, while monetary policy flexibility is being regained by softening the FX peg and reversing some of the earlier measures to open the capital account. This should help policy makers to effect easier monetary conditions. Although this bodes well for a stabilization of growth, if not an acceleration over the near term, over the medium term, prospects for placing China on a sustainable growth trajectory remain uncertain. In particular, achieving sustainable growth will crucially depend on real sector structural reform, especially of the state-owned enterprise system, which has yet to reach critical mass. Page 7 Q4 2015 Sector Outlook Investor demand for new issues remains strong with most new deals oversubscribed, while non-U.S. demand remains healthy given ongoing quantitative easing and the significantly lower yields in Europe and Japan. U.S. and European Corporate Bonds Concerns over slowing global growth and bouts of heavy new issuance held back the U.S. and European investment grade bond markets in Q3. U.S. corporates were also buffeted by increasing event risk as they delivered a total return of 0.83% with an excess return to U.S. Treasuries of -146 bps. Corporate bond spreads over similar-maturity U.S. Treasuries rose 24 bps during the quarter to 169 bps. European corporate bond spreads also widened, closing 32 bps higher at 155 bps. European corporate bonds returned -0.34% and 1.88% for the quarter and year-to-date periods, respectively. Total Return Spread Change As in prior quarters, we continue to favor U.S. financial issues including both senior and junior money center debt. Financial issuers continued to strengthen their balance sheets to meet capital and liquidity regulatory requirements and are relatively immune to event risk. Later in Q4, however, larger banks may experience added volatility when new, higher minimum capital buffer or "total loss absorbing capacity" (TLAC) requirements are expected to be announced, which may result in rating downgrades by Standard & Poor’s. OAS Q3 YTD Q3 YTD 9/30/15 U.S. Corporate 0.83% -0.10% 24 bps 38 bps 169 bps European Corporate -0.34% -1.88% 32 bps 54 bps 155 bps Within industrials, we favor autos, chemicals, and select retail and pharmaceutical issuers. We are emphasizing U.S. “centric” issuers over multi-national and export-driven companies whose earnings are vulnerable to a stronger U.S. dollar. We are focusing on select new industrial issues that are coming at concessions to outstanding secondary levels and where an “event” has passed. Although still cautious on the energy sector, we are searching for opportunities in light of the sector’s wider spread levels. We continue to favor BBBrated bonds in shorter maturities, but are mindful of spread dislocations resulting from upcoming changes in money market regulations. Represents data for the Barclays U.S. Corporate Bond Index and IBoxx Euro Corporate Bond Index (unhedged). Sources: Barclays and IBoxx Markit, as of September 30, 2015. Past performance is not a guarantee or reliable indicator of results. An investment cannot be made directly in an index. U.S. Corporate Bonds Fundamentals in the U.S. corporate bond market remained favorable in Q3 (ex-energy and metals and mining) with many consumer-related sectors benefitting from a pick-up in U.S. economic growth. Market conditions were often challenging as investors tried to adjust to the effects of slowing global growth and lower commodity prices, uncertainty over the Federal Reserve’s lift-off, and increasing leverage from debtfinanced acquisitions, dividend payments, and share buybacks. New issuance also posed a challenge, primarily in industrials, as year-to-date issuance was 20% higher than last year’s pace. Financials were significant outperformers in Q3 as growing event risk and weakening energy and commodity prices weighed on the industrial sector and BBB-rated credits. So far this year, financials have returned +1.37% versus -80 bps for industrial bonds. We hold a constructive view on corporates at current wider spread levels given solid U.S. growth prospects, the likelihood the yield curve will flatten once the Fed begins raising shortterm rates, and the broader opportunity set across select industries and issuers resulting from the market volatility. We also favor longer-maturities given the steep credit curve and strong demand potential from pensions and insurance companies should rates rise. We continue to favor taxable municipal revenue bonds that are not subject to growing government pension deficits and are generally a safe haven from event risk. European Corporate Bonds Sharply lower new issuance in the Euro corporate market during July and August kept spreads range bound in the face of increased volatility, which was primarily driven by global growth fears. In September, a rush of supply pressured secondary market spreads across both low and high-beta sectors. Euro corporate spreads rose 32 bps in Q3 with subordinate bonds the main underperformers. As in prior quarters, much of the supply was from “reverse yankee” companies issuing in the lower-yielding European markets. Currently, we believe Euro corporate spreads appear attractive considering fairly robust fundamentals across many industries and the bottoming out of most European economies. However, spreads could rise further should the Sources of data on this page: Barclays Page 8 Q4 2015 Sector Outlook pace of new issuance continue at record levels and liquidity conditions remain tight. Fallout from VW’s emission scandal, concerns over slowing growth in China, and elections in Greece and Spain, as well as lower liquidity, may also weigh on the market. OUTLOOK: Positive given wider spread levels, healthy fundamentals, and the potential for spreads to tighten again. Still favor U.S. financial issuers. Global Leveraged Finance On a more positive note, the European Central Bank’s ongoing quantitative easing program should continue to provide support. Also encouraging is the ECB’s comments that it will do “whatever is needed” to spur growth, which could mean expanding the program, possibly in early 2016. Additionally, many industries and issuers should benefit from the “energy dividend” resulting from lower oil prices, although these benefits should run off in the coming quarters. European issuers remain a safe haven from event risk with M&A and shareholder-friendly initiatives well below U.S. levels. Our strategy in Q3 remained relatively unchanged. We looked for opportunities to invest in issuers we believed were oversold, as well as in new issues with attractive concessions (20-30 bps at quarter end). We continued to focus on UK and Northern European issuers over peripheral country debt. We favor Euro industrials, including regulated companies with solid balance sheets, such as electrical grids and airport operators, over financial issuers. We find value in certain corporate hybrids from stable, well-rated utility issuers, and are avoiding hybrids issued to uplift ratings, including those in the telecom industry. In the banking sector, we prefer noneurozone issuers and select senior bonds. In global portfolios, we are implementing our favorite ideas from the U.S. and Europe: an overweight in U.S. issuers favoring financials and insurance companies over industrials, as well as select European issuers, favoring industrials and insurance over banks. We remain focused on BBB-rated shorter maturities and U.S. taxable municipals. We favor longer maturities in the U.S, where the spread curve is steep, but are more selective on longer-term euro issues, where spreads do not necessarily compensate for the risk. We continue to take advantage of yield discrepancies between U.S. and euro bonds of the same and/or similar issuers. High-yield spreads pushed wider in Q3 amid concerns about the Chinese economy, renewed declines in commodity prices, and retail outflows. While performance within the sector remains bifurcated between commodity and non-commodity credits, events in specific names contributed to a broader widening in U.S. spreads. The broader spread widening also shapes our outlook going forward as we believe the U.S. market is currently pricing in more pain than will likely come to fruition. Furthermore, even if it takes longer for spreads to compress to where we believe they should be, the spread carry alone is attractive. The European high yield market outperformed its U.S. counterpart given its lower level of commodity exposure. We hold a constructive view of European high yield given the prospect for limited new issuance and a potential increase in the ECB’s QE program. Total Return Q3 YTD Spread Change Q3 YTD OAS 9/30/15 U.S. High Yield -4.90% European High Yield -2.07% 0.36% +103 bps +96 bps +573 bps U.S. Leveraged Loans -1.22% 1.61% +57 bps +23 bps +581 bps 0.0% 3.40% +21 bps -4 bps +536 bps European Leveraged Loans -2.53% +162 bps +158 bps +662 bps Sources: BofA Merrill Lynch and Credit Suisse as of September 30, 2015. Past performance is not a guarantee or reliable indicator of results. An investment cannot be made directly in an index. European returns euro hedged. U.S. High Yield and Leveraged Loans Although supply may periodically weigh on both markets, we believe spreads have room to tighten longer term, particularly in Europe where quantitative easing should support spreads. Key risks in Q4 include slowing global growth, heavy issuance (although there was less opportunistic issuance at quarter end due to increased market volatility), tighter liquidity, and, in the U.S., rising event risk. Although spread widening in the U.S. was relatively broad based, there were distinct factors that drove the respective widening in the commodity and non-commodity sectors. The energy sector was a familiar laggard during the quarter as crude oil prices declined by 25% in Q3 to end the quarter at about $45 a barrel. The coal sector faces similar supply/demand challenges, and the two commodity sectors have been responsible for about two-thirds of the default volume thus far in 2015. Sources of data on this page: European corporate bonds, Markit iBoxx; all high yield, BofA Merrill Lynch, all leveraged loans, Credit Suisse Page 9 Q4 2015 Sector Outlook Despite the challenges for commodity credits, the U.S. default rate is expected to remain historically low at 3.4% over the next 12 months, according to Moody’s, with most defaults expected in the metals & mining sector. Looking further ahead, the default rate during the next cycle is likely to be lower than those in the past as borrowers have more flexibility due to looser covenants. European High Yield and Leveraged Loans Within other, specific sectors, the drivers behind the spread widening were more idiosyncratic than macro related. Sprint Corp.’s downgrade by Moody’s during the quarter repriced one of the more liquid names in the market as the wireless carrier struggles in a highly competitive marketplace. Frontier Communications Corp.’s $6.6 billion bond offering to finance an acquisition also pressured the telecom sector during the quarter. Other firms that needed to raise acquisition financing, such as Altice and Olin Corp., needed higher coupons and smaller sizes to clear the market, and in doing so, contributed to the repricing of their respective sectors. Elsewhere, the debt of aerospace firm Bombardier was pressured during the quarter as the company faces slow sales and high cash burn rates. Looking ahead, we see spread tightening in the European market amid attractive new issue concessions, a subdued issuance pace, and signs that European economies appear to be steadying on lower energy prices and more competitive FX rates. Although there are negative points countering those aspects, such as challenging liquidity levels and concerns about slowing growth in China, our view towards the European high yield market is constructive overall. We continue to overweight risk within the asset class and believe single-B names offer attractive spreads. The European leveraged loan market has posted solid returns, particularly in comparison to the U.S. high yield market, amid healthy demand with limited supply and stable fundamentals. Looking ahead, although the loan market is generally lower quality than the European high yield market, spreads in the latter are higher, thus offering more spread for a higher-quality universe. Given the market volatility in Q3, issuers that could delay entering the market did so, leading to a steep reduction in issuance, making August’s volume the lowest of the year. Issuers that delayed raising capital will likely return to the market when conditions stabilize. The market volatility was also reflected as the basis between cash bonds and CDX reached the widest levels in three and a half years. While the spread widening in Europe occurred across the ratings spectrum in Q3, the greatest volatility was in specific credits, such as Abengoa. Fallen angel commodity names, particularly Petrobras, also contributed to the spread widening as they joined the high yield indices. OUTLOOK: Positive. We believe U.S. high yield (ex-energy) should outperform over the next year on manageable newissue supply, high exposure to U.S. consumers and investors’ reach for yield. Spread carry is attractive in the current range. U.S. leveraged loan technicals are challenging given retail outflows and reduced CLO formation. We are constructive on European high yield amid the weaker euro, lower fuel costs, and less commodity exposure. In terms of positioning, our largest overweights were in the utility, technology, and capital goods sectors, and our largest underweights were in the energy and financial sectors. While the -1.22% return for leveraged loans was the market’s worst quarterly performance since the third quarter of 2011, the asset class remains up 1.61% on the year, outperforming the bond market by more than 400 bps through the third quarter. The loan market has also remained relatively stable with the average price moving within a four point range, compared to nine points for the bond market. Even with that relative stability, only 6.5% of the loan market was trading above par at quarter end, which was the lowest level of the year, and it posted $10.9 billion in outflows compared to $6.7 billion in outflows from the U.S. high yield bond market. Emerging Markets Debt Emerging market debt returns were mixed in Q3, with hard currency sovereign returns modestly lower, followed by solid declines in EM corporate and steeper drops in local currency debt (unhedged) and EMFX. Loan issuance was also muted in Q3 with 139 deals totaling $59 billion, $100 billion less than the new issuance volume recorded in Q2. Default activity remained low as well with the rate ending the quarter at 1.3%. Page 10 Q4 2015 Sector Outlook Total Return EM Hard Currency EM Local Currency (Unhedged) EM FX EM Corporates Spread Change OAS/Yield Q3 YTD Q3 YTD 9/30/15 -1.71% -0.07% 80 80 433 bps -10.54% -14.91% 30 59 7.09% -6.35% -7.48% 76 -58 4.97% -2.76% 0.85% 102 89 442 bps perspective on the matter, a comparison with prior crises could be instructive. Scenario I — 1980’s Latin America Source: J.P. Morgan as of September 30, 2015. Past performance is not a guarantee or reliable indicator of results. An investment cannot be made directly in an index. Outperformers in hard currency were predominantly lowerquality, idiosyncratic countries, such as Argentina (+7.28%), Belarus (+6.19%), and Ukraine (+50.18%), with the latter announcing an investor-friendly restructuring during the quarter. Underperformers included oil and commodity exporting countries, such as Ecuador (-18.67%), Gabon (-13.25%), Iraq (-13.28%), and Zambia (18.14%). Brazil (-9.97%) also underperformed on a continuation of the Lava Jato scandal coupled with downgrades by Moody’s (to Baa3) and S&P (to BB+). Eastern Europe was the best performing region due to its low commodity sensitivity and strong ties to the west, while Latin America and Africa underperformed. Local market returns were driven by poor performance in EM currencies, with the ELMI+ currency index returning -6.35% for the quarter. The third quarter saw a resurgence of the strong USD environment, with concerns about a Fed rate hike, weakening EM growth, China’s economic outlook, and weakening global trade all weighing on the EM currency markets. As was the case with hard currency bonds, the currencies of commodity exporters were particularly hard hit, with Colombia (-15.14%), Malaysia (-13.18%), and South Africa (-10.74%) finishing the quarter as major underperformers, along with scandal plagued Brazil (19.42%). EM corporate returns were dragged down by exposure to Brazil (-16.86%), where many of the corporates were hit by the commodities selloff and the Lava Jato scandal. Other underperforming countries included Colombia (-11.03%), Mongolia (-35.61%), and Nigeria (-11.38%). The Latin American crisis in the early 1980’s was associated with weak commodity prices and slowing global growth— similar to the characteristics of today’s environment. Back then, however, most of the borrowing was LIBOR-based, leaving many countries highly exposed when the Fed raised rates and LIBOR spiked. Today, sovereigns have less LIBOR sensitivity after having spent the last decade extending their maturity profiles. The average life of bonds in Brazil, Mexico, Indonesia, Turkey, and many other EM countries is over 10 years, and virtually all of the debt is fixed rate. Additionally, EM currencies were spectacularly overvalued going into the early 1980s; the Mexican peso real effective exchange rate appreciated 31% from 1977 to 1981. Currently, many EM currencies are trading at levels which are substantially cheaper than their 5-year and 10-year averages. Scenario II — Late 1990’s in Mexico, Asia, and Russia The Mexican, Asian, and Russian crises in the mid to late 1990s were classic “balance of payment” crises associated with fixed exchange rates. Countries with currency pegs were forced to maintain high real local interest rates to resist currency depreciation pressures, and these high interest rates resulted in a flood of short-term inflows. As investors became concerned that the currency pegs might break, the short-term money flowed back out, and central banks were forced to spend down reserves to maintain the exchange rates. Eventually, the pegs had to be abandoned, putting pressure on banking systems and forcing a sharp reduction in credit creation and severe funding difficulties for sovereigns and local corporates. What is different today? Most importantly, most EM currencies are now floating rather than fixed. While EM currencies have depreciated sharply, this depreciation has been an important safety valve for EM economies. Most EM central banks have made only marginal reductions in foreign currency reserves, and overall reserve levels are broadly higher than they were five years ago. The selloff in EM currencies has made them relatively inexpensive, with many currencies back to levels not seen since the early 2000s. This should sow the seeds for an eventual recovery in exports and foreign investment. Looking Ahead… A Look at Past Crises Given the negative headlines regarding the emerging markets’ outlook, some investors are wondering whether we are heading into a prolonged period of EM turbulence. For some Moving to the current situation, what about overall debt levels? Since 2007, emerging market sovereigns have actually lowered the amount of foreign currency debt that they Page 11 Q4 2015 Sector Outlook owe as a percent of GDP. The average foreign currency debt/GDP ratio for the so-called “Fragile Five” (Indonesia, Turkey, Brazil, South Africa, and India) is 9.9%, down from 12.6% in 2007. To be fair, gross government debt (both local and foreign currency) is higher, but it still averages 46.5%, a level far below what is seen in the developed world. Corporate debt has risen in many countries since 2009 and needs to be monitored, but we believe it is unlikely that EM corporates could cause systemic sovereign crises in most countries. The pace of issuance continued to slow in Q3, but was still 8.5% higher than 2014 and YTD total supply of $309 billion represents a 32% increase vs. the prior year, with refunding volume comprising over 50% of the total. Despite lower yields by quarter end, volatility throughout Q3 likely weighed on mutual fund flows. Net outflows for Q3 exceeded $3 billion; however, YTD net flows remain positive at $5 billion. None of this is meant to diminish the difficulties currently facing many EM countries, and we expect more downgrades than upgrades over the upcoming quarters. Commodity prices have halved in many cases, leading to predictable negative impacts on commodity producers. China’s growth is slowing, putting downward pressure on imports from many trading partners across Asia and beyond. Global trade is anemic, making it difficult for countries to export and improve their current accounts. However, we believe that these difficulties are manageable for most countries given the state of sovereign balance sheets and currency structures, and we think that there is a low likelihood of a major EM crisis of confidence. Careful country-by-country analysis should provide opportunities to take advantage of mispriced securities within the sector. Importantly, in the context of the current low interest-rate environment, we believe that hard currency bonds in particular offer attractive prospective returns. The volatility in Puerto Rico continued in Q3 as investors digested the news flow from the island, including the first default by a Puerto Rico issuer, a 5-year fiscal and economic recovery plan with few details, a preliminary restructuring agreement between the Puerto Rico Electric Power Authority (PREPA) and a group of creditors, along with another extension of the forbearance agreement between PREPA and certain creditors. Bond prices generally bounced off the lows experienced at the end of Q2, resulting in improved quarterly returns. However, we expect volatility to continue in Q4 as investors await the Administration’s debt restructuring proposal. While a recent report from the Commonwealth noted that any restructuring will “reflect, and seek to respect Constitutional priorities” for GO debt repayment, a formal proposal has yet to be released by the start of Q4. Reportedly, officials and their advisers had an initial meeting with certain Government Development Bank (GDB) bondholders regarding a debt negotiation. OUTLOOK: Selective. We see value in select hard currency bonds, particularly from commodity importing countries and select exporters, such as Argentina, Russia, and Kazakhstan. We prefer sovereigns to corporates, although certain corporates are attractive. We maintain long duration in local bonds, the yields of which are near decade highs. We have reduced shorts in EMFX due to improved valuations after the most recent selloff. Municipal Bonds AAA-rated municipal bonds underperformed U.S. Treasuries across most of the yield curve but kept pace on the long end with the 30-year Municipal/Treasury yield ratio unchanged at 106% at quarter end. Lower yields led to positive total returns in Q3 for high grade and high yield municipals, 1.65% and 1.99%, respectively. Year-to-date (YTD) returns are 1.77% and 0.03% for high grade and high yield, respectively. High yield returns continue to be influenced by Puerto Rico credits which returned 0.29% in Q3 and -10.73% YTD. Long taxable municipals returned 1.72% in Q3 and -1.61% YTD. Credit pressures remain for states and other entities with pension issues. The State of Illinois continues to operate without a budget for fiscal year 2016, which began on July 1. The Republican Governor and Democrat-controlled legislature remain at odds over how to address structural imbalances in the budget and the significant underfunding of state pension plans. While Chicago also struggles with structural budget imbalances and underfunded pensions, the Mayor appears to have the political will to begin addressing some of these long standing issues with his proposed property tax increase. Increased supply early in Q4 could pressure tax-exempts near term. However, a stable-to-lower rate environment may contribute to positive mutual fund flows. In addition, the relative attractiveness of tax-exempts should be supportive of institutional demand. These factors, combined with a strong technical environment toward year end, could lead to outperformance in Q4. The credit stories that have weighed on the municipal market throughout 2015 will continue in Q4 as news related to Puerto Rico, Illinois, and Chicago will keep Sources of data on this page: Emerging markets debt, J.P. Morgan. Municipal bond supply, J.P. Morgan; Municipal returns, Barclays. Page 12 Q4 2015 Sector Outlook these credits in the headlines. Despite the headlines, we maintain that these credit stories do not pose a systemic risk to the broader municipal market. We continue to believe that unfunded pension liabilities remain the biggest credit risk for certain states and localities. We expect taxable municipals to perform in line with U.S. corporate bonds with the potential to outperform if supply continues to pressure corporate bond spreads. approached 1.05% as Q3 concluded, representing a postfinancial crisis low. As a result, U.S. TIPS offer very good value on a relative basis and could outperform nominal Treasuries going forward. Looking ahead, we believe global macro conditions continue to be supportive of positive absolute returns in U.S. Treasuries and German bunds. While we view U.S. Treasury yields as largely range bound, the lack of economic acceleration at this point of the cycle could give the Fed pause in raising rates and likely lead to further positive performance in U.S. Treasuries. In Europe, the continuation and potential expansion of ECB QE should remain supportive for German bunds. OUTLOOK: Positive based on relative cheapness of municipals combined with a supportive technical environment as we approach year-end. Global Rates We remain less constructive on JGBs and Canadian government bonds. With yields in Japan offering little compensation over cash rates out to the 7-year maturity, JGBs may underperform in the coming quarter. Similarly, the Canadian yield curve may steepen slightly and underperform other global markets. The third quarter was dominated by concerns of weakening global growth, turbulent international equity markets, and anticipation of potential Federal Reserve action. The increased volatility led to a sustained rally in long-term interest rates across global developed markets. Australian 10-year yields led the global bond rally, falling 40 bps in Q3 given concerns over China’s slowing economy, while yields in the UK and Germany declined more than 20 bps. Despite the potential for the first Fed interest-rate increase in almost a decade, U.S. 10-year Treasury yields declined 30 bps and finished the quarter just over 2.00%. OUTLOOK: Opportunistic. We see opportunities in U.S TIPS and breakeven rates as well as a gradual decline in 10-year bund yields. We hold less constructive views of JGBs and Canadian government debt. Given the weakening backdrop and the accompanying volatility, one might have assumed the safe-haven bid for U.S. Treasuries would have pushed the 10-year yield materially lower than 2.00%. However, the strong linkage between emerging market currency weakness and capital outflows led reserve managers to sell existing U.S. Treasury positions, which restrained the U.S. bond richening. The effect of this selling was most evident in the cheapening of Treasuries versus fixed-rate LIBOR swaps, and swap spreads consequently tightened to the lowest levels on record. Further compression of U.S. swap spreads was caused by a large amount of fixed-rate corporate bond issuance that was hedged to floating. This is exclusively a U.S. phenomenon, as other developed market swap spreads were stable to wider in Q3. We maintain a constructive view on swap spread wideners over the coming quarter as the aforementioned effects abate. Weakening global demand also continued to pressure commodity prices, which led to another steep decline in U.S. inflation expectations. Five-year implied inflation breakeven Mortgages Agency mortgage-backed securities delivered a total return of 1.30% in Q3 with an excess return to U.S. Treasuries of -22 bps. Year-to-date, the agency MBS sector has posted a return of 1.61%. MBS experienced increased spread volatility in Q3 given the uncertainty surrounding the Federal Reserve’s rate hike, as well as broader, macro risk-off themes. During the period, the MBS sector benefitted from declining prepayment speeds as primary mortgage rates remained in a fairly narrow range. MBS origination did rise in response to seasonal home purchase activity but was fairly contained given the level of mortgage rates. The Fed’s MBS reinvestment program continued, helping to absorb supply, although the size of the monthly reinvestment declined as aggregate prepayment speeds fell. In recent comments, Fed officials and Federal Open Market Committee minutes suggest that definitive plans have not been made regarding future MBS reinvestment, which we believe will continue well into 2016. Sources of data on this page: Global Rates, Bloomberg. Page 13 Q4 2015 Sector Outlook GNMAs, the worst performing sector so far this year, improved from the sharp price declines experienced when President Obama announced a mortgage insurance premium (MIP) cut in January. Prepayments resulting from the MIP cut have since fallen, which encouraged some investors to add back exposure. We believe current MBS spreads are attractive relative to U.S. Treasuries. We look for prepayments to remain muted unless interest rates rally sharply or government policy risk resurfaces. We expect the Fed’s reinvestment program to remain in place until well after the first interest rate hike. Overall, MBS performance in Q4 will be impacted by the market's expectation of the Fed’s initial rate hike, as well as broader macro risk themes. In this environment, we continue to favor specified pools over TBAs as we expect front-end funding pressures to negatively impact the TBA dollar roll market. We continue to favor 30year mortgages, which offer higher liquidity and more attractive valuations than intermediate mortgages. Lastly, we will continue to selectively cover GNMA exposure as opportunities arise. OUTLOOK: MBS look attractive to rates, but other highquality spread sectors remain cheaper on a relative value basis. Structured Product The third quarter was true to form as spreads widened in the structured product markets, primarily due to market volatility and in sympathy with other spread product (e.g., corporates); Fundamentals remain strong and the spread widening was generally less than in other sectors. The fourth quarter has historically been positive for spreads on structured products and one has to look back to 2010 and 2012 to find spreads this wide in ABS and CMBS, respectively. We therefore believe that current spreads offer a solid opportunity to increase allocations to structured product, and we continue to find the most value in top-of-the capital structure bonds. CMBS – Top-of-the-capital structure commercial mortgagebacked securities (CMBS) remain fundamentally attractive despite underperforming Treasuries in the third quarter. New issue 10-year, super-senior conduit bonds widened roughly 20 bps during the quarter to around Swaps (S)+120. Bottomof-the-capital structure CMBS performed worse, with BBBwidening 125 bps. Agency CMBS also performed poorly in the third quarter, with spreads widening 20 bps to S+70a. AAA-rated Single Asset/Single Borrower (SASB) floater spreads were stable throughout the quarter at LIBOR (L) +115 -125 bps. We still see pockets of value in SASB securitizations, including some senior mezzanine tranches, but collateral considerations are paramount as the sector is not homogeneous. While senior CMBS spreads are vulnerable to broad-based market de-risking, CMBS fundamentals remain solid. Commercial real estate values are now 13% past their 2007 peak, but both cap rates and prices appear sustainable at current levels. For new issue CMBS, we see some softening of loan underwriting standards (more interest only loans, secondary property markets, etc), but debt-service coverage ratios on newly originated loans remain higher than they were pre-crisis and the use of pro forma underwriting is still limited. We therefore do not expect to see broad-based credit problems in newly issued CMBS, particularly in super-senior bonds. With respect to legacy CMBS fundamentals, delinquencies in ’06/’07 CMBS pools remain high, but continue to decline, albeit at a slower pace. We believe losses on pre-crisis legacy deals will be limited to subordinate classes, such as class AJ and below. The conduit new issue CMBS market issued $60 billion in 2014, and we maintain our projection for 2015 at $65 billion, which is now about 15% lower than most projections in the beginning of the year. Fannie Mae and Freddie Mac originated $50 billion backed by multi-family properties in 2014 and are on pace to issue $60 billion in 2015. The market continues to absorb new issue supply, which was about $17 billion in Q3, but new issue concessions have increased to 35 bps. While net issuance in the CMBS sector is close to zero with maturities of legacy bonds offsetting new issuance, the net duration add represents a formidable technical headwind that the market will have to contend with as it refinances the wall of maturities from 2016 to 2017. ABS – ABS spreads were wider in the third quarter alongside broad market softness, interest rate uncertainty, and diminished dealer liquidity. Front-end benchmark ABS again underperformed in sympathy with corporates as 2(a)7 money market reform and bank regulation pressured the front-end of the maturity spread curve. Spreads on benchmark credit cards and auto ABS were 5-10 bps wider (e.g. 3-year AAA cards are L+40 and 1-year AAA top-tier prime autos are L+35). Notably, the student loan FFELP ABS market came under pressure this past quarter as Moody’s and Fitch placed a large number of bonds on downgrade watch due to concerns that collateral prepayment speeds have slowed to the point that bonds may not be repaid by their legal final maturities. Prepayment speeds have slowed due to government sponsored programs to alleviate student loan debt payments. Despite slow prepayment speeds, the Sources of data on this page: Mortgages, Barclays. Page 14 Q4 2015 Sector Outlook underlying loans are still 97% guaranteed by the U.S. and, with securitization credit enhancement, extremely unlikely to suffer any loss of principal. Spreads on these bonds have widened 50-100 bps based on tenor. That said, we do not believe this is a good entry point for FFELP or Private Student Loans. Spreads could widen further in response to forced selling due to prospective downgrades and a repricing of risk premia in response to the slower- than-expected prepayment speeds. Away from student loans, non-benchmark ABS spreads were wider by 10 bps on average (e.g. 5-year senior rental car ABS to L+ 100 and senior 3-year sub-prime consumer loan ABS to L+170). New issue ABS supply was $145 billion as of the end of Q3, slightly ahead of last year’s pace. We are neutral on benchmark sectors, such as credit cards and autos, with relatively low carry and limited longterm upside, and we are looking to add select, fundamentally strong, non-benchmark sectors and issuers with more favorable economics. Non-Agency Residential Mortgages – Government Sponsored Enterprise (GSE) credit risk transfer deals had a difficult quarter, in line with other risk assets. For example, Fannie Mae’s CAS M1s widened 35 bps and the longer M2 bonds 100 bps; this despite exemplary credit performance in all deals issued thus far. Senior pre-crisis legacy bond prices outperformed CRTs but still softened by ½-1 points in Q3. Technical factors remain positive as annual paydowns are approximately 15% of outstanding issues and new issue supply is minimal. Fundamentals also continue to improve – the percent of loans making payments has been steadily increasing for over four years, HPA continues to increase (expected to be 4% to 5% in 2015 and 2-4% in 2016), and job growth remains solid. We continue to find value in the senior tranche of re-remics of senior ’06/’07 bonds. The added enhancement provided by the junior re-remic tranche significantly improves the credit profile, yet senior re-REMIC tranches trade very attractively in the LIBOR + 230-330 bps range. We also find value in the senior tranche of nonperforming loan securitizations – these trade at about 4% yield for front-end cashflows and have about 50% enhancement to underlying property value. We continue to favor ’05 and prior sub-prime bonds with significant enhancement, which trade in the L+175-225 bps range. It remains our view that many non-agency mortgage investors do not hedge duration and could be hurt if interest rates selloff further. Outside the U.S., UK non-conforming mortgages have widened significantly as the re-positioning from legacy holders accelerates. Spreads on 5 year AAA paper have widened about 100 bps this year, with about 75 bps coming this quarter to L+175. While we find this level attractive, we are closely watching large asset divestitures – notably the UK government resolution of their Northern Rock holdings – and the effect on spreads. CLOs: AAA-rated U.S. collateralized loan obligation (CLO) primary market spreads widened by 10 bps to 3L+150 bps. This brings year-to-date spreads close to unchanged. Spreads widened due to market volatility and headwinds from regulatory developments. That said, spread widening was contained, in large part, due to continued strong demand from banks, asset managers, and insurance companies. Secondary short weighted average life CLOs were wider by 30 bps at L+140 bps. These bonds moved wider because of slower pre-pay speeds and regulatory driven balance sheet concerns for banks—for example, many pre-crisis bonds are not Volcker compliant. In Europe, spreads on AAA-rated CLO primary deals were 5 bps wider at 3L+135 bps. Unlike the U.S., European supply remains constrained given the implementation challenges of risk retention and the limited CLO investor base. We continue to believe CLOs offer solid relative value in both the primary and secondary markets. In the primary U.S. market, investors in AAA tranches continue to enjoy a favorable environment to negotiate spreads and covenants. In the long run, we strongly believe CLO spreads will compress; in the short and medium term, spreads will remain a function of supply and regulation, which will provide a positive environment to continue to opportunistically add to positions in a fundamentally attractive asset class. OUTLOOK: We remain very positive on top-of-the-capital structure bonds and we see the current market dislocation as an opportune time to increase allocations. We are selectively positive on senior mezzanine cashflows, and of note, we are negative on lower-rated new issue CMBS as loan underwriting quality has softened. Sources of data on this page: Structured product, Barclays; CLOs, Prudential Fixed Income. Page 15 Q4 2015 Sector Outlook Notice These materials represent the views, opinions and recommendations of the author(s) regarding the economic conditions, asset classes, securities, issuers or financial instruments referenced herein. Certain information contained herein has been obtained from sources that the Firm believes to be reliable as of the date presented; however, the Firm cannot guarantee the accuracy of such information, assure its completeness, or warrant such information will not be changed. The information contained herein is current as of the date of issuance (or such earlier date as referenced herein). The underlying assumptions and our views are subject to change without notice. The Firm has no obligation to update any or all of such information; nor do we make any express or implied warranties or representations as to the completeness or accuracy or accept responsibility for errors. Distribution of this information to any person other than the person to whom it was originally delivered and to such person’s advisers is unauthorized, and any reproduction of these materials, in whole or in part, or the divulgence of any of the contents hereof, without prior consent of Prudential Fixed Income (the “Firm”) is prohibited. These materials are not intended as an offer or solicitation with respect to the purchase or sale of any security or other financial instrument or any investment management services and should not be used as the basis for any investment decision. No investment strategy or risk management technique can guarantee returns or eliminate risk in any market environment. Past performance is not a guarantee or a reliable indicator of future results and an investment could lose value. No liability whatsoever is accepted for any loss (whether direct, indirect, or consequential) that may arise from any use of the information contained in or derived from this report. The Firm and its affiliates may make investment decisions that are inconsistent with the recommendations or views expressed herein, including for proprietary accounts of the Firm or its affiliates. The opinions and recommendations herein do not take into account individual client circumstances, objectives, or needs and are not intended as recommendations of particular securities, financial instruments or strategies to particular clients or prospects. No determination has been made regarding the suitability of any securities, financial instruments or strategies for particular clients or prospects. For any securities or financial instruments mentioned herein, the recipient(s) of this report must make its own independent decisions. Any projections or forecasts presented herein are as of the date of this presentation and are subject to change without notice. Actual data will vary and may not be reflected here. Projections and forecasts are subject to high levels of uncertainty. Accordingly, any projections or forecasts should be viewed as merely representative of a broad range of possible outcomes. Projections or forecasts are estimated, based on assumptions, and are subject to significant revision and may change materially as economic and market conditions change. The Firm has no obligation to provide updates or changes to any projections or forecasts. Conflicts of Interest: The Firm and its affiliates may have investment advisory or other business relationships with the issuers of securities referenced herein. The Firm and its affiliates, officers, directors and employees may from time to time have long or short positions in and buy or sell securities or financial instruments referenced herein. The Firm’s affiliates may develop and publish research that is independent of, and different than, the recommendations contained herein. The Firm’s personnel other than the author(s), such as sales, marketing and trading personnel, may provide oral or written market commentary or ideas to the Firm’s clients or prospects or proprietary investment ideas that differ from the views expressed herein. Additional information regarding actual and potential conflicts of interest is available in Part 2A of the Firm’s Form ADV. The Firm operates primarily through Prudential Investment Management, Inc., a registered investment adviser and a Prudential Financial, Inc. (“Pramerica Financial”) company. In Europe and certain Asian countries, Prudential Investment Management and Prudential Fixed Income operate as Pramerica Investment Management and Pramerica Fixed Income, respectively. Pramerica Financial is not affiliated in any manner with Prudential plc, a company incorporated in the United Kingdom. In Germany, information is presented by Pramerica Real Estate International AG. In the United Kingdom, information is presented by Pramerica Investment Management Limited (“PIML”), an indirect subsidiary of Pramerica Investment Management. PIML is authorised and regulated by the Financial Conduct Authority of the United Kingdom (registration number 193418) and duly passported in various jurisdictions in the European Economic Area. In certain countries in Asia, information is presented by Pramerica Fixed Income (Asia) Limited, a Singapore investment manager that is registered with and licensed by the Monetary Authority of Singapore. In Japan, information is presented by Prudential Investment Management Japan Co. Ltd., a Japanese licensed investment adviser. Pramerica, the Pramerica logo, and the Rock symbol are service marks of Pramerica Financial, and its related entities, registered in many jurisdictions worldwide. © 2015 Prudential Financial, Inc. and its related entities. Performance for each sector is based upon the following indices: U.S. Investment Grade Corporate Bonds: Barclays U.S. Corporate Bond Index European Investment Grade Corporate Bonds: iBoxx Euro Corporate Index 100% (unhedged) U.S. High Yield Bonds: BofA Merrill Lynch U.S. High Yield Index European High Yield Bonds: Merrill Lynch European Currency High Yield ex Finance 2% Constrained Index U.S. Senior Secured Loans: Credit Suisse Leveraged Loan Index European Senior Secured Loans: Credit Suisse Western European Leveraged Loan Index: All Denominations Unhedged Emerging Markets USD Sovereign Debt: JP Morgan Emerging Markets Bond Index Global Diversified Emerging Markets Local Debt (unhedged): JPMorgan Government Bond Index-Emerging Markets Global Diversified Index Emerging Markets Corporate Bonds: JP Morgan Corporate Emerging Markets Bond Index Broad Diversified Emerging Markets Currencies: JP Morgan Emerging Local Markets Index Plus Municipal Bonds: Barclays Municipal Bond Indices U.S. Treasury Bonds: Barclays U.S. U.S. Treasury Bond Index Mortgage Backed Securities: Barclays U.S. MBS - Agency Fixed Rate Index Commercial Mortgage-Backed Securities: Barclays CMBS: ERISA Eligible Index U.S. Aggregate Bond Index: Barclays U.S. Aggregate Bond Index 2015-2579 Page 16
© Copyright 2026 Paperzz