Base oil market size to reach $40.47 billion by 2024 “The global base oil market is expected to reach USD 40.47 billion by 2024. Increasing utilization of lubricants in end-use industries such as industrial and automotive is expected to remain a key driving factor over the forecast period” The global base oil market is expected to reach USD 40.47 billion by 2024, according to a new report by Grand View Research, Inc. Growing demand for industrial lubricants, greases, hydraulic fluids, and metal working fluids made from raw stock fluids such as base oil is anticipated to remain a key driving factor for the market growth. The shifting trend towards adoption of Group II and Group III base oil owing to the shutdown of Group I oil production facilities in Europe, and Asia Pacific is anticipated to fuel industry growth significantly. Detailed Research Report available at: http://www.grandviewresearch.com/industry-analysis/base-oil-market Follow Us: Rapid expansion in the automotive sector in emerging Asian countries such as China, India, Indonesia, and Thailand is expected to boost demand at a rapid pace. The increasing demand for automotive fluids is owing to excellent properties such as improved oxidative stability, increased viscosity index, high level of saturation and low sulfur content. Group II base oil accounted for over 20% of overall volume in 2015. They are manufactured by the hydro-cracking process, and it has high saturated and low sulfur than compared to Group I products. Further key findings from the report suggest: The global base oil market demand was over 37.64 million tons in 2015, and is anticipated to exceed 45 million tons by 2024, growing at an estimated CAGR of 2.4% from 2016 to 2024 Automotive oils were the largest application segment and accounted for over 40% of total market volume in 2015. The growth of lubricants industry on account of increasing automotive production in Asia Pacific is expected to drive this segment over the forecast period. Increasing demand for metalworking processes such as cutting, welding and forming across various applications such as automotive, foundry, ships, aircrafts, milling and industrial machinery is expected to drive metal working fluids demand Asia Pacific was the largest market, accounting for over one-third of the total market volume in 2015.The positive outlook towards automotive and industrial manufacturing sectors of emerging economies such as China, Vietnam, India and South Korea is anticipated to promote the usage of industrial and automotive lubricants Follow Us: BP and Russian Rosneft have announced to sign an agreement to create a new joint venture company, Yermak Neftegaz LLC, to conduct exploration activities in the Yenisey-Khatanga and West Siberian basins The market is highly fragmented among multinational players and small domestic players. Major companies identified in the market include ExxonMobil, Chevron Corp., British Petroleum PLC, Royal Dutch Shell, Sepahan Oil Company, LukOil, Saudi Aramco, S-Oil Corp., Indian Oil Corp. Ltd., Total, Motul, Repsol, Gulf Oil UAE, Petrobras and Tupras Read our blog on bulk chemicals industry: http://www.grandviewresearch.com/blogs/bulk-chemicals Table of content of global base oil market research report: Chapter 1 Methodology and Scope 1.1 Research Methodology 1.2 Research scope and assumptions 1.3 List of data sources Chapter 2 Executive Summary Chapter 3 Market Variables, Trends & Scope 3.1 Market segmentation 3.2 Market size and growth prospects 3.3 Base oilvalue chain analysis Follow Us: 3.4 Regulatory Framework 3.4.1 Europe 3.4.2 Asia Pacific 3.4.3 Other Regions 3.5 Technology Overview 3.5.1 Conventional refining 3.5.2 Advanced refining 3.5.3 Hybrid type refining 3.5.4 More advanced synthetic technologies 3.6 Global base oil production landscape 3.7 Base Oil Trade Analysis 3.7.1 Import & export landscape 3.7.2 Key Importers 3.7.3 Key Exporters 3.8 Base oil sales policies 3.9 Base oil storage capacity 3.10 Price trend, 2014 to 2024 Follow Us: 3.10.1 Crude Oil 3.10.2 Base Oil 3.11 Base oil market dynamics 3.11.1 Market driver analysis 3.11.1.1 Growing adoption of group II and III base oils 3.11.1.2 Positive outlook for group IV and naphthenic 3.11.2 Market restraint analysis 3.11.2.1 Increasing competition for feedstock 3.12 Key Opportunities Prioritized 3.12.1 Market opportunities 3.12.1.1 Bio based oils from vegetable sources 3.12.1.2 Gas-to-Liquids (GTL) technology 3.13 Industry analysis - Porter’s 3.13.1 Global base oil company heat map analysis, 2015 3.13.1.1 Market strategy overview 3.14 Base oil PESTEL analysis Chapter 4 Market Categorization 1: Product Estimates & Trend Analysis Follow Us: 4.1 Product Movement Analysis & Market Share, 2015 & 2024 4.2 Group I 4.2.1 Global group I base oil market estimates and forecasts, 2014 2024 (Kilo Tons) (USD Million) 4.2.2 Global group I base oil market estimates and forecasts, by region, 2014 - 2024 (Kilo Tons) (USD Million) 4.3 Group II 4.3.1 Global group II base oil market estimates and forecasts, 2014 2024 (Kilo Tons) (USD Million) 4.3.2 Global group II base oil market estimates and forecasts, by region, 2014 - 2024 (Kilo Tons) (USD Million) 4.4 Group III 4.4.1 Global group III base oil market estimates and forecasts, 2014 2024 (Kilo Tons) (USD Million) 4.4.2 Global group III base oil market estimates and forecasts, by region, 2014 - 2024 (Kilo Tons) (USD Million) 4.5 Other base oils 4.5.1 Global other base oils market estimates and forecasts, 2014 2024 (Kilo Tons) (USD Million) Follow Us: 4.5.2 Global other base oils market estimates and forecasts, by region, 2014 - 2024 (Kilo Tons) (USD Million) Chapter 5 Market Categorization 2: Application Estimates & Trend Analysis 5.1 Application Movement Analysis & Market Share, 2015 & 2024 5.2 Automotive Oils 5.2.1 Global base oil market estimates and forecasts for automotive oils, 2014 - 2024 (Kilo Tons) (USD Million) 5.2.2 Global base oil market estimates and forecasts for automotive oils, by region, 2014 - 2024 (Kilo Tons) (USD Million) 5.3 Process Oils 5.3.1 Global base oil market estimates and forecasts for process oils, 2014 - 2024 (Kilo Tons) (USD Million) 5.3.2 Global base oil market estimates and forecasts for process oils, by region, 2014 - 2024 (Kilo Tons) (USD Million) 5.4 Hydraulic oils 5.4.1 Global base oil market estimates and forecasts for hydraulic oils, 2014 - 2024 (Kilo Tons) (USD Million) 5.4.2 Global base oil market estimates and forecasts for hydraulic oils, by region, 2014 - 2024 (Kilo Tons) (USD Million) 5.5 Metalworking Fluids Follow Us: 5.5.1 Global base oil market estimates and forecasts for metalworking fluids, 2014 - 2024 (Kilo Tons) (USD Million) 5.5.2 Global base oil market estimates and forecasts for metalworking fluids, by region, 2014 - 2024 (Kilo Tons) (USD Million) 5.6 Industrial Oils 5.6.1 Global base oil market estimates and forecasts for industrial oils, 2014 - 2024 (Kilo Tons) (USD Million) 5.6.2 Global base oil market estimates and forecasts for industrial oils, by region, 2014 - 2024 (Kilo Tons) (USD Million) 5.7 Others 5.7.1 Global base oil market estimates and forecasts for other applications, 2014 - 2024 (Kilo Tons) (USD Million) 5.7.2 Global base oil market estimates and forecasts for other applications, by region, 2014 - 2024 (Kilo Tons) (USD Million) Chapter 6 Market Categorization 3: Regional Estimates & Trend Analysis, by Product & Application 6.1 Regional Movement Analysis & Market Share, 2015 & 2024 6.2 North America 6.2.1 North America base oil market estimates and forecast, 2014 2024 (Kilo Tons) (USD Million) Follow Us: 6.2.2 North America base oil market estimates and forecast, by product, 2014 - 2024 (Kilo Tons) (USD Million) 6.2.3 North America base oil market estimates and forecast, by application, 2014 - 2024 (Kilo Tons) (USD Million) 6.2.4 U.S. 6.2.4.1 U.S. base oil estimates and forecast, 2014 - 2024 (Kilo Tons) (USD Million) 6.2.4.2 U.S. base oil estimates and forecast, by product, 2014 2024 (Kilo Tons) (USD Million) 6.2.4.3 U.S. base oil market estimates and forecast by application, 2014 - 2024 (Kilo Tons) (USD Million) 6.3 Europe 6.3.1 Europe base oil market estimates and forecast, 2014 - 2024 (Kilo Tons) (USD Million) 6.3.2 Europe base oil market estimates and forecast, by product, 2014 2024 (Kilo Tons) (USD Million) 6.3.3 Europe base oil market estimates and forecast, by application, 2014 - 2024 (Kilo Tons) (USD Million) 6.3.4 Germany Follow Us: 6.3.4.1 Germany base oil estimates and forecast, 2014 - 2024 (Kilo Tons) (USD Million) 6.3.4.2 Germany base oil estimates and forecast, by product, 2014 - 2024 (Kilo Tons) (USD Million) 6.3.4.3 Germany base oil market estimates and forecast by application, 2014 - 2024 (Kilo Tons) (USD Million) 6.3.5 France 6.3.5.1 France base oil estimates and forecast, 2014 - 2024 (Kilo Tons) (USD Million) 6.3.5.2 France base oil estimates and forecast, by product, 2014 2024 (Kilo Tons) (USD Million) 6.3.5.3 France base oil market estimates and forecast by application, 2014 - 2024 (Kilo Tons) (USD Million) 6.3.6 UK 6.3.6.1 UK base oil estimates and forecast, 2014 - 2024 (Kilo Tons) (USD Million) 6.3.6.2 UK base oil estimates and forecast, by product, 2014 2024 (Kilo Tons) (USD Million) 6.3.6.3 UK base oil market estimates and forecast by application, 2014 - 2024 (Kilo Tons) (USD Million) Follow Us: 6.3.7 Italy 6.3.7.1 Italy base oil estimates and forecast, 2014 - 2024 (Kilo Tons) (USD Million) 6.3.7.2 Italy base oil estimates and forecast, by product, 2014 2024 (Kilo Tons) (USD Million) 6.3.7.3 Italy base oil market estimates and forecast by application, 2014 - 2024 (Kilo Tons) (USD Million) 6.3.8 Russia 6.3.8.1 Russia base oil estimates and forecast, 2014 - 2024 (Kilo Tons) (USD Million) 6.3.8.2 Russia base oil estimates and forecast, by product, 2014 2024 (Kilo Tons) (USD Million) 6.3.8.3 Russia base oil market estimates and forecast by application, 2014 - 2024 (Kilo Tons) (USD Million) 6.3.9 Turkey 6.3.9.1 Turkey base oil estimates and forecast, 2014 - 2024 (Kilo Tons) (USD Million) 6.3.9.2 Turkey base oil estimates and forecast, by product, 2014 2024 (Kilo Tons) (USD Million) Follow Us: 6.3.9.3 Turkey base oil market estimates and forecast by application, 2014 - 2024 (Kilo Tons) (USD Million) 6.3.10 Rest of Europe (RoE) 6.3.10.1 RoE base oil estimates and forecast, 2014 - 2024 (Kilo Tons) (USD Million) 6.3.10.2 RoE base oil estimates and forecast, by product, 2014 2024 (Kilo Tons) (USD Million) 6.3.10.3 RoE base oil market estimates and forecast by application, 2014 - 2024 (Kilo Tons) (USD Million) 6.4 Asia Pacific 6.4.1 Asia Pacific base oil market estimates and forecast, 2014 - 2024 (Kilo Tons) (USD Million) 6.4.2 Asia Pacific base oil market estimates and forecast, by product, 2014 - 2024 (Kilo Tons) (USD Million) 6.4.3 Asia Pacific base oil market estimates and forecast, by application, 2014 - 2024 (Kilo Tons) (USD Million) 6.4.4 China 6.4.4.1 China base oil estimates and forecast, 2014 - 2024 (Kilo Tons) (USD Million) Follow Us: 6.4.4.2 China base oil estimates and forecast, by product, 2014 2024 (Kilo Tons) (USD Million) 6.4.4.3 China base oil market estimates and forecast by application, 2014 - 2024 (Kilo Tons) (USD Million) 6.4.5 India 6.4.5.1 India base oil estimates and forecast, 2014 - 2024 (Kilo Tons) (USD Million) 6.4.5.2 India base oil estimates and forecast, by product, 2014 2024 (Kilo Tons) (USD Million) 6.4.5.3 India base oil market estimates and forecast by application, 2014 - 2024 (Kilo Tons) (USD Million) 6.4.6 Japan 6.4.6.1 Japan base oil estimates and forecast, 2014 - 2024 (Kilo Tons) (USD Million) 6.4.6.2 Japan base oil estimates and forecast, by product, 2014 2024 (Kilo Tons) (USD Million) 6.4.6.3 Japan base oil market estimates and forecast by application, 2014 - 2024 (Kilo Tons) (USD Million) 6.4.7 Southeast Asia Follow Us: 6.4.7.1 Southeast Asia base oil estimates and forecast, 2014 2024 (Kilo Tons) (USD Million) 6.4.7.2 Southeast Asia base oil estimates and forecast, by product, 2014 - 2024 (Kilo Tons) (USD Million) 6.4.7.3 Southeast Asia base oil market estimates and forecast by application, 2014 - 2024 (Kilo Tons) (USD Million) 6.4.8 Rest of Asia Pacific (RoAPAC) 6.4.8.1 RoAPAC base oil estimates and forecast, 2014 - 2024 (Kilo Tons) (USD Million) 6.4.8.2 RoAPAC base oil estimates and forecast, by product, 2014 - 2024 (Kilo Tons) (USD Million) 6.4.8.3 RoAPAC base oil market estimates and forecast by application, 2014 - 2024 (Kilo Tons) (USD Million) 6.5 Middle East & Africa (MEA) 6.5.1 MEA base oil market estimates and forecast, 2014 - 2024 (Kilo Tons) (USD Million) 6.5.2 MEA base oil market estimates and forecast, by product, 2014 2024 (Kilo Tons) (USD Million) 6.5.3 MEA base oil market estimates and forecast, by application, 2014 - 2024 (Kilo Tons) (USD Million) Follow Us: 6.5.4 Saudi Arabia 6.5.4.1 Saudi Arabia base oil estimates and forecast, 2014 - 2024 (Kilo Tons) (USD Million) 6.5.4.2 Saudi Arabia base oil estimates and forecast, by product, 2014 - 2024 (Kilo Tons) (USD Million) 6.5.4.3 Saudi Arabia base oil market estimates and forecast by application, 2014 - 2024 (Kilo Tons) (USD Million) 6.5.5 United Arab Emirates (UAE) 6.5.5.1 UAE base oil estimates and forecast, 2014 - 2024 (Kilo Tons) (USD Million) 6.5.5.2 UAE base oil estimates and forecast, by product, 2014 2024 (Kilo Tons) (USD Million) 6.5.5.3 UAE base oil market estimates and forecast by application, 2014 - 2024 (Kilo Tons) (USD Million) 6.5.6 Jordan 6.5.6.1 Jordan base oil estimates and forecast, 2014 - 2024 (Kilo Tons) (USD Million) 6.5.6.2 Jordan base oil estimates and forecast, by product, 2014 2024 (Kilo Tons) (USD Million) Follow Us: 6.5.6.3 Jordan base oil market estimates and forecast by application, 2014 - 2024 (Kilo Tons) (USD Million) 6.5.7 South Africa 6.5.7.1 South Africa base oil estimates and forecast, 2014 - 2024 (Kilo Tons) (USD Million) 6.5.7.2 South Africa base oil estimates and forecast, by product, 2014 - 2024 (Kilo Tons) (USD Million) 6.5.7.3 South Africa base oil market estimates and forecast by application, 2014 - 2024 (Kilo Tons) (USD Million) 6.5.8 Egypt 6.5.8.1 Egypt base oil estimates and forecast, 2014 - 2024 (Kilo Tons) (USD Million) 6.5.8.2 Egypt base oil estimates and forecast, by product, 2014 2024 (Kilo Tons) (USD Million) 6.5.8.3 Egypt base oil market estimates and forecast by application, 2014 - 2024 (Kilo Tons) (USD Million) 6.5.9 Nigeria 6.5.9.1 Nigeria base oil estimates and forecast, 2014 - 2024 (Kilo Tons) (USD Million) Follow Us: 6.5.9.2 Nigeria base oil estimates and forecast, by product, 2014 2024 (Kilo Tons) (USD Million) 6.5.9.3 Nigeria base oil market estimates and forecast by application, 2014 - 2024 (Kilo Tons) (USD Million) 6.5.10 Kenya 6.5.10.1 Kenya base oil estimates and forecast, 2014 - 2024 (Kilo Tons) (USD Million) 6.5.10.2 Kenya base oil estimates and forecast, by product, 2014 2024 (Kilo Tons) (USD Million) 6.5.10.3 Kenya base oil market estimates and forecast by application, 2014 - 2024 (Kilo Tons) (USD Million) 6.5.11 Rest of Middle East & Africa (RoMEA) 6.5.11.1 RoMEA base oil estimates and forecast, 2014 - 2024 (Kilo Tons) (USD Million) 6.5.11.2 RoMEA base oil estimates and forecast, by product, 2014 - 2024 (Kilo Tons) (USD Million) 6.5.11.3 RoMEA base oil market estimates and forecast by application, 2014 - 2024 (Kilo Tons) (USD Million) 6.6 Central & South America (CSA) Follow Us: 6.6.1 CSA base oil market estimates and forecast, 2014 - 2024 (Kilo Tons) (USD Million) 6.6.2 CSA base oil market estimates and forecast, by product, 2014 2024 (Kilo Tons) (USD Million) 6.6.3 CSA base oil market estimates and forecast, by application, 2014 - 2024 (Kilo Tons) (USD Million) 6.6.4 Brazil 6.6.4.1 Brazil base oil estimates and forecast, 2014 - 2024 (Kilo Tons) (USD Million) 6.6.4.2 Brazil base oil estimates and forecast, by product, 2014 2024 (Kilo Tons) (USD Million) 6.6.4.3 Brazil base oil market estimates and forecast by application, 2014 - 2024 (Kilo Tons) (USD Million) 6.6.5 Argentina 6.6.5.1 Argentina base oil estimates and forecast, 2014 - 2024 (Kilo Tons) (USD Million) 6.6.5.2 Argentina base oil estimates and forecast, by product, 2014 - 2024 (Kilo Tons) (USD Million) 6.6.5.3 Argentina base oil market estimates and forecast by application, 2014 - 2024 (Kilo Tons) (USD Million) Follow Us: 6.6.6 Venezuela 6.6.6.1 Venezuela base oil estimates and forecast, 2014 - 2024 (Kilo Tons) (USD Million) 6.6.6.2 Venezuela base oil estimates and forecast, by product, 2014 - 2024 (Kilo Tons) (USD Million) 6.6.6.3 Venezuela base oil market estimates and forecast by application, 2014 - 2024 (Kilo Tons) (USD Million) 6.6.7 Rest of Central & South America (RoCSA) 6.6.7.1 RoCSA base oil estimates and forecast, 2014 - 2024 (Kilo Tons) (USD Million) 6.6.7.2 RoCSA base oil estimates and forecast, by product, 2014 2024 (Kilo Tons) (USD Million) 6.6.7.3 RoCSA base oil market estimates and forecast by application, 2014 - 2024 (Kilo Tons) (USD Million) Chapter 7 Competitive Landscape 7.1 ExxonMobil 7.1.1 Company Overview 7.1.2 Financial Performance 7.1.3 Industries and Services Catered Follow Us: 7.1.4 Product Benchmarking 7.1.5 Strategic Initiatives 7.2 Chevron Corp 7.2.1 Company Overview 7.2.2 Financial Performance 7.2.3 Industries and Services Catered 7.2.4 Product Benchmarking 7.2.5 Strategic Initiatives 7.3 Royal Dutch shell 7.3.1 Company Overview 7.3.2 Financial Performance 7.3.3 Industries and Services Catered 7.3.4 Product Benchmarking 7.3.5 Strategic Initiative 7.4 British Petroleum Plc 7.4.1 Company Overview 7.4.2 Financial Performance Follow Us: 7.4.3 Industries and Services Catered 7.4.4 Product Benchmarking 7.4.5 Strategic Initiative 7.5 Saudi Aramco 7.5.1 Company Overview 7.5.2 Financial Performance 7.5.3 Industries and Services Catered 7.5.4 Product Benchmarking 7.5.5 Strategic Initiatives 7.6 Sepahan Oil Company 7.6.1 Company Overview 7.6.2 Financial Performance 7.6.3 Industries and Services Catered 7.6.4 Product Benchmarking 7.6.5 Strategic Initiatives 7.7 Bahrain Lube Base Oil Co. 7.7.1 Company Overview Follow Us: 7.7.2 Financial Performance 7.7.3 Industries and Services Catered 7.7.4 Product Benchmarking 7.8 LukOil 7.8.1 Company Overview 7.8.2 Financial Performance 7.8.3 Industries and Service Catered 7.8.4 Product Benchmarking 7.8.5 Strategic Initiatives 7.9 Indian Oil Corporation 7.9.1 Company Overview 7.9.2 Financial Performance 7.9.3 Industries and Services Catered 7.9.4 Product Benchmarking 7.10 S-Oil Corp. 7.10.1 Company Overview 7.10.2 Financial Performance Follow Us: 7.10.3 Industries and Services Catered 7.10.4 Product Benchmarking 7.11 SK Lubricants 7.11.1 Company Overview 7.11.2 Financial Performance 7.11.3 Industries and Services Catered 7.11.4 Product Benchmarking 7.11.5 Strategic Initiative 7.12 H&R OWS GmbH 7.12.1 Company Overview 7.12.2 Financial Performance 7.12.3 Industries and Services Catered 7.12.4 Product Benchmarking 7.13 Bharat Petroleum Corp. Ltd. 7.13.1 Company Overview 7.13.2 Financial Performance 7.13.3 Industries and Services Catered Follow Us: 7.13.4 Product Benchmarking 7.14 GS Caltex Corp. 7.14.1 Company Overview 7.14.2 Financial Performance 7.14.3 Industries and Services Catered 7.14.4 Product Benchmarking 7.15 Hindustan Petroleum Corporation Ltd. 7.15.1 Company Overview 7.15.2 Financial Performance 7.15.3 Industries and Services Catered 7.15.4 Product Benchmarking 7.16 Total S.A. 7.16.1 Company Overview 7.16.2 Financial Performance 7.16.3 Industries and Services Catered 7.16.4 Product Benchmarking 7.16.5 Strategic Initiatives Follow Us: 7.17 Motul 7.17.1 Company Overview 7.17.2 Financial Performance 7.17.3 Industries and Services Catered 7.17.4 Product Benchmarking 7.17.5 Strategic Initiative 7.18 Jordan Petroleum Refinery Co. 7.18.1 Company Overview 7.18.2 Financial Performance 7.18.3 Industries and Services Catered 7.18.4 Product Benchmarking 7.18.5 Strategic initiative 7.19 Shamrock Oils 7.19.1 Company Overview 7.19.2 Financial Performance 7.19.3 Industries and Services Catered 7.19.4 Product Benchmarking Follow Us: 7.20 Tupras 7.20.1 Company Overview 7.20.2 Financial Performance 7.20.3 Industries and Services Catered 7.20.4 Product Benchmarking 7.21 Amyris 7.21.1 Company Overview 7.21.2 Financial Performance 7.21.3 Industries and Services Catered 7.21.4 Product Benchmarking 7.21.5 Strategic Initiatives 7.22 Cosan Industries 7.22.1 Company Overview 7.22.2 Financial Performance 7.22.3 Industries and Services Catered 7.22.4 Product Benchmarking 7.23 Petrobras Follow Us: 7.23.1 Company Overview 7.23.2 Financial Performance 7.23.3 Industries and Services Catered 7.23.4 Product Benchmarking 7.23.5 Strategic Initiatives 7.24 Fuchs Lubricants South Africa 7.24.1 Company Overview 7.24.2 Financial Performance 7.24.3 Industries and Services Catered 7.24.4 Product Benchmarking 7.25 Gulf Oil UAE 7.25.1 Company Overview 7.25.2 Financial Performance 7.25.3 Industries and Services Catered 7.25.4 Product Benchmarking 7.26 Repsol 7.26.1 Company Overview Follow Us: 7.26.2 Financial Performance 7.26.3 Industries and Services Catered 7.26.4 Product Benchmarking 7.26.5 Strategic Initiatives About Grand View Research, Inc.: Grand View Research, Inc. is a U.S. based market research and consulting company, registered in the State of California and headquartered in San Francisco. The company provides syndicated research reports, customized research reports, and consulting services. To help clients make informed business decisions, the company offers market intelligence studies ensuring relevant and fact-based research across a range of industries including technology, chemicals, materials, healthcare and energy. Contact: Sherry James Corporate Sales Specialist, USA Grand View Research, Inc Phone: 1-415- 349-0058 Toll Free: 1-888- 202-9519 Email: [email protected] Web – http://www.grandviewresearch.com/ Follow Us:
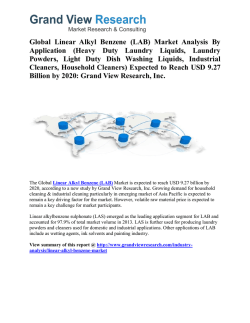
The global base oil market is expected to reach USD 40.47 billion by 2024, according to a new report by Grand View Research, Inc. Growing demand for industrial lubricants, greases, hydraulic fluids, and metal working fluids made from raw stock fluids such as base oil is anticipated to remain a key driving factor for the market growth. Click here - http://www.grandviewresearch.com/industry-analysis/base-oil-market
© Copyright 2026 Paperzz