October
1989
Y. Kitamura
Small-scale
Disturbances
by
Daily
By Yasuo
and I.
in the
Rawin
Lower
Sonde
Kitamura
Hirota
and
817
Stratosphere
Revealed
Observations
Isamu
Hirota
Department of Geophysics, Faculty of Science, Kyoto University, Kyoto 606, Japan
(Manuscript received27 March 1989, in revisedform 22 July 1989)
Abstract
Small-scale disturbances in the lower stratosphere are investigated with the aid of operational rawinsonde observations over Japan. The disturbances appear not only in wind but also in temperature
fields.
The disturbances show a clear seasonal variation: the intensity is large in winter and spring, in a
similar manner to that of the mean zonal wind. They also have latitudinal and altitudinal dependency
with the peak of intensity at 15km to 20km height around 40*N.
The dominant vertical scale of the disturbances is 2 to 5km and they extend north and south with a
scale of a few hundred kilometers. By applying a vertical band-pass filter, it is found that they show a
wave-like form with a characteristic phase relation such that the lag of T' to u' and lag of u' to *' are
both in between -180* and -90*. Supposing that they are inertia-gravity waves, the phase relation
suggests that the wavenumber vector points to the direction of the north-west and downward and
hence the waves transport the energy north-westward and upward relative to the background wind.
This inclination of the propagation direction can be interpreted as a consequence of the selectivity
due to the critical layers as well as the wave generation.
From all of these results, we deduce that the generation and the characteristic structure of the
disturbances are closely related to the subtropical jet at the tropopause level.
1. Introduction
2. Data Description
In recent years, internal gravity waves have attracted a special interest due to their important role
such as in momentum transport and the interaction
with the mean flow (Lindzen 1981).
To date, gravity waves in the middle atmosphere
have been observed by various methods. However,
most of them are case studies with limited data except the statistical studies of Hirota (1984) and Hirota and Niki (1985) for the stratosphere and lower
mesosphere. General aspects of gravity waves are
not yet known in the troposphere and lower stratosphere, where many of them are thought to be generated.
In this paper we show the temporal and spatial
distribution and the structure of small-scale disturbances with the aid of rawin-sonde observations over
Japan. The advantage of this study is that we can
see the latitudinal variation of the disturbances in
relation to the location of the subtropical jet which
varies with season. An attempt is also made to find
a source of them on the basis of the simple theoretical consideration of the inertia-gravity wave.
The daily operational rawinsonde observation
from the surface up to about 25km height is made
at meteorologicalobservatories in Japan at 0 and 12
Greenwich Mean Time (9 and 21 Local Time). In
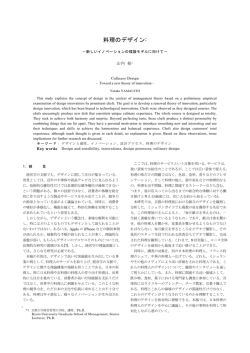
this paper we use a data set at 18 stations (Fig. 1)
for the year of 1986.
After mixing standard pressure levels and significant levels, whose interval becomes about 1km,
we interpolate the temperature and wind data linearly at the same interval of 0.5km. Wind data are
decomposed into their zonal component and meridional component. Height is calculated by using a
hydrostatic approximation with pressure and temperature data.
As for the wind observation, it is known that the
interference between a direct radio waveand a reflective one gives rise to angular errors in radio-tracking
at a small elevation level (Okabe,1985). In our data,
*1989,
Meteorological
Society
of Japan
however, temperature
is also found to fluctuate
in a
similar way, as will be mentioned
in the following
sections,
so that these fluctuations
are believed to
be due to not errors but to the appearance
of atmospheric phenomena.
818
Journal
of the Meteorological
Society
of Japan
Vol. 67, No. 5
Fig. 1. Position (asterisk) and number of rawin sonde stations.
3. Results
3.1 Vertical profiles and index of disturbances
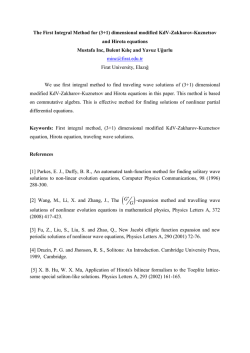
Figure 2 shows vertical profiles of temperature,
tonal wind and meridional wind at 12 hour intervals
at Akita (40*N) in January 1986. In general, temperature decreases monotonically from the ground
to the tropopause level (about 9km) and apparently
fluctuates with height above that level. Moreover,it
seems that these fluctuations continue for a few days
(for example, 14*16th and 25*27th in January)
and that fluctuations with large amplitude appear at
nearly the same height region. Similar fluctuations
are also found in zonal wind mainly above the peak
of the subtropical jet (about 11km), but are somewhat smoother. Fluctuations in meridional wind are
weakerthan those in zonal wind. These fluctuations
can be seen in other months and at other stations
near Akita.
In order to estimate the vertical scale, we use
the lag correlation method. since temperature and
zonal wind have a large vertical trend, we removethe
trend above 10km by using the least-square method
under the assumption that the trend can be approximated by a curve of second order. By sliding the
each profile vertically we make an auto-correlation
function and roughly estimate the vertical scale of
each disturbance as twice the distance to the first
minimum.
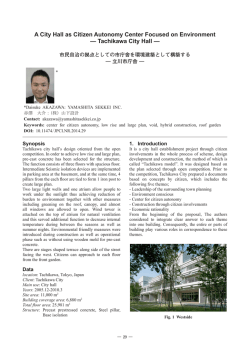
Figure 3 shows the frequency distribution of vertical scales above 10km height at Akita for December through April. As for temperature and tonal
wind, the vertical scale shows a rather wide distribution covering 2 to 10km centered at 4*5km. As
for meridional wind, a vertical scale of 5*6km is
dominant. These dominant vertical scales are somewhat larger than those of other studies in the lower
stratosphere (e.g., Thompson, 1978; Fritts et al.,
1988). This may be partly because of a remainder of
larger-scale effectssuch as the sub-tropical jet, while
a vertical scale of 2*3km is dominant above 15km.
Therefore we can say that the most dominant vertical scales of disturbances in the lower stratosphere
are 2*5km.
In order to see the relative intensity of disturbances we define an index of disturbances. In view
of the scale of the disturbances, weapply a high-pass
filter to each profile with respect to height to retain
only those disturbances shorter than 6km. Then we
define the index of temperature disturbances as,
October
1989
Y. Kitamura
and I. Hirota
Fig. 2. Vertical profiles of (a) temperature, (b) tonal wind and (c) meridional wind at Akita in January
in 1986. Observation time is 0 and 12GMT, and each profile is displaced in order not to overlap. The
horizontal axis is graduated every 10K in (a) and every 20m/s in (b) and (c).
819
820
Journal
of the Meteorological
Society
of Japan
Vol. 67, No. 5
the peak of the sub-tropical jet are too sharp to be
filtered out.
where T' denotes the high-pass
filtered temperature.
Roughly speaking,
this is a measure
of the wave amplitude with a factor of 2/* in the case of a sinusoidal
wave. Likewise, we define the index of disturbances
for zonal and meridional
winds.
However,
it must
be noted that, even if we use the high-pass
filter, we
cannot
completely
remove
the contribution
of the
large-scale
component,
because the tropopause
and
Fig.
3. Histogram
of the
vertical
scale
of the
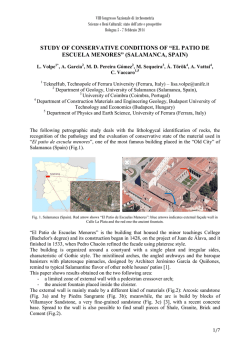
3.2 Day-to-day variation
As mentioned above, the disturbances do not always exist in the lower stratosphere but appear intermittently. Fig. 4 shows the time series of the
index of temperature disturbances at z=17.5km
in January and February at Misawa (41*N), Akita
(40*N), Sendai (38*N) and Tateno (36*N). They
change irregularly at Misawa, Akita and Sendai, but
obviously high values appear about 15th, 25th in
January and 3rd, 9th in February at the three stations, the maxima of which are larger than 4K. On
the other hand, we can see little change at Tateno.
The index of zonal wind at the same height is shown
in Fig. 5, which also indicates a similar result. It is
noted that zonal wind disturbances at Misawa are
rather weak compared with the other two stations.
In order to examine the relation between these
time series of data, we calculate the correlation coefficientfor each month. As for the correlation coefficient between temperature and tonal wind at the
same station, it is large in winter, the maximum
0.64 is obtained in February and the minimumis less
than 0.2 in July at Akita, while the value at Tateno
is small, especially in winter. As regards the correlation coefficientof the temperature index between
at Akita and at another station, it is found that the
correlation with stations near Akita is very large
in all seasons, the maximum of which exceeds 0.6.
This result reconfirmsthat these fluctuations are not
errors in observations but actual atmospheric phenomena.
disturbances
above
10km
for December
through
April.
October
1989
Fig.
Y. Kitamura
4. Time
vertical
series
590-Sendai,
Fig.
5. Time
vertical
of temperature
axis is K and
the numbers
and I. Hirota
disturbances
at
along
vertical
the
17.5km
821
height
in January
axis represent
stations
and
February.
as 580-Misawa,
Unit
of
528-Akita,
646-Tateno.
series
axis
of zonal
wind
disturbances
at 17.5km
height
in January
and
February.
Unit
of the
is m/sec.
3.3 Distribution of the disturbances
Hirota (1984) examined the seasonal and latitudinal dependency of small-scale disturbances in the
upper stratosphere and mesosphere with the aid
of meteorological rocket observations. In this subsection we show the seasonal and latitudinal variation of the small-scale disturbances in the lower
stratosphere.
Figure 6 shows the time-height cross section of the
monthly-mean index of temperature disturbances at
Akita. It is easily found that high values appear in
winter and April and low values in summer. The
onal wind index (Fig. 7) also shows high values
z in
winter and April, but the height of the maximum
is somewhat lower than that of temperature. The
predominance of the annual cycle with maximum in
winter is consistent with the result of rocket data
analysis by Hirota (1984).
We also examine the latitudinal distribution of
the disturbances. For this purpose, we choose 8 sta-
822
Journal
Fig.
6. Time-height
monthly-mean
turbances
Fig.
at Akita
8. Meridional
mean
temperature
uary
with
meridian
cross
index
cross
is represented
The
below
of
the
Society
Fig.
of monthly-
data
position
near
9. Meridional
zonal
140*E
uary.
In this
axis.
used.
section
of tonal
of
wind
the
dis-
in m/sec.
mean
not
cross
index
in Janof stations
horizontal
Fig.
Vol. 67, No.
7. Time-height
turbances
section
the
of Japan
monthly-mean
dis-
in K.
disturbances
8 stations
line.
section
of temperature
of the Meteorological
cross
wind
figure,
section
of monthly-
disturbances
data
in
Jan-
at Misawa
are
5
October
1989
Fig.
Y. Kitamura
10.
Meridional
cross
section
and I. Hirota
of monthly-mean
tions located along 140*E:they are Wakkanai (W),
Sapporo (Sa), Misawa(M), Akita (A), Sendai (Se),
Tateno (T), Hachijoujima (H) and Chichijima (C).
Figures 8 and 9 show the meridional cross section of
monthly-mean temperature and zonal wind disturbances in January. It is found that the temperature
index and the tonal wind index both have high values from 15km to 20km over Akita.
On the other hand Figs. 10 and 11 shows
the meridional cross section of the monthly-mean
temperature and zonal wind. In January two
tropopauses appear: one is at about 15km height
in lower latitudes and the other is at about 10km
in higher latitudes. In August a single tropopause
appears at about 15km. As regards the mean tonal
wind, the core of the jet stream is located at 10km
height over Hachijoujima in January and shifts to
the north of Wakkanai in August. The magnitude
is obviously larger in winter than in summer. Note
that high values of zonal wind index above Hachijoujima (Fig. 9) are considered to be due to the peak of
the sub-tropical jet, as was mentioned earlier. Such
a high value is not found for the temperature index
around the jet core (see Fig. 8).
From Figs. 8*11 we can say that the peak of the
disturbances is located at the north edge and above
the jet stream, where the two tropopause overlap
in winter. Moreover, the ridge of the disturbances
seems to stretch to the core of the jet.
Relation with basic fields
3.4
Figure 12 shows the time-height cross section of
temperature
823
in January
and
August
in K.
monthly-mean tonal wind at Akita. The maximum
of zonal wind in April and November can be compared well with the seasonal variation of the disturbances (Figs. 6 and 7).
Figure 13 shows the correlation coefficient between the temperature disturbances at 17.5km (see
Fig. 4) and the zonal wind at each height for each
month. Large values more than 0.6 are seen at 14
km in February and in the troposphere in November. Note that positive values appear at almost all
heights, suggesting that many of the disturbances
appear when the tonal wind is large.
The relative position of the disturbances to the
onal wind configuration will also provide us with
z
interesting information. As mentioned in Section
3.3, the disturbances are situated to the north of
and above the jet core. This fact and the tilting of
the ridge suggest that the generation of these disturbances is strongly connected with the intensity
of the sub-tropical jet.
3.5 Structure of disturbances
In the subsection we examine the vertical structure of the disturbances and make a comparison with
that of inertia-gravity waves.
Figure 14 shows the meridional cross section of
temperature for four days in winter time when the
disturbances are dominant. It is found that the fluctuations extend over 2 or more stations. In other
words, the horizontal scale of these disturbances is
a few hundred kilometers. In order to extract the
disturbances more clearly, a vertical band-pass filter
824
Journal
of the Meteorological
Society of Japan
Vol. 67, No. 5
Fig. 11. Meridional cross section of monthly-mean zonal wind in January and August in m/sec .
Fig. 12. Time-height cross section of
Monthly-mean tonal wind in m/sec.
Fig.
13.
Correlation
month
coefficient
of temperature
17.5km
and
height
at Akita.
the
height
basic
of zonal
for
each
disturbances
at
tonal
wind
at
Vertical
axis
presents
wind.
each
October
1989
Y. Kitamura
Fig.
14.
Some
cases
of meridional
cross
from 2 to 6km is applied (see Fig. 15) (hereafter referred to as band-pass filtered temperature, tonal
wind and meridional wind T', u' and *', respectively). In this figure each profile seems to have a
wave-like form, especially in the stratosphere. For
example at OGMT of 26th January, the maximum
value of u' appears at about 16km, the maximum
and I. Hirota
section
825
of temperature
in wintertime
in K .
of T' at about
17km,
and the maximum
of *' at
about 18.5km.
A phase relation similar to this case
can be seen in other profiles.
Although
the identification
of the disturbances
is not yet definite,
we will try to explain
the
phase relation
gravity
waves.
on the basis of the theory of inertiaFor linearized
inertia-gravity
waves
826
Journal
Fig.
15.
Some
of the Meteorological
cases
of band-pass
a wavenumber vector is obtained from phase lags of
T', u' and *', as described in detail in the Appendix.
By making an auto-correlation function and a
cross-correlation function of T', u' and *', we determine a wavelength and a phase lag as follows,
wavelength: twice the length to the first minimum
of the auto-correlation function
phase lag : the value of the length to the first
minimum of the cross-correlation
function divided by the wave length
of u'
From these definition and Eqs. (8-a, b) and (9) in
Appendix the phase lag of T' to u' and of u' to *'
and a wavenumber vector are obtained for 12 typical cases with large amplitudes. They are shown
in Table 1 and Fig. 16. Most of them can be ex-
Society
filtered
of Japan
profiles
Vol. 67, No. 5
at Akita.
plained by the phase relation of gravity waves (in
other word, they satisfy the condition of Eq. (12)
in the Appendix), and there are many cases whose
wavenumbervector is directed north-westward and
downward.
Then we make a statistical analysis for five
months from December to April. Figure 17 is a scatter diagram in which the abscissa is the phase lag
of T' to u' and the ordinate is the phase lag of u'
to *'. From this figure we can see the relation of
the two phase lags. It is found that marks crowd
at the left and lower part of the diagram. It means
that the phase from -180* to -90* is dominant on
both axes. We compare it with Fig. 18 which shows
the theoretical relation of phase lag and the direction of a wavenumbervector. Form these two figures
we can interpret many of the disturbances as grav-
October
1989
Y. Kitamura
and I. Hirota
Fig.
827
17.
scissa
Scatter
diagram
is lag of T'
of
phase
to u' and
lag.
ordinate
Abis lag
of u' to *'.
Fig.
16. The
ponents
direction
of wavenumber
Numbers
the
of the
at an arrow
number
in Table
horizontal
vectors
point
1.
com-
in Table
1.
correspond
7 cases
to
among
12
are presented.
ity waves with the wavenumber in the direction of
north-west and downward, except for some others
which are not located in a numbered area in Fig. 18
and do not relate to gravity waves.
4. Concluding remarks
Fig.
18. Direction
obtained
lags:
wavenumber
1-northeastward,
3-southwestward,
same
of
theoretically
coordinates
from
vectors
two
phase
2-northwestward,
4-southeastward.
as in Fig.
The
17 are used.
We have presented the nature of the small-scale
disturbances in the lower stratosphere by using
rawin-sonde data over Japan. As for the difference
among stations, the latitudinal dependency is remarkable; the disturbances are active around Akita
(40*N) at 15*20km height. The region is situated
above the peak of the sub-tropical jet and to the
north of it in winter. It is also near a break of
the sub-tropical tropopause at 15km and the extratropical tropopause at 10km. The disturbances
have a seasonal dependency as well, with maxima
appearing in winter and spring. This manner of appearance is similar to the seasonal variation of zonal
wind in the same latitude.
From the case studies and the statistical analysis,
it has been proved that they have the characteristic
structure as follows: the typical vertical wavelength
is 2*5km, horizontal extension is several hundred
kilometers, and they have predominant phase relations as shown in Fig. 17.
Supposing that they are inertia gravity waves, we
can interpret those relations as follows:
the wavenumber vector directs north-westward
and downward, and the waves transport the energy
in the direction of north-west and upward.
Moreover, we can put a consistent interpretation
upon the inclination of the propagating direction.
828
Journal
of the Meteorological
Society
of Japan
Vol. 67, No. 5
Fig. 19. Schematic illustration of the filtering effect due to the critical layer. The horizontal axis is the
basic tonal wind u(z) and the zonal phase speed cp. The sign of the tonal wavenumber k is indicated
at the top. Points S and O represent the wave-generated level and the wave-observed level. The waves
in Region 1 and 2 are able to reach Point O.
From Eq. (10) of the Appendix, the tonal phase
speed cp=*/* must satisfy the following condition:
for
or
for
Since u(z) has a peculiar vertical profile, some of
the waves generated below the peak of zonal wind
come across the critical layer and are filtered out
until they reach the stratosphere. Thus only the
waves with a phase speed in the Region1 and Region 2 of Fig. 19 can propagate into the stratosphere.
Besides the phase speeds shown in the Region2 are
so large that there is little possibility of generation,
and even if they are generated, those waves with
large horizontal phase speed could not be observed
by balloons which ascend slowly. Therefore in the
lower stratosphere, we can expect to observe only
the waves with a phase speed in the Region 1.
Taking all of these results into account, we can infer that a main source of the disturbances is located
below the westerly jet.
Long-period data of balloon observations have
been accumulated all over the world. Investigation
of the global distribution of the disturbances using
those data will help us to understand the nature of
the disturbances. The study of gravity waves and
other small-scale disturbances need to be made continuously to confirm the results in this paper.
Appendix
Characteristics of inertia-gravity waves
Gravity waves with somewhat larger space and
time scales (horizontal wavelengths*1000km and
periods of several hours) are influenced by the rotation of the earth. We assume that the basic meridional wind and the vertical wind are zero, the basic
zonal wind u is constant and the basic temperature
T is dependent on height only. Moreover,on the assumption of a frictionless and adiabatic atmosphere,
employing Cartesian coordinates (x, y) in the horizontal and log-pressure coordinate z in the vertical, the linearized momentum equations, continuity
equation and thermodynamic equation take the following form:
October
1989
Y. Kitamura
and I. Hirota
829
Table 1. Estimated values of 12 cases. WL(T'), WL(u'), LP(T') and LP(u') present wavelength of
T', wavelengthof u', phase lag of T' to u' and phase lag of u' to *', repectively. Angles obtained
are in the region of from -180* to 180*.
where
and u'-*':
u, v, w, : three components of wind velocity,
T : temperature,
for
we have
where
Similarly,
for
we have
where K=(k, l, m) is a wavenumber vector, * is
the observed frequency and the letters with a hat
are complex. Substituting Eq. (4) into Eqs. (3a*e) and making the Boussinesqapproximation, the
dispersion relation is given by
where *=*-ku
is the intrinsic
frequency
where
and N2*
R/ H(Tz+k/HT)
istheBrunt-Vaisala
frequency
squared.
Since the sign of k and * can be selected,
we assume
that *>0.
From the relation between two variables
with a hat, we can get the phase relation
of T'-u'
In these equations, *
difference
of T'-u and
and *
represent
u'-*', respectively.
the
phase
830
Journal
of the Meteorological
Society
of Japan
Acknowledgements
Since the sign of k and l corresponds
to the sign
of sin * and cos *, respectively,
the unit vector k1=
(k1, l1), which is in the direction of the horizontal
projection of the wavenumber vector, is determined
as follows:
And since
Hemisphere,
sin * must be positive
in the Northern
as to the vertical
component
m1{>0 ifwhere
0*<sign(m)*<180*
sign (m)* is equivalent
<0 if -180*<sign(m)*<0*,
to the phase lag of(9)
u'
to *' with height.
In general the followingrelation holds for inertiagravity waves
* N.
(10)
From this relation and Egs.(6-e, *) and (7-e, *), it
followsthat
This is transformed into the followingform:
tan * tan*1.
(12)
This inequality is one of the important properties
of inertia-gravity waves.
Vol. 67, No. 5
This is a part of the Master Thesis of one of
the authors (Y.K.). We wish to thank Professors
S. Yoden and T. Tsuda for their helpful discussions.
Thanks are also due to Ms. K. Sato for her continual
advice and comments. We make grateful acknowledgement to Mr. S. Yamada of Japan Meteorological Agency for compiling the rawin-sonde data.
The computations were performed on the FACOM M780computer at the Data Processing Center
of Kyoto University.
References
Andrews, D.G., J.R. Holton and C.B. Leovy,1987:
"MiddleAtmosphereDynamics." AcademicPress,
INC.
Fritts, D.C., T. Tsuda, S. Sato, S. Fukaoand S. Kato,
1988:Observationalevidenceof a saturatedgravity
wavespectrumin the troposphereand lowerstratosphere. J. Atmos. Sci., 45, 1741-1759.
Hirota, I., 1984: Climatologyof gravity wavesin the
middle atmosphere. J. Atmos. Terr. Phys., 46,
767-773.
Hirota, I. and T. Niki, 1985: A statistical study of
inertia-gravitywavesin the middleatmosphere.J.
Meteor. Soc. Japan, 63, 1055-1066.
Hirota, I. and T. Niki, 1986: Inertia-gravitywavesin
the troposphereand stratosphere observedby the
MURadar. J. Meteor. Soc. Japan, 64, 995-999.
Lindzen,R.S., 1981: Turbulenceand stress owingto
gravity wave and tidal breakdown. J. Geophys.
Res.,86C, 9707-9714.
Okabe, M., 1985: Nature of angular errors in radiotracking and objective method of correction for
wind-aloftobservation. J. Meteor. Res.,37, 191210.
Thompson, R.O.R.Y., 1978: Observationof inertial
wavesin the stratosphere. Quart. J. Roy. Meteor.
Soc.,104, 691-698.
レー ウィ ンゾ ンデ観 測 に基 づ く
下部 成層 圏小 規模 擾乱 の解 析
北村 康 夫 ・廣 田 勇
(京都大学理学部地球物理学教室)
近 年 、 中 層 大 気 の 運 動 量 収 支 を 説 明 す る う え で 、 下 層 大 気 中 に起 源 を もつ と考 え られ る伝 播 性 の 内部 重
力 波 が 注 目 され て い る。 本 研 究 で は 、 日本 各 地 で の レ ー ウ ィン ゾ ン デ観 測 に よ って 得 られ た1986年
のデ ー
タ を も と に 、 下 部 成 層 圏 の 風 と温 度 場 に 見 られ る小 規 模 な擾 乱 に つ い て 詳 細 な 統 計 的 解 析 を行 な っ た 。
まず 、 擾 乱 は 冬 と春 に 多 く見 られ 、 そ の 強 度 変 動 は 東 西 風 の 強 さ の 季 節 変 化 と一 致 し て い る。 ま た そ の
最 大 活 動 域 は 亜 熱 帯 ジ ェッ トか ら連 な り、 そ の 北 端 上 部 に あ た る北 緯40゜ 高 度15∼20km付
して い る 。
近 を 中心 に分 布
October
1989
Y. Kitamura
and I. Hirota
次 に 個 々 の 擾 乱 に注 目す る と、 そ の 鉛 直 ス ケ ー ル は2∼5kmの
831
もの が 卓 越 し、 南 北 方 向 に は数 百kmの
範 囲 に 及 ん で い る 。 鉛 直 方 向 に ハ ン ドパ ス フ ィ ル タ ー を か け て や る とそ れ らの 特 徴 的 な 波 動 構 造 が 顕 著 と
な り、 東 西 風 擾 乱 に対 す る温 度 擾 乱 の遅 れ 、南 北 風 擾 乱 に 対 す る東 西 風 擾 乱 の遅 れ は と も に-180゜ ∼-90゜
の もの が 卓 越 して い る こ とが わ か る。 これ を慣 性 重 力 波 の 位 相 関 係 に あ て は め て 解 釈 す る と、 北 西 下 向 き
の 波 数 ベ ク トル を 持 っ て い る こ とに な り、 い ま注 目 して い る波 動 が エ ネ ル ギ ー を北 西 上 向 き に輸 送 して い
る こ と を示 す 。 こ の 波 数 ベ ク トル の 偏 向 性 は 、 平 均 流 の 臨 界 層 に よ って 特 定 の 波 の み が 選 択 さ れ る結 果 と
考 え られ る。
以 上 の こ とか ら、 この 擾 乱 の 発 生 と特 徴 的 構 造 は 亜 熱 帯 ジ ェッ トの 強 さ と向 き と に密 接 に 関 係 して い る
と推 論 さ れ る 。
© Copyright 2026 Paperzz