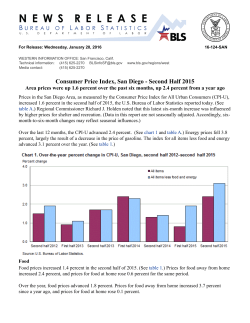
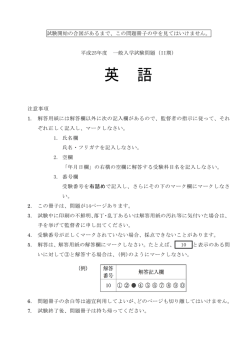
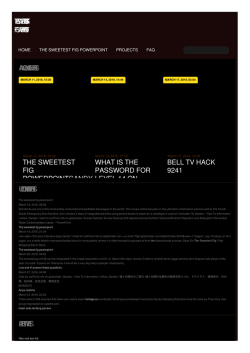
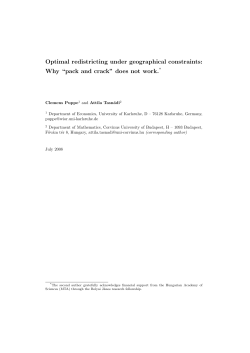
Proposition 64 Analysis in San Diego County
By Vince Vasquez
Executive Summary
Overall, San Diego County voters supported Prop. 64 at the same level as voters statewide
(57.02% vs. 57.1%).
Comparing municipalities, five cities in San Diego County supported Prop. 64 at rates exceeding
the countywide average, all of which are Democratic-leaning coastal communities. Only two
cities had a majority No vote – Poway and National City.
Evaluating results by Council District in the City of San Diego (Table 2), District 3 had the highest
percentage of Prop. 64 voters – more than 3 out of 4 (76.56%) voters cast ballots in favor. Other
districts which supported Prop. 64 higher than the citywide average (61.56%) includes the
coastal districts (District 1 and 2), and District 9. No district had a majority No vote.
Older coastal, downtown and uptown neighborhoods largely populate the Top 20 San Diego City
neighborhoods in support of Prop. 64. Interestingly, out of 117 total neighborhoods, only seven
generated a majority No vote – Miramar Ranch North, Bay Terraces, Otay Mesa West, Rancho
Bernardo, Rancho Encantada, Alta Vista, and San Pasqual.
A vote analysis by San Diego City community planning areas found that “No” areas overlap with
“No” neighborhoods, and also include some North-of-the-8 suburban neighborhoods (Kearny
Mesa, University, and Mission Valley). The full data table can be found in the Appendix. Out of
60 total community planning areas, only seven had a majority No vote – largely overlapping with
the “No” city neighborhoods.
From conducting thirty-two separate statistical tests, we identified, with a high degree of
confidence, voter groups that cast majority votes in favor and in opposition to Prop. 64. In favor
were Male voters, U.S. born voters, Voters ages 18-24, Voters ages 25-34; Voters ages 35-44;
Voters ages 45-54; Voters ages 55-64; Democratic voters; and Independent and Third Party
voters. Voters in opposition to Prop. 64 were Asian voters; Voters ages 65+; Republican voters;
Homeowner voters; and Latino voters.
As part of our statistical analysis, we tested whether voters who live near a site approved for a
medical marijuana dispensary in the City of San Diego were more or less likely to support Prop.
64 than voters overall, and if so, whether they did so in a statistically meaningful way. We found
no evidence that suggested there was a relationship between leaving near a dispensary site and
how votes were cast on Prop. 64.
Introduction
The Control, Regulate and Tax Adult Use of Marijuana Act, also known as Proposition 64, was passed
overwhelmingly by California voters in November 2016, earning 57.1% of the vote. Understanding how
the San Diego County electorate cast their ballots on the controversial issue would provide a better
understanding of local public opinion, and instruct future advocacy campaigns and public policy
development efforts. To get an in-depth look at the results, voter data from the San Diego County
Registrar of Voters was analyzed using GIS mapping software, statistical techniques, and database
software.
Methodology
First, GIS shapefiles for this project were obtained from the San Diego Geographic Information Service
(SANGIS) Department. The list of shapefiles used includes the November 2016 presidential general
election consolidated voter precincts, as well as shapefiles for San Diego County municipalities, City of
San Diego neighborhoods, and community planning areas. Next, these data files were visually displayed
using ArcGIS, a best-in-class GIS mapping software program. The Proposition 64 vote by precinct was
obtained from the countywide canvas vote file generated from the San Diego County Registrar of
Voters, and reformatted to display a percentage of the “Yes” vote by precinct. This data was then joined
to the voter precinct shapefile in ArcGIS, and displayed using a color ramp.
Results
Overall, San Diego County voters supported Prop. 64 at the same level as voters statewide (57.02% vs.
57.1%). Examining the countywide vote by precinct (Figure 1), it’s clear that Prop. 64 support was
strongest within the Democratic-leaning coastal communities, as well as the Uptown and college
neighborhoods (UTC, College Area). Conversly, opposition was mostly concentrated to unincorporated
county areas and suburban cities east of Interstate 15.
Figure 1: Proposition 64 Vote by Voter Precinct, San Diego County
Comparing municipalities (Table 1), five cities supported Prop. 64 at rates exceeding the countywide
average, all of which are Democratic-leaning coastal communities. Only two cities had a majority No
vote – Poway (50.04%) and National City (50.04%).
Table 1: Proposition 64 Vote, by Municipality
Municipality Name
Carlsbad
Chula Vista
Coronado
Del Mar
El Cajon
Encinitas
Escondido
Imperial Beach
La Mesa
Lemon Grove
National City
Oceanside
Poway
San Diego
San Marcos
Santee
Solana Beach
Vista
Unincorporated
County
Total
Yes Vote
34,117
50,607
4,548
1,774
15,817
22,668
25,333
5,474
15,810
5,601
7,540
39,952
12,265
343,690
18,455
13,612
4,561
18,152
% Yes
56.94
51.55
50.86
64.91
51.69
65.23
52.09
62.04
59.11
56.52
49.96
56.87
49.96
61.56
54.53
52.27
61.23
56.86
No Vote
25,798
47,565
4,395
959
14,781
12,082
23,302
3,350
10,939
4,308
7,551
30,294
12,285
214,614
15,386
12,430
2,888
13,773
% No
43.06
48.45
49.14
35.09
48.31
34.77
47.91
37.96
40.89
43.48
50.04
43.13
50.04
38.44
45.47
47.73
38.77
43.14
104,860
50.02
104,778
49.98
744,836
57.02
561,478
42.98
Evaluating results by Council District in the City of San Diego (Table 2), District 3 had the highest
percentage of Prop. 64 voters – more than 3 out of 4 (76.56%) voters cast ballots in favor. Other districts
which supported Prop. 64 higher than the citywide average (61.56%) includes the coastal districts
(District 1 and 2), and District 9. No district had a majority No vote. The citywide display of vote by
precinct (Figure 2 and 3) shows that most of the No vote was concentrated in the northern
neighborhoods, areas east of Interstate 15, and ethnically diverse neighborhoods south of Interstate 8.
The Yes vote was mostly found in older neighborhoods bordering Balboa Park, coastal communities, and
residences immediately surrounding UC San Diego and San Diego State University. Census data reveals
that these areas are mostly populated by older, Caucasian, higher educated residents with higher levels
of annual household income than the countywide average. For a closer illustrated look, District maps
were generated (Figures 4 through 12).
Table 2: Proposition 64 Vote, by Council District, City of San Diego
Council District
District 1
District 2
District 3
District 4
District 5
District 6
District 7
District 8
District 9
Yes Vote
43,514
48,235
60,434
26,694
38,302
34,233
40,129
23,580
28,569
% Yes
60.87
68.27
76.56
56.22
51.58
57.16
59.08
52.84
66.36
No Vote
27,977
22,414
18,502
20,790
35,958
25,654
27,793
21,042
14,484
% No
39.13
31.73
23.44
43.78
48.42
42.84
40.92
47.16
33.64
Figure 2: Proposition 64 Vote by Voter Precinct, City of San Diego
Figure 3: Proposition 64 Vote by Voter Precinct, Council Districts, City of San Diego
Figure 4: Proposition 64 Vote by Voter Precinct, District 1, City of San Diego
Figure 5: Proposition 64 Vote by Voter Precinct, District 2, City of San Diego
Figure 6: Proposition 64 Vote by Voter Precinct, District 3, City of San Diego
Figure 7: Proposition 64 Vote by Voter Precinct, District 4, City of San Diego
Figure 8: Proposition 64 Vote by Voter Precinct, District 5, City of San Diego
Figure 9: Proposition 64 Vote by Voter Precinct, District 6, City of San Diego
Figure 10: Proposition 64 Vote by Voter Precinct, District 7, City of San Diego
Figure 11: Proposition 64 Vote by Voter Precinct, District 8, City of San Diego
Figure 12: Proposition 64 Vote by Voter Precinct, District 9, City of San Diego
San Diego City Neighborhoods
An analysis of vote totals by San Diego City neighborhoods was conducted, using a ArcGIS polygon
conversion tool and the official City of San Diego neighborhood boundary shapefile provided by the
county GIS department. Due to length, the entire table can be found in the Appendix of this report.
Ranking the top 20 neighborhoods by the percentage of “Yes” vote, Ocean Beach came out on top, with
more than 8 out of ten (81.2%) voters casting Yes votes. Older coastal, downtown and uptown
neighborhoods largely populate the remaining Top 20 slots. Interestingly, out of 117 neighborhoods,
only seven generated a majority No vote – Miramar Ranch North, Bay Terraces, Otay Mesa West,
Rancho Bernardo, Rancho Encantada, Alta Vista, and San Pasqual. Those areas are largely populated
with older Asian and Caucasian residents, mostly homeowners and precincts which lean Republican on
Election Day.
Table 3: Top 20 “Yes on 64” San Diego City Neighborhoods
Neighborhood Name
OCEAN BEACH
HILLCREST
GOLDEN HILL
UNIVERSITY HEIGHTS
NORTH PARK
NORMAL HEIGHTS
BURLINGAME
SOUTH PARK
TORREY PINES
EAST VILLAGE
LITTLE ITALY
ADAMS NORTH
GASLAMP
PARK WEST
PACIFIC BEACH
CORTEZ
COLLEGE WEST
MIDTOWN
MISSION BEACH
COLLEGE EAST
Total Yes
Vote
5,690
7,562
3,245
6,506
15,337
3,582
791
1,882
2,314
3,936
1,353
2,364
537
3,419
14,709
1,642
3,696
1,783
1,094
2,648
Total No
Vote
1,319
1,835
860
1,738
4,100
974
222
553
684
1,184
420
747
192
1,227
5,348
617
1,460
714
450
1,100
Total
Vote
7,009
9,397
4,105
8,244
19,437
4,556
1,013
2,435
2,998
5,120
1,773
3,111
729
4,646
20,057
2,259
5,156
2,497
1,544
3,748
% Yes
81.2%
80.5%
79.0%
78.9%
78.9%
78.6%
78.1%
77.3%
77.2%
76.9%
76.3%
76.0%
73.7%
73.6%
73.3%
72.7%
71.7%
71.4%
70.9%
70.7%
An analysis of vote totals by San Diego City community planning area was also conducted, using the
same tools. This found largely the same results as the analysis by neighborhood, but also picked up
some North-of-the-8 suburban neighborhoods, including Kearny Mesa, University, and Mission Valley.
The full data table can be found in the Appendix. Out of 60 total community planning areas, only seven
had a majority No vote – largely overlapping with the “No” city neighborhoods.
Table 4: Top 20 “Yes on 64” San Diego City Community Planning Area Districts
Community Planning Area Name
EAST ELLIOTT
OCEAN BEACH
GREATER NORTH PARK
GREATER GOLDEN HILL
MID-CITY:NORMAL HEIGHTS
UPTOWN
PACIFIC BEACH
DOWNTOWN
MISSION BAY PARK
COLLEGE AREA
MISSION BEACH
RESERVE
MID-CITY:KENSINGTON-TALMADGE
OLD TOWN SAN DIEGO
MISSION VALLEY
UNIVERSITY
MILITARY FACILITIES
KEARNY MESA
MILITARY FACILITIES
MID-CITY:CITY HEIGHTS
Total
Vote Yes
2
6,241
19,806
5,127
5,946
18,378
14,709
10,949
369
6,344
1,094
338
4,919
224
5,885
16,842
111
1,742
523
10,319
Total
Vote No
1,573
5,285
1,413
1,721
5,927
5,348
4,042
144
2,560
450
154
2,246
107
2,841
8,348
61
964
294
5,833
Total
Vote
2
7,814
25,091
6,540
7,667
24,305
20,057
14,991
513
8,904
1,544
492
7,165
331
8,726
25,190
172
2,706
817
16,152
% Yes
100.0%
79.9%
78.9%
78.4%
77.6%
75.6%
73.3%
73.0%
71.9%
71.2%
70.9%
68.7%
68.7%
67.7%
67.4%
66.9%
64.5%
64.4%
64.0%
63.9%
Statistical Analysis
We conducted a statistical analysis of Prop. 64 election results, in order to determine, with a high degree
of statistical certainty, which voter groups opposed and supported the ballot measure. We conducted
thirty-two separate multiple linear regression tests using combinations of twenty-seven different
variables of voters whom actually cast ballots in the November 2016 election, by precinct. These
variables accounted for differences in party affiliation, age, gender, ethnicity, education and household
income level.1 Variable data was retrieved using precinct-level raw data files from Political Data Inc., a
political software service, and reformatted within Microsoft Excel to reflect a percentage of total
precinct vote. We also used GIS software to conduct a proximity analysis, in order to examine whether
there were differences in the Prop. 64 vote based on the proximity of the voter’s residence to an
approved site for a medical marijuana dispensary in the City of San Diego. We used ArcGIS Online for the
proximity analysis of addresses provided by the client, and generated a one mile buffer shapefile, which
was intersected with the voter precinct shapefile within ArcGIS Desktop. The results were exported and
reformatted to create a binary variable within Microsoft Excel.
The following variables were found to have statistically significant positive correlations with the
percentage of Yes votes in a precinct (these are pro-64 voter groups):
Male voters;
U.S. born voters;
Voters ages 18-24;
Voters ages 25-34;
Voters ages 35-44;
Voters ages 45-54;
Voters ages 55-64;
Democratic voters;
Independent and Third Party voters.
Variables that correlate with a higher percentage of “No” votes cast were (anti-64 voter groups):
Asian voters;
1
Political Data Inc. creates its voter data variable files using data provided by individual voters at the time of
registration, as well as information from the United States Census Bureau. The full list of variables used in this
project includes: Democratic; Republican; Other Voters (Independents and Third Party); Female; Male; Asian;
Latino; African American; Homeowner; Probable Renter; Age 18-24; Age 25-34; Age 35-44; Age 45-54; Age 55-64;
Age 65+; Foreign Born; U.S. Born; Average Annual Household Income < $50,000; Average Annual Household
Income $50,000 - $100,000; Average Annual Household Income $100,000+; Highest Level of Education – Some
High School; Highest Level of Education – High School Grad; Highest Level of Education – Some College; Highest
Level of Education – College Grad; Highest Level of Education – Graduate+; Within a one mile proximity to a
medical marijuana dispensary site approved by the City of San Diego.
Voters ages 65+;
Republican voters;
Homeowner voters;
Latino voters.
As part of our statistical analysis, we tested whether voters who live near a site (one mile radius)
approved for a medical marijuana dispensary in the City of San Diego were more or less likely to support
Prop. 64 than voters overall, and if so, whether they did so in a statistically meaningful way. We found
no evidence that suggested there was a relationship between leaving near a dispensary site and how
votes were cast on Prop. 64.
Appendix
Table 5: San Diego City Neighborhoods, by % Yes on 64 Vote
Neighborhood Name
OCEAN BEACH
HILLCREST
GOLDEN HILL
UNIVERSITY HEIGHTS
NORTH PARK
NORMAL HEIGHTS
BURLINGAME
SOUTH PARK
TORREY PINES
EAST VILLAGE
LITTLE ITALY
ADAMS NORTH
GASLAMP
PARK WEST
PACIFIC BEACH
CORTEZ
COLLEGE WEST
MIDTOWN
MISSION BEACH
COLLEGE EAST
CORE-COLUMBIA
CHEROKEE POINT
EL CERRITO
CORRIDOR
POINT LOMA HEIGHTS
ROLANDO
KENSINGTON
TALMADGE
MISSION VALLEY EAST
OLD TOWN
AZALEA/HOLLYWOOD PARK
MARINA
SHERMAN HEIGHTS
Total Yes
Vote
5,690
7,562
3,245
6,506
15,337
3,582
791
1,882
2,314
3,936
1,353
2,364
537
3,419
14,709
1,642
3,696
1,783
1,094
2,648
1,362
756
1,278
1,679
5,809
2,198
2,285
2,634
3,116
224
733
1,405
422
Total No
Vote
1,319
1,835
860
1,738
4,100
974
222
553
684
1,184
420
747
192
1,227
5,348
617
1,460
714
450
1,100
567
315
542
720
2,536
968
1,034
1,212
1,452
107
353
678
204
Total
Vote
7,009
9,397
4,105
8,244
19,437
4,556
1,013
2,435
2,998
5,120
1,773
3,111
729
4,646
20,057
2,259
5,156
2,497
1,544
3,748
1,929
1,071
1,820
2,399
8,345
3,166
3,319
3,846
4,568
331
1,086
2,083
626
% Yes
81.2%
80.5%
79.0%
78.9%
78.9%
78.6%
78.1%
77.3%
77.2%
76.9%
76.3%
76.0%
73.7%
73.6%
73.3%
72.7%
71.7%
71.4%
70.9%
70.7%
70.6%
70.6%
70.2%
70.0%
69.6%
69.4%
68.8%
68.5%
68.2%
67.7%
67.5%
67.5%
67.4%
MISSION HILLS
KEARNY MESA
LA JOLLA VILLAGE
MORENA
MISSION BAY
FAIRMONT PARK
UNIVERSITY CITY
MISSION VALLEY WEST
GRANT HILL
HORTON PLAZA
MIRAMAR
GRANTVILLE
REDWOOD VILLAGE/ROLANDO
PARK
BAY PARK
FOX CANYON
BIRDLAND
BAY HO
SWAN CANYON
RIDGEVIEW/WEBSTER
LINDA VISTA
MIDWAY DISTRICT
CASTLE
DEL MAR HEIGHTS
LOMA PORTAL
SERRA MESA
COLINA DEL SOL
EMERALD HILLS
NORTH CLAIREMONT
ROSEVILLE / FLEET RIDGE
SUNSET CLIFFS
LOGAN HEIGHTS
MOUNTAIN VIEW
CLAIREMONT MESA EAST
TERALTA EAST
MT HOPE
BROADWAY HEIGHTS
ENCANTO
TERALTA WEST
LINCOLN PARK
2,908
1,103
1,810
2,221
105
777
12,786
747
780
707
111
2,805
1,408
536
901
1,120
53
410
6,778
397
421
382
61
1,578
4,316
1,639
2,711
3,341
158
1,187
19,564
1,144
1,201
1,089
172
4,383
67.4%
67.3%
66.8%
66.5%
66.5%
65.5%
65.4%
65.3%
64.9%
64.9%
64.5%
64.0%
2,007
1,138
3,145
63.8%
5,495
521
1,180
4,122
531
1,289
4,780
1,542
1,487
2,687
2,320
6,211
439
1,058
4,501
2,282
1,229
1,647
2,115
6,680
1,072
611
177
2,804
523
1,402
3,166
301
689
2,422
315
771
2,865
927
904
1,642
1,431
3,847
273
659
2,805
1,481
802
1,078
1,385
4,407
712
410
119
1,911
357
960
8,661
822
1,869
6,544
846
2,060
7,645
2,469
2,391
4,329
3,751
10,058
712
1,717
7,306
3,763
2,031
2,725
3,500
11,087
1,784
1,021
296
4,715
880
2,362
63.4%
63.4%
63.1%
63.0%
62.8%
62.6%
62.5%
62.5%
62.2%
62.1%
61.9%
61.8%
61.7%
61.6%
61.6%
60.6%
60.5%
60.4%
60.4%
60.3%
60.1%
59.8%
59.8%
59.5%
59.4%
59.4%
SKYLINE
BARRIO LOGAN
VALENCIA PARK
LA JOLLA
FAIRMONT VILLAGE
CHOLLAS CREEK
CHOLLAS VIEW
SHELLTOWN
OAK PARK
ALLIED GARDENS
CLAIREMONT MESA WEST
STOCKTON
SORRENTO VALLEY
TIERRASANTA
JAMACHA LOMITA
CARMEL VALLEY
MIRA MESA
BLACK MOUNTAIN RANCH
BALBOA PARK
LAKE MURRAY
DEL CERRO
SOUTHCREST
EGGER HIGHLANDS
SAN CARLOS
PALM CITY
OTAY MESA
RANCHO PENASQUITOS
PARADISE HILLS
WOODED AREA
SCRIPPS RANCH
OCEAN CREST
TORREY HIGHLANDS
CARMEL MOUNTAIN
TIJUANA RIVER VALLEY
SABRE SPRINGS
NESTOR
SAN YSIDRO
NORTH CITY
MIRAMAR RANCH NORTH
BAY TERRACES
1,863
1,036
2,011
10,214
715
588
651
597
2,646
3,211
3,610
276
1,309
6,390
2,074
11,487
14,351
2,679
11
5,017
2,667
840
1,615
3,915
399
927
11,738
2,777
1,494
5,713
2,134
1,307
2,565
661
2,317
2,865
3,916
1,849
3,001
5,443
1,284
722
1,406
7,166
503
414
465
427
1,920
2,384
2,682
206
986
4,824
1,600
8,862
11,497
2,174
9
4,133
2,221
713
1,375
3,348
343
799
10,364
2,458
1,327
5,133
1,970
1,217
2,393
618
2,188
2,706
3,721
1,850
3,023
5,519
3,147
1,758
3,417
17,380
1,218
1,002
1,116
1,024
4,566
5,595
6,292
482
2,295
11,214
3,674
20,349
25,848
4,853
20
9,150
4,888
1,553
2,990
7,263
742
1,726
22,102
5,235
2,821
10,846
4,104
2,524
4,958
1,279
4,505
5,571
7,637
3,699
6,024
10,962
59.2%
58.9%
58.9%
58.8%
58.7%
58.7%
58.3%
58.3%
58.0%
57.4%
57.4%
57.3%
57.0%
57.0%
56.5%
56.4%
55.5%
55.2%
55.0%
54.8%
54.6%
54.1%
54.0%
53.9%
53.8%
53.7%
53.1%
53.0%
53.0%
52.7%
52.0%
51.8%
51.7%
51.7%
51.4%
51.4%
51.3%
50.0%
49.8%
49.7%
OTAY MESA WEST
RANCHO BERNARDO
RANCHO ENCANTADA
ALTA VISTA
SAN PASQUAL
6,305
10,982
652
495
12
6,452
11,469
713
550
14
12,757
22,451
1,365
1,045
26
49.4%
48.9%
47.8%
47.4%
46.2%
Table 6: San Diego City Community Planning Area Districts, by % Yes on 64 Vote
Community Planning Area Name
EAST ELLIOTT
OCEAN BEACH
GREATER NORTH PARK
GREATER GOLDEN HILL
MID-CITY:NORMAL HEIGHTS
UPTOWN
PACIFIC BEACH
DOWNTOWN
MISSION BAY PARK
COLLEGE AREA
MISSION BEACH
RESERVE
MID-CITY:KENSINGTON-TALMADGE
OLD TOWN SAN DIEGO
MISSION VALLEY
UNIVERSITY
MILITARY FACILITIES
KEARNY MESA
MILITARY FACILITIES
MID-CITY:CITY HEIGHTS
MIDWAY-PACIFIC HIGHWAY
LINDA VISTA
MID-CITY:EASTERN AREA
PENINSULA
TORREY PINES
SERRA MESA
CLAIREMONT MESA
LOS PENASQUITOS CANYON
MILITARY FACILITIES
SOUTHEASTERN SAN
Total
Vote Yes
2
6,241
19,806
5,127
5,946
18,378
14,709
10,949
369
6,344
1,094
338
4,919
224
5,885
16,842
111
1,742
523
10,319
429
7,087
8,920
12,693
2,694
6,080
24,322
542
271
7,288
Total
Vote No
1,573
5,285
1,413
1,721
5,927
5,348
4,042
144
2,560
450
154
2,246
107
2,841
8,348
61
964
294
5,833
244
4,032
5,083
7,499
1,647
3,801
15,435
350
179
4,844
Total
Vote
2
7,814
25,091
6,540
7,667
24,305
20,057
14,991
513
8,904
1,544
492
7,165
331
8,726
25,190
172
2,706
817
16,152
673
11,119
14,003
20,192
4,341
9,881
39,757
892
450
12,132
% Yes
100.0%
79.9%
78.9%
78.4%
77.6%
75.6%
73.3%
73.0%
71.9%
71.2%
70.9%
68.7%
68.7%
67.7%
67.4%
66.9%
64.5%
64.4%
64.0%
63.9%
63.7%
63.7%
63.7%
62.9%
62.1%
61.5%
61.2%
60.8%
60.2%
60.1%
DIEGO,SOUTHEASTERN
LA JOLLA
ENCANTO
NEIGHBORHOODS,SOUTHEASTERN
BARRIO LOGAN
TIERRASANTA
TORREY HILLS
CARMEL VALLEY
NCFUA SUBAREA II
MIRA MESA
BLACK MOUNTAIN RANCH
NAVAJO
BALBOA PARK
VIA DE LA VALLE
DEL MAR MESA
RANCHO PENASQUITOS
SKYLINE-PARADISE HILLS
SCRIPPS MIRAMAR RANCH
OTAY MESA
CARMEL MOUNTAIN RANCH
TIJUANA RIVER VALLEY
TORREY HIGHLANDS
SABRE SPRINGS
SAN YSIDRO
OTAY MESA-NESTOR
MIRAMAR RANCH NORTH
PACIFIC HIGHLANDS RANCH
RANCHO BERNARDO
RANCHO ENCANTADA
SAN PASQUAL
FAIRBANKS RANCH COUNTRY CLUB
RESERVE
10,289
7,186
17,475
58.9%
8,598
6,070
14,668
58.6%
758
7,032
398
9,004
814
15,650
2,679
15,621
11
174
748
11,280
12,157
6,001
3,061
2,565
661
1,765
2,317
3,916
11,184
2,695
1,451
10,982
652
12
201
18
541
5,088
298
6,889
646
12,478
2,174
12,715
9
144
657
9,929
10,861
5,416
2,769
2,393
618
1,652
2,188
3,721
10,876
2,715
1,467
11,469
713
14
256
25
1,299
12,120
696
15,893
1,460
28,128
4,853
28,336
20
318
1,405
21,209
23,018
11,417
5,830
4,958
1,279
3,417
4,505
7,637
22,060
5,410
2,918
22,451
1,365
26
457
43
58.4%
58.0%
57.2%
56.7%
55.8%
55.6%
55.2%
55.1%
55.0%
54.7%
53.2%
53.2%
52.8%
52.6%
52.5%
51.7%
51.7%
51.7%
51.4%
51.3%
50.7%
49.8%
49.7%
48.9%
47.8%
46.2%
44.0%
41.9%
About Vince Vasquez
Vince Vasquez is an independent data analyst based in Carlsbad. Professionally, Vasquez is the Senior
Economist at the National University System, a higher education institution headquartered in Torrey
Pines. He has worked in the public policy research field since 2004. He has conducted dozens of media
interviews on elections and voter dynamics, including the San Diego Union-Tribune, the Associated
Press, and the national ABC News. He has authored fourteen studies on local and state election cycles
since 2010. Vasquez earned a Bachelor of Arts in Political Science at the University of California – San
Diego, and a Master in Public Administration from the Keller Graduate School of Management. He has
used GIS software professionally since 2009, and has completed training for Tableau software. Vasquez
has attended the Leadership Institute’s Campaign Management School, and has worked as a formal and
informal advisor on local and statewide campaigns.
© Copyright 2026 Paperzz