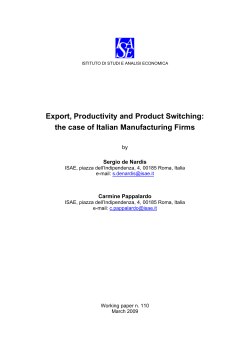
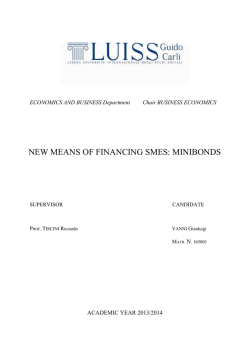
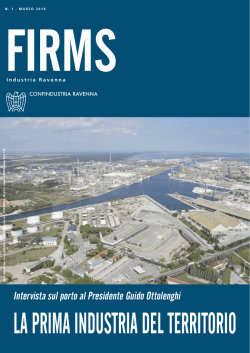
325
Statistica Applicata Vol. 19, n. 4, 2007
FIRMS’ SURVIVAL AND COMPETITIVENESS:
A CASE STUDY IN TUSCANY 1
Margherita Velucchi
Dipartimento di Statistica “G.Parenti”, Università di Firenze
V.le G.B. Morgagni, 59, 50134, Firenze, Italy
[email protected]
Alessandro Viviani
Dipartimento di Statistica “G.Parenti”, Università di Firenze
V.le G.B. Morgagni, 59, 50134, Firenze, Italy
[email protected]
Abstract
Survival rates of firms is one of the most interesting determinants of their
competitiveness in modern economies. This paper aims at identify the relationships among
some firms’ characteristics and their survival in the market. We use a high level of sectors
disaggregation and we study Tuscan firms behavior between 2000 and 2005 both in
manufacturing and service sectors as a case study to capture recent market dynamics. The
empirical analysis shows that firms on average are characterized by small size and low
technological intensity. Both in manufacturing and service sectors the survival rates for
large size firms are significantly higher than those of smaller firms while the survival rates
after few years are very low. Service firms show higher survival probability than
manufacturing firms and their hazard rates turn out to be less sensitive to size. Furthermore,
we find evidence of technological niches in traditional sectors that foster competitiveness
of this region.
Keywords: Business Demography, Survival, Competitiveness, Knowledge Intensive Business Sectors (KIBS)
1
We would like to thank Luigi Biggeri, Gianni Marliani, Lucia Buzzigoli, Laura Grassini, Matilde
Bini and Stefano Casini Benvenuti for their comments that strongly improved this paper. This
paper is part of the research project no. 2005139545_003 funded by the MIUR.
326
Velucchi M., Viviani A.
1. INTRODUCTION
In recent years, the economic literature has focused on the birth of new firms and
their survival rates as crucial variables for economic growth and competitiveness
(Bartelsman, Scarpetta and Schivardi, 2003, Bartelsman, Haltiwanger and Scarpetta, 2004, Audretsch et al. 2006). For instance, ISTAT Annual Report (2006)
shows that the low Italian economic growth and competitiveness between 1999
and 2004 depends on three main factors: low firms’ productivity, sectoral composition and business demography. In Italy, firms’ size is half the European average
and their productivity is 10% lower. Moreover, 4 years after birth, only 60% of the
Italian firms survive; they specialize in traditional sectors with low productivity
and low technological intensity.
This paper focuses on firms’ survival and identify the relationships among some
firms’ characteristics and demographic dynamics and survival in their markets (6digit)2 . We use firm-level data from AIDA dataset (Bureau Van Djck Database)
for Tuscan firms both in manufacturing and service sectors. Tuscany, indeed, is
one of the most dynamic regions in Italy: it includes both large firms and industrial districts, a large tourist sector and several “Made in Italy” brands and it can
be considered as a good proxy for the Italian performance during 2000 and 20053 .
In this paper, we analyze, firstly, the differences in the likelihood of survival between large and small firms and, secondly, the effects of the size and technological
context on the regional likelihood of survival. The following section surveys the
literature on business demography, section 3 introduces the database and the estimation techniques, section 4 presents the empirical results and section 5 draws
some conclusions.
2
3
Standard dataset at the usual level of aggregation (2-3 digit) describe properly industries
evolution more than markets. An industry typically encompasses many markets (and technological
regime), each with its associated product category; markets are not independent of each other and
usually have very peculiar characteristics (Sutton, 1998).
Nearly 387 thousand firms work in Tuscany, 98.7% of which have fewer than 20 employees,
manufacture textiles, hides, footwear, clothing, handbags and jewelry. There are small ateliers
and large enterprises such as Ferragamo, Gucci and Prada. Prato is the home of a renowned
textilemanufacturing industrial district; Arezzo is famous for its gold jewelry; Montelupo is one
of the key ceramic making centers in the country. The area around Santa Croce sull’Arno, in the
province of Pisa, carries on the great tradition of tanning. The old crafts of working iron,
alabaster, straw or leather are not merely surviving and they are being rediscovered by the new
generations. This region is Italy’s third major manufacturing center, after Milan and Turin.
Tuscany also manufacturers chemicals, foods, steel, metals, glass and pharmaceutical: Galileo,
Nuova Pignone and Breda are the most famous Tuscan mechanical and advanced technology
companies.
Firms’ survival and competitiveness: a case study in Tuscany
327
2. THE DEMOGRAPHY OF FIRMS: A FRAMEWORK FOR THE
ANALYSIS
Since the empirical evidence proposed by Gibrat in 1931, the economic literature deals with birth and survival of firms (Bottazzi et al., 2007; Bartelsman et
al. 2004; Bartelsman et al., 2003; Bottazzi, Secchi, 2004). Recent empirical studies suggest to use survival models (Cox Models) to investigate this phenomenon
showing that, on average, smaller firms have a lower probability of survival but
those who survive grow proportionately faster than larger firms (Evans, 1987;
Hall, 1987, Agarval, Audretsch, 2001). This approach focuses on the way firms
enter an industry, grow, survive or exit from the markets (Geroski, 1995, Sutton, 1997) showing the existence of strong relationships between the likelihood
of survival and the firm’ size (Dunne et al., 1988, 1989; Audretsch, 1991, 1995;
Agarval, 1997; Mata, Portugal, 1994; Agarval, Audretsch, 2001; Eurostat, 2005;
Audretsch et al. 2006). These empirical studies also suggest that the number
and the evolution of entrants in an industry may not be invariant to the stage of
life cycle (Agarval Gort, 1996; Agarval, 1998): the number of entrants can be a
proxy for the number of innovations in an industry and evolves over the life-cycle.
Moreover, according to the theory of strategic niches (Porter, 1979, Caves and
Porter, 1977; Caves, 1998), they show that firms remain small because they occupy product niches that are not accessible to their larger counterparts Audretsch
et al. 2006). Hence, size represents an advantage in increasing the likelihood of
survival in the formative, more technological advanced stage of the industry, but
not in a mature stage and in traditional sectors in which the size advantage should
not be statistically significant.
3. DATA AND STATISTICAL MODEL
3.1 DATA
This study uses data on 6-DIGITS manufacturing and services firms from
AIDA dataset (Bureau Van Djck Dataset) between 2000 and 2005. AIDA collects
digital balance sheets of Italian companies whose production value is greater than
100,000 euros (around 600,000 firms) since 1996. Other information are also accessible: economic activity (ATECO code), geographical location, identification
codes, legal form, etc.. The interest in using this database is due to production
of data at local level in Italy and it is useful for modelling dynamic economic behavior using micro data. However, data from AIDA have to be carefully checked
because values out of range, missing and duplicated data are present and affect
328
Velucchi M., Viviani A.
the reliability of the estimates (see for instance, Calia, Filippucci, 2006)4 .
In this paper, we consider firms in their first 10 years of life, between 2000 and
2005, including firms that entered the market between 1990 and 2005. This allows to capture the firms’ dynamics during the early stages of life, the more risky
ones. We measure the size of the firm by the total sales - 2005 prices adjustedand we classify firms according to ten size classes. Because the firms’ size distribution is highly skewed, equally-sized classes do not allow to distinguish between
“small” and “large” firms: the result would be a polarized distribution (huge number of “very small firms” and only few “big firms”) 5 . To avoid this, we adopted
the procedure introduced by Geweke, Marshall and Zarkin (1986), to eliminate
inconsistency problems in the axioms at the basis of the discrete Markov Chains
theory (Fractile Markov Chains). They propose to use equally represented and not
equally sized classes. In other words, ∀t and ∀ j : 1, 2, . . . , n,
π j,t = n−1
where t is time, j are the n classes and π j,t denotes the proportion of the population
in state j at time t. Hence, we define a number of classes such that the proportion
of the population (firms) in each class j, for each t, is constant and equal to n−1 .
One of the attractions of the fractile model is that it abstracts completely from distribution, focusing on units mobility. Hence, following the procedure described,
we derive the following 10 fractile classes (Table 1).
Finally, we classify markets by technology levels distinguished by low, mediumlow, medium-high and high technological intensity. This classification captures
innovations occurring in the formative or in the mature stage of the life cycle of
the markets. We use the classification proposed by the OECD Science and Technology Scoreboard (2005, 2006, 2007) for manufacturing firms and the classification based on the definition of Knowledge Intensive Businness Sectors (KIBS)
proposed by Miles (1995) and Nählinder (2002), for services (see Appendix A).
4
5
To test the reliability of the dataset, internal checks have been performed on the variables (sales,
economic activity code, legal form, date of birth and end date of financial statement). Few
problems on missing data have been detected but for some companies fiscal codes (CCIAA) are
duplicated. Double check on the dataset rarely shows the existence of different geographical
location, different legal form or different economic activity code for the same company in two
successive years. Direct control for larger companies allows to correct (when necessary) and
keep the record. Unfortunately, when duplication or incoherences are found for smaller firms
records have been dropped because relevant information for direct controls are not usually
available (less than 0.5% of data).
See, for instance, Bottazzi et al., 2007.
329
Firms’ survival and competitiveness: a case study in Tuscany
Tab. 1: Classes of Sales in Manufacturing and Service Sectors (Euro).
Class
1
2
3
4
5
6
7
8
9
10
3.2
Sales in Services
Sales in Manufacturing
100,000-149,600
149,601-211,040
211,041-286,230
286,231-392,800
392,801-540,120
540,121-740,080
740,081-900,000
900,001-1,054,800
1,054,801-3,500,000
More than 3,500,000
100,000-166,800
166,801-254,300
254,301-359,100
359,101- 488,000
488,001- 648,270
648,271- 900,000
900,001-1,285,400
1,285,401-1,957,600
1,957,601-3,500,000
More than 3,500,000
STATISTICAL MODEL
To study the determinants of likelihood of survival of firms we use the analysis of duration (Lancaster, 1990). Following this approach, the variable of interest
is the length of time that elapses from the beginning of some events either until
their end or until the measurement is taken which may precede termination. Observations will typically consist of a cross section of durations t1 ,t2 , · · · ,tn ∈ T ,
where T is a random variable (discrete or continue). For this type of data, the
analysis of duration allows to estimate the probability that the event “failure” appears in the following period. The process being observed may have begun at
different points in calendar time and, because its length is not constant over time,
the random variable T is unavoidably censored.
Life-table analysis and Cox regressions can be performed to study life course of
firms. Life table analysis shows firms survival and failure rates and estimates the
survival rate at time s, where s is derived by the fraction of the total number of
firms that survived at least s years. Life tables give the number of firms that die
conditional on their age: they represent the probability of failure given that the
firm has survived s years.
Let T be a random variable with a cumulative probability
F(t) =
t
0
f (s)ds = P(T ≤ t)
where f (t) is the continuous probability distribution. We are interested in the
probability that the period is of length at least t, which is given by the survival
function
S(t) = 1 − F(t) = P(T ≥ t)
330
Velucchi M., Viviani A.
and the probability that the phenomenon will end the next short interval of time ∆
is
l(t, ∆) = P(t ≤ T < t + ∆ | T ≥ t)
A useful function to describe this aspect is the Hazard Rate:
λ (t) = lim
∆→0
F(t + ∆) − F(t)
P(t ≤ T < t + ∆ | T ≥ t)
f (t)
= lim
=
∆→0
∆
∆S(t)
S(t)
which is the rate at which spells are completed after duration t, given that
they last at least until t. λ is the parameter to estimate and the estimation method
is the Maximum Likelihood by the Cox Proportional Hazard Regressions.
These models are used to measure the effect of different regressors (in our case
entry size and technological level) on the survival probability of the phenomenon,
estimating the regressors hazard rates. The hazard function hi (t) of a firm i is
expressed as
hi (t) = h(t, x) = h0 (t) exp(xi β )
h0 (t) being an arbitrary and unspecified baseline hazard function representing the probability of failure conditional on the fact that the firm has survived until
time t. 6 , xi is a vector of measured explanatory variables for the i-th firm and β
is the vector of unknown parameters to be estimated. Negative coefficients or risk
ratios less than one imply that the hazard rate decreases and the corresponding
probability of survival increases 7 .
4. SURVIVAL ANALYSIS: A COMPARATIVE PERSPECTIVE
This section analyzes the relationship between firms likelihood of survival
and their size and technological level to investigate whether being a large or a
small firm producing high or low tech goods can improve its competitiveness in
the market, at least in terms of survival probability. We expect to find that size
and technology represent critical determinants for firms capability to compete in
the market.
6
7
This function is unspecified for generality purposes and ease of interpretation.
Two tests of homogeneity (the parametric Likelihood Test and the nonparametric Log-Rank) are
conducted to check for significance of differences between large and small entry size survival
rates within the different environments based on the technological level. They are available from
the authors upon request.
331
Firms’ survival and competitiveness: a case study in Tuscany
Firstly, we present the results from manufacturing firms and, secondly, the results
from service firms. For each, we include descriptive statistics and discuss the
results of life table analysis and Cox regressions.
4.1 MANUFACTURING
In Table 2 and Table 3 descriptive statistics are presented. Table 2 shows
the data structure. The vast majority of firms are small (60% in Tuscany) and
low technology intensive (62%). From this preliminary analysis, it turns out that
Tuscan forms, as expected, are small and traditional, often craftsmanship firms,
but what does it mean in terms of their survival and, consequently, in terms of
their competitiveness in the market?
Table 3 shows that manufacturing firms have, on average, a quite low expectancy
of life (5 years and half) and technological level (around 1, which means mediumlow technological level) while their size, on average, is 5.5 (around 500,000 euros
sales). As expected, the number of small firms is higher than the number of large
firms, as well as the number of firms in traditional sectors is much higher than the
number of firms in high tech sectors.
Tab. 2: Percentage of Firms in each group in Tuscany.
Small Firms
59.99
Medium Firms
19.98
Big Firms
20.04
Low-Tech Firms
62.07
Medium-Low Firms
21.18
Medium-High Firms
13.16
High Firms
3.59
Note: for classes of sales, see Table 1.
Tab. 3: Descriptive Statistics: Manufacturing Firms in Tuscany.
Variable
Mean
Std.Dev.
Min
Max
Size
5.50
2.87
1
10
Span
5.33
2.64
1
10
Tech
0.58
0.85
0
3
Note: Sample Size: 4901 observations.
Figure 1 presents results from the life table analysis. Survival rate after 4
years is 60%, confirming what assessed by ISTAT in the Annual Report (2006).
Survival rates for large firms are always significantly higher than for the smaller
ones; this confirms the hypothesis on the positive relationship between firms’ size
332
Velucchi M., Viviani A.
and their likelihood of survival (Audretsch, 1991, 1995). Only 55% of small firms
survive four years compared to 73% of the large firms and the difference is even
more evident after seven years ( 21% vs. 36%). Figure 1 also shows that likelihood of survival varies with technology level (low, medium, high). The likelihood
of survival increases from low to high tech markets (four years probability levels:
61% in low tech and 64% in high tech). After 4 and 7 years after birth, only 65%
and 30% of high tech firms are still active in Tuscany, respectively (the likelihood
of survival after 4 years is 65% and after 7 years it is 30%).
Fig. 1: Survival Rates of Manufacturing Firms in Tuscany.
Table 4 presents the results from Cox proportional hazard regressions to asses
the effect of regressors on the hazard rate function and to measure the risk ratio
associated to each variable8 . A negative coefficient implies a decrease in hazard
rate and the effect of the variable on the hazard rate is captured by the deviation
of the risk ratio from 1.
A set of regressions has been run, testing for the effect of size and technological
level for small firms (regression 1), medium-sized firms (regression 2) and large
firms (regression 3). Then, a focus on technological level has been implemented,
testing for the effect of size on low-tech firms (regression 5), medium-low tech
firms (regression 6), medium-high tech firms (regression 7) and high-tech firms
(regression8). All coefficients are negative and strongly significant in regression
1: hazard rates are lower in high tech markets and for larger-size firms. Entering
a high tech market reduces a firm’s hazard rate (40% in Tuscany) as well as a
larger size reduces the failure risk (15% in Tuscany). Regression 2 and 3 on small
8
Additional results and full diagnostic analysis are available upon request.
333
Firms’ survival and competitiveness: a case study in Tuscany
and medium firms confirm the results obtained in the whole sample: size gives an
advantage to large size firms, producing high tech goods. Regression 4 focuses
only on the largest firms of the sample showing that their survival is less sensitive
to further increase in size or technological intensity. In other words, size has a
non-linear effect on the firms’ likelihood of survival. Focussing on regressions
from 5 through 8, we find that size matters in low, medium-low, medium-high
tech markets, but smaller firms have an hazard similar to their larger counterparts
in high tech markets. This is in line with the existence of technological niches in
traditional sectors in Tuscany (leather goods, fashion, gold are all craftsmanship
goods): size represents an advantage in increasing the likelihood of survival in
mature, traditional markets but not in formative, high tech markets (Porter, 1979,
Caves and Porter, 1977). Figure 2 reports a graphical representation of hazard
rates for different firms’ size and technological level.
Tab. 4: Cox Regressions: Manufacturing Firms.
H.R.(p-value)
1
Size
Tech
0.85 (0.000)
0.60 (0.000)
2
Size
Tech
0.94 (0.222)
0.63 (0.000)
3
Size
Tech
0.94 (0.886)
0.46 (0.054)
4
Size
Tech
0.37 (0.061)
0.47 (0.093)
5
6
7
8
Size
Size
Size
Size
0.86
0.84
0.70
0.89
(0.000)
(0.012)
(0.003)
(0.602)
Note: All firms (1), Small firms (2), Medium firms (3), Big firms (4), Low tech firms (5), Medium-low
tech firms (6), Medium-high tech firms (7), High tech firms (8).
4.2 SERVICES
Descriptive statistics for service firms are presented in Table 5 and Table
6. Firstly, service firms are more numerous than manufacturing firms (14,483
versus 4,901 in Tuscany). Also, the majority of them is classified as small and
low technology intensive: they are traditional business services like retail trade
or hotels and restaurants (tourist services in Tuscany are well developed), not
knowledge intensive business services. Tables 5 and 6 show that service firms, on
average, are larger but technologically less intensive than manufacturing firms (on
average, 0.21).
334
Cox proportional hazards regression
0 01 02 03 04
Smoothed hazard function
Velucchi M., Viviani A.
0
2
4
6
8
10
analysis time
size=1
size=5
size=10
Fig. 2: Hazard Rates of Manufacturing Firms in Tuscany. Different Sizes.
Figure 3 presents results from the life table analysis. Survival rates for service firms are higher than the corresponding rates for manufacturing firms. Also
for service firms, survival rates decrease substantially after four years while large
firms show rates that are always significantly higher than those of small firms. In
particular, 61% of large Tuscan firms survive after 4 years from birth, while only
50% of small service firms still work after four years (very close to the value derived for small manufacturing firms), confirming the positive relationship between
size and survival in manufacturing. The same Figure shows, also for service firms,
that likelihood of survival varies with technology level. The likelihood of survival
increases from P-Kibs (Professional-knowledge intensive business service) to TKibs sectors (Technological-knowledge intensive business service). The probability of survival after 4 years is 55% for P-kibs firms and 61% for T-kibs firms.
Tab. 5: Percentage of Firms in each group in Tuscany.
Small Firms
47.47
Medium Firms
18.7
Big Firms
33.83
Low-Tech Firms
88.36
Medium-Low Firms
4.25
Medium-High Firms
4.82
High Firms
Note: for classes of sales, see Table 1.
2.58
335
Firms’ survival and competitiveness: a case study in Tuscany
Tab. 6: Summary Statistics: Service Firms in Tuscany.
Variable
Mean
Std.Dev.
Min
Max
Size
6.26
2.98
1
10
Span
5.14
2.52
1
10
Tech
0.21
0.64
0
3
Note: Sample Size: 14,483 observations.
Table 7 presents the results from Cox proportional hazard regressions9 . Following the procedure implemented for manufacturing firms, we run a set of regressions, testing for the effect of size and technological level for small firms
(regression 1), medium-sized firms (regression 2) and large firms (regression 3).
Then, a focus on technological level has been implemented, testing for the effect
of size on low-tech firms (regression 5), medium-low tech firms (regression 6),
medium-high tech firms (regression 7) and high-tech firms (regression8). Regression 1 shows that all coefficients are negative and strongly significant: size and
technological intensity are positively related to probability of survival. Entering a
high tech market reduces a firm’s hazard rate as well as a larger size reduces the
failure risk showing the same relationships found for manufacturing firms even if
the effect of size on the failure rate is lower (on average, size reduces the hazard
rate only by 5%) while the effect of technology is stronger (on average it reduces
the hazard rate by 65%) than for manufacturing firms. Regression 2 and 3 on small
and medium firms confirm results sketched above for the whole sample: size gives
an advantage to firms with larger size and intensive knowledge skills. Regression
4 focuses only on big firms showing that neither size nor technological intensity
are significant in affecting the firm’s hazard rate. Regressions from 6 to 8 show
that the effect of size on knowledge intensive firms is not significant, stressing that
size is less relevant in reducing the risk of high-tech firms. On the contrary, size
is important in reducing traditional and P-kibs firms hazard rate: in Tuscany the
failure rate is reduced by 5%. Strictly speaking, in competitive markets firms in
low skilled services sectors have to compete to survive: they can either increase
their skills or their size. Figure 4 reports a graphical representation of hazard rates
for different firms’ size and technological level.
9
Additional results and full diagnostic analysis is available upon request.
336
Velucchi M., Viviani A.
Fig. 3: Survival Rates of Service Firms.
Tab. 7: Cox Regressions: Service Firms in Tuscany.
H.R.(p-value)
1
2
3
4
Size
0.95 (0.001)
Tech
0.69 (0.000)
Size
0.99 (0.782)
Tech
0.63 (0.000)
Size
1.04 (0.839)
Tech
0.89 (0.519)
Size
0.93 (0.639)
Tech
0.72 (0.109)
5
Size
0.95 (0.001)
6
Size
0.92 (0.302)
7
Size
1.04 (0.607)
8
Size
1.12 (0.444)
5. CONCLUSIVE REMARKS
Firms’ dynamics are commonly considered one of the most important factors for economic growth and competitiveness of a modern economy. This paper
studies the survival dynamics of firms in Tuscany between 2000 and 2005, both in
manufacturing and service sectors, using a 6-digit level of aggregation to capture
market and not simply industry dynamics from AIDA database.
The empirical analysis shows that firms are characterized by small size and low
technological intensity. The survival rates for large firms are significantly higher
337
01
02
03
Cox proportional hazards regression
0
Smoothed hazard function
Firms’ survival and competitiveness: a case study in Tuscany
0
2
4
6
8
10
analysis time
size=1
size=5
size=10
Fig. 4: Hazard Rates of Service Firms in Tuscany. Different Sizes.
than those of smaller ones and, on average, the survival rates after four or seven
years are very low both in manufacturing and service sectors. More specifically,
from the analysis of duration, Tuscany shows that size matters in low tech sectors,
but smaller firms have an hazard rate similar to their larger counterparts in high
tech sectors. This confirms the existence of technological niches: size represents
an advantage in increasing the likelihood of survival in mature, traditional markets like leather goods or apparel, but not in formative, high technology intensive
markets, like bio-tech.
Similar results hold for traditional and knowledge intensive services. Service
firms live longer than manufacturing firms and their hazard rates are less sensitive to size. The large majority of service firms are in traditional business services
like retail, trade or hotels and restaurants and very few in knowledge intensive
business services. In service sectors, there’s no evidence of strategic niches. On
the contrary, service firms’ hazard rates in Tuscany seem to be extremely sensitive to technology: any improvement in terms of technological intensity would
increase their survival rate in the market. In competitive markets, like advanced
services, firms in low-tech sectors have to compete to survive: they can either increase their skills or their size.
The analysis shows strengths and weaknesses of the Tuscan industrial system and
its competitiveness. Indeed, small, low-tech firms have a limited role in global
markets and, because their survival rates are lower than their larger counterparts,
their strategies are inevitably short-run strategies, affecting the competitiveness of
the system as a whole. Of course, the firms’ behavior, dynamics and competitive-
338
Velucchi M., Viviani A.
ness are strongly related to their sector. In this paper, we propose an aggregate
analysis (manufacturing and service firms) while a detail on specific sectors (e.g.
made in Italy sectors or specific successful industrial districts) and internationalization mode of Italian firms is left for future research. Also, the analysis could
easily be generalized to all Italian regions including other covariates and using a
different, more reliable database.
6. APPENDIX A: TECHNOLOGICAL INTENSITY CLASSIFICATION
• Manufacturing: Source: OECD: ANBERD and STAN databases, May 2005
(ATECO 2002 in parenthesis)
High-technology industries:
– Aircraft and spacecraft
– Pharmaceuticals
– Office, accounting and computing machinery
– Radio, TV and communciations equipment
– Medical precision and optical instruments
Medium-high-technology industries:
–
–
–
–
–
Electrical machinery and apparatus, n.e.c.
Motor vehicles, trailers and semi-trailers
Chemicals excluding pharmaceuticals
Railroad equipment and transport equipment, n.e.c.
Machinery and equipment, n.e.c.
Medium-low-technology industries:
–
–
–
–
–
Building and repairing of ships and boats
Rubber and plastics products
Coke, refined petroleum products and nuclear fuel
Other non-metallic mineral products
Basic metals and fabricated metal products
Low-technology industries:
–
–
–
–
Manufacturing, n.e.c.; Recycling
Wood, pulp, paper, paper products, printing and publishing
Food products, beverages and tobacco
Textiles, textile products, leather and footwear
Firms’ survival and competitiveness: a case study in Tuscany
339
• Services: Source: Miles, 1995; Nählinder, 2002 The acronym KIBS means
knowledge intensive business services and it has been introduced to better
describe a set of activities that create high tech intangible goods requiring
knowledge intensive skills to be produced (Bilderbeek et al. , 1998). Even if a
common view does not exist, recently a good classification has been proposed
by Nählinder (2002). Three classes have been created:
– Technology-Oriented KIBS (T-Kibs): more directly involved in high
technology production processes
– Computer-Oriented KIBS (C-Kibs): including services involved in the use
of ICT
– Professionally-Oriented Kibs (P-Kibs): including high professional skills
activities but not directly linked to high technology production processes
KIBS that are liable to be mainly related to new technologies include:
– Computer networks/telematics services (e.g. Internet Service Providers,
VANs, on-line databases);
– some Telecommunications (especially new business services);
– Software;
– Other Computer-related services - e.g. Facilities Management, Web support
services, disaster recovery and business continuity services;
– Training in new technologies;
– Design involving new technologies;
– Office services involving new office equipment);
– those Building services that involving new IT equipment such a Building
Energy Management Systems;
– Management Consultancy involving new technology;
– Technical engineering;
– Environmental services involving new technology; e.g. remediation;
monitoring;
– Scientific/laboratory testing services; R&D Consultancy
A list of professional KIBS which are not predominantly technology-based would
include:
–
–
–
–
Marketing, market research, and advertising;
Training (other than in new technologies);
Specialized Personnel Recruitment and headhunting;
Design (other than that involving new technologies);
340
Velucchi M., Viviani A.
– some Financial services (e.g. securities and stock-market-related activities);
– Office services (other than those involving new office equipment, and
excluding “physical” services like cleaning);
– Building services (e.g. architecture; surveying; construction engineering,
but excluding services involving new IT equipment such as Building Energy
Management Systems));
– Management Consultancy (other than that involving new technology);
– Accounting and bookkeeping;
– Legal services;
– Environmental services (not involving new technology, e.g. environmental
law; and not based on old technology e.g. elementary waste disposal
services).
REFERENCES
AGARWAL, R. (1997), Survival of Firms over the Product Life Cycle, Southern Economic Journal, 3,571-584.
AGARWAL, R.(1998), Evolutionary Trends of Industry Variables, International Journal
of Industrial Organization, 16, 511-526.
AGARWAL, R., GORT, M. (1996), The Evolution of Markets and Entry, Exit and Survival of Firms, Review of Economics and Statistics, 78, 489-498.
AGARWAL, R., AUDRETSCH, D. B. (2001), Does entry size matter? the impact of the
life cycle and technology on firm survival, The Journal of Industrial Economics,
1,21-43.
AUDRETSCH D.B. (1991),New Firm Survival and the Technological Regime, Review of
Economics and Statistics, 73,441-450.
AUDRETSCH, D.B. (1995), Innovation and Industry Evolution, Cambridge, MIT Press .
AUDRETSCH, D.B., KEILBACH, M. C., LEHMAN, E.E. (2006), Entrepreneurship and
Economic Growth, Oxford University Press .
BARTELSMAN, E., SCARPETTA, S., SCHIVARDI, F. (2003),Comparative Analysis of
Firm Demographics and Survival: Micro-Level Evidence for the OECD Countries,
OECD Economics Department Working Papers, No. 348, OECD.
BARTELSMAN, E.,HALTIWANGER, J., SCARPETTA, S. (2004), Microeconomic Evidence of Creative Destruction in Industrial and eveloping countries, Tinbergen Institute Discussion Papers, TI 2004-114/3.
BOTTAZZI, G., SECCHI, A. (2004), Common Properties and Sectoral Specificities in
the Dynamics of US Manufacturing Companies, Review of Industrial Organization,
23, 217-32.
Firms’ survival and competitiveness: a case study in Tuscany
341
BOTTAZZI, G., CEFIS, E., DOSI, G., SECCHI, A. (2007), Invariances and Diversities
in the Evolution of Manufacturing Industries, Small Businness Economics, 29(1),
137-159.
CALIA, P., FILIPPUCCI, C. (2006), Exploring the Statistical Utilisation of Business Accounts Digital Data Base to Estimate Regional Economic Variables, Proceedings of
European Conference on Quality in Survey Statistics .
CAVES, R., PORTER, M.E. (1977), From Entry Barriers to Mobility Barriers, Quarterly
Journal of Economics, 91, 241-261.
CAVES, R.E. (1998), Industrial Organization and New Findings on the Turnover and
Mobility of Firms, Journal of Economic Literature, 36, 1947-1982.
DUNNE, T., ROBERTS, M.J., SAMUELSON, L. (1988), Patterns of Firm Entry and Exit
in the U.S. Manufacturing Industries, Rand Journal of Economics, 19, 495-515.
DUNNE, T., ROBERTS, M.J., SAMUELSON, L. (1989), The Growth and the Failure of
U.S. Manufacturing Plants, Quarterly Journal of Economics,104, 671-698.
EUROSTAT, (2005), European business - Facts and Figures.
EVANS, D.(1987), The Relationship between Firms Growth, Size and Age: Estimates
from 100 Manufacturing Industries, Journal of Industrial Economics, 35, 567-581.
GEWEKE, J., MARSHALL, R.C., ZARKIN, G.A. (1986), Mobility Indices in Continuous Time Markov Chains, Econometrica, 54(6), 1407-1423.
GEROSKI, P.A. (1995), What do we know about entry ?, International Journal of Industrial Organization, 13, 450-456.
GIBRAT, R. (1931), Les Inégalités Économiques. Applications : Aux Inégalités des
Richesses, à la Concentration des Entreprises, Aux Population des Villes, Aux
Statistiques des Familles, etc., d’une Loi Nouvelle : La Loi de l’Effet Proportionnel,
Pris : Librairie du Recueil Sirey.
HALL B.(1987), The Relationship Between Firm Size and Firm Growth in the U.S. Manufacturing Sector, Journal of Industrial Economics, 35, 583-606.
ISTAT, (2006), Rapporto Annuale, Roma.
KUMAR, S., RUSSEL, R. (2002), Technological Change, Technological Catch-up and
Capital Deepening: Relative Contributions to Growth and Convergence,American
Economic Review, 92, no.3, 527-548.
LANCASTER, T. (1990), The Analysis of Transition Data, New York: Cambridge University Press.
LISBON EUROPEAN COUNCIL, (2000)
http://www.europa.eu.int/comm/lisbon_strategy/index_en.html.
MATA, J., PORTUGAL, P. (1994), Life Duration of New Firms, Journal of Industrial
Economics, 27, 227-246.
MILES, L. (1995), Knowledge Intensive Business Services: users, carriers and sources
of innovation, Luxembourg, Commission of the European Communities.
342
Velucchi M., Viviani A.
f
g
p
HLINDER, J. (2002), Innovation in Knowledge Intensive Business Services. State of the
Art and Conceptualisations,Tema T Working Papers, 244.
OECD(2005), Science, technology and Industry Scoreboard, Paris, OECD.
OECD (2006), Science, technology and Industry Scoreboard, Paris, OECD.
OECD (2007), Science, technology and Industry Scoreboard, Paris, OECD.
OECD (2006), Science, technology and Industry Scoreboard, Paris, OECD.
PORTER, M.E. (1979), The structure within industries and companies performance, Review of Economics and Statistics, 61, 214-227.
SUTTON, J. (1997), Gibrat’s Legacy, Journal of Economic Literature, 35, 40-59.
SUTTON, J. (1998), Technology and market structure: Theory and History. Cambridge,
Mass., the MIT Press.
SOPRAVVIVENZA E COMPETITIVITÀ DELLE IMPRESE:
UN CASO DI STUDIO IN TOSCANA
Riassunto
Nei recenti studi d’impresa, le dinamiche di sopravvivenza sono considerate uno
degli elementi più importanti per lo sviluppo e la competitività del sistema economico di un
paese. Lo scopo di questo lavoro è di identificare la relazione tra alcune caratteristiche
delle imprese e la loro sopravvivenza nel mercato prendendo come caso di studio le imprese
operanti in Toscana. L’analisi viene svolta con un modello Cox semiparametrico sulle
imprese toscane (manifattura e servizi) usando un database con un livello di disaggregazione
settoriale a 6-digit (AIDA, Bureau Van Dijk) per il periodo 2000-2005. L’evidenza
empirica mostra che le imprese sono in media piccole, operano in settori tradizionali e con
tassi di sopravvivenza mediamente molto bassi. Le grandi imprese, sia nella manifattura
sia nei servizi, hanno tassi di sopravvivenza più elevati di quelle piccole. Le imprese dei
servizi mostrano in media tassi di sopravvivenza più elevati di quelle manifatturiere e i
corrispondenti tassi di rischio sono meno sensibili alla dimensione d’impresa. Infine,
l’analisi mostra in alcuni settori tradizionali la presenza di nicchie tecnologiche che
migliorano la posizione competitiva delle imprese toscane.
© Copyright 2026 Paperzz