00E/ IO/12079-48
ESL-63
TWO-DIMENSIONAL MODELING RESULTS OF TELLURIC-MAGNETOTELLURIC DATA
FROM THE TUSCARORA AREA, ELKO COUNTY, NEVADA
By
Claron E. Mackel prang
January, 1982
Earth Science Laboratory Di vision University of Utah Research Inst i tute 420 Chipet a Way, Suite 120 Sal t Lake Ci t y, Utah 84108 Prepared for Department of Energy
Division of Geot hermal Energy Under Contract Number DE -AC07-80ID12079 NOTI CE
This report was prepared to documen t work sponsored by the United States
Government.
Nei t her t he United Sta tes nor its agent, the United States
Department of Energy, nor any Federa l emp l oyees, nor any of their contractors,
subcontractors or their employees, makes any warranty, express or implied, or
assumes any legal l)iability or responsib il ity for t he accuracy, completeness,
or usefu l ness of any informa ti on, ap paratus, product or process disclosed, or
represents t hat its use would not infri nge pri vately owned rights.
NOTICE
Refere nce to a company or product name does not imply approval or
recommendation of the produc t by t he Uni versi ty of Ut ah Research Institute or
the U.S. Departmen t of Energy to t he excl usio n of others that may be suitable.
TABLE OF CONTE NTS
Page
ABSTRACT•••• •••••••••••••••••••••••••••••••••••••• •• ••••••••••••••••••• 1 INTRODUCT ION •••••••••••••••••••••••• •••••••• • ", •••••••••• , •••••••••••••3 GENERAL GEOLOGY•••••••••••••••••••••••••••••••••••••••• •• ••••••••••••••3 TELLURIC-MAGNETOTELLUR IC METHOD• •• •••••••••••••••••••••••••••••••••••••7 SURVEY PROCEDUR E•••••••••••••••••••••••••••••••••••••••••••••• •• •••••••9 MODELING PROCEDURE••••••••••••••••••••••••••••• •••• ••••••••••••••••••••9 INTERPRE TATION••••••••••••••••••••••••••••••••••••••••••• , .•• •••••• •••••12 CONCLUSIONS AND RECOMMENDATIONS•••••••••••••• , ••••••••••••••••••• •••• • 23 REFERENeE S••••••••••••••••••••••••••• •••• ••••••••••••• , ••••••••••••••• 25 FIGURE CAPTIONS Figure 1. Locat ion map and phys i ograph ic setti ng of the Tuscarora Area, Elko
County, Nevada.
Figure 2. General i zed geol ogic map of t he Tuscarora Area, Nevada.
Figure 3. 'Deta iled geol ogi c ma p of t he hot springs area, Tuscarora Area,
Nevada.
Figure 4. Geol og ic cross-sect io ns Tuscarora Area , Nevad a .
Figure 5. Telluric-magnetotel l uric data recQrd i ng setup, Tuscarora Area ,
Nevada.
Figure 6. Station B1 data, Tu scarora Area, Nevada.
Figure 7. Line 9 - Di po le-di po l e da t a, Tuscarora Project, Elko County,
Nevada.
Figure 8. Tuscarora Area, Nev ada, T-MT Prof i l e AA' Model 1.
Figure 9. Tuscarora
A re a ~
Nev ada, T-MT Profi l e AA' Model 2.
Fi gure 10. Line 16 - Dipol e-di pole da t a, Tusca rora Project, Elko County,
Nevada.
Figure 11. Tusc arora Area, Nevad a, T-MT Profil e CC' Model 1.
Fi gure 12. Tuscarora Area, Nevada, T-MT Prof i l e CC ' Model 2.
Fi gure 13. Tu sc arora Area, Nevada, T-MT Prof il e
ee'
Model 3.
ABSTRACT Two-dimensional modeling of T-MT data ta ken at the Tuscarora Geothermal
Exploration unit has shown that in this area the TM-Mode is insensitive in
resolving conductivi ty inhomogenei ti es below a depth of about 2 km. Computer
interpretive models showing a large conductive zone beneath the hot spring
area at a depth of 2 km are compared with models in which this conductive zone
is restricted to the near surfa ce. Acceptable fits between observed apparent
resistivity and cal cul at ed res i sti vi t y, within the accuracy of the field data,
have also been obtained with alternate models . This non-uniqueness is
inherent in the two-dimens i onal model s themselves and is further complicated
by the geologic setti ng where t hree- dimens io nal effects result from near
surface conductive bodies. Current channeling within the conductive sediments
of Independence Valley may al so li mit the ability to resolve postulated, deep
conductivity inhomogenei t ies .
Any interpretation of T-MT data, possib l y l eading to a deep exploration
drill test, should be eva l uated through a sensitivity analysis (i.e., several
alternate models). Three dimens ional effect s should also be evaluated to the
ext ent possible.
Finally, support i ng evi dence derived from alternate
exploration technique s shoul d be i ntegrated with T-MT interpretive
conclusions .
1
l
Wild Horse
N
i
.,'
,,
.
•
SCALE
5
o
I
o
FIGURE
.:.:
"
~
I
5
10 mi les
I
10 km
J. LOCATION MA P AN D PH YSIOGR APHIC SETTING OF THE TUSCARORA AREA.
ElKO COUNTY. NEVA DA
2
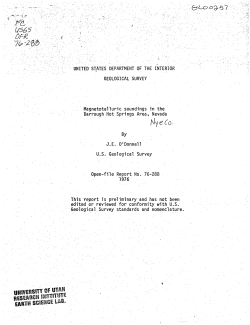
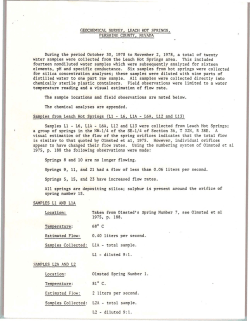
INTRODUCTION
The Tuscarora geothermal prospect is l ocated approximately 90 km north
northwest of Elko, Nevada at the northern end of Independence Valley (Figure
1). This valley i s a typica l Basin and Range structure and is approximately
10 km wide and 30 km long. The surface ma nifestations of a potential
geothermal resource are the thermal springs l ocall y known as Hot Sulphur
Springs.
A joint venture effort by Amax Exploration , Inc . of Denver, Earth Power
Production Company of Tulsa, and Supron Energy of Dallas, has undertaken
exploration of the prospect . Resul t s of t he
variou~
data sets were released
to the Earth Science Laboratory Di visi on/Un i versity of Utah Research Institute
under the Department of Energy Industry Coupled Program.
In addition, DOE
funded detailed geologic ma pping of t he prospect by ESL in support of the
explorat ion program has been pub l i shed (S i bbett, 1981).
This report presents resu lt s of two-dimensional modeling of the T-MT dat a
(TM-mode). The interpretat ion wa s enhanced by integrating the results of
other pertinent data set s such as dipole-dipol e res i si tivity .
GENERAL GEOLOGY
Independence Valley is bordered on the east by the Independence Range and
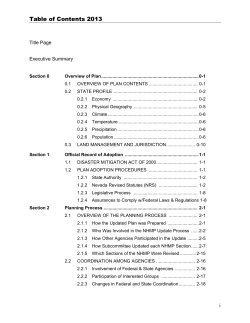
on the west by the Tuscarora Mountains (F igure 1) . Figure
. 2 is a generalized
geologi c map of the geothermal prospect located at t he northern end of
Independence Valley (after Sibbet t, 1981) . The Ordovician Valmy Group
quartzites and argilli t es are exposed in the nort hern Independence Mountains
and fo rm the eastern border of t he prospect area . Dacitic tuff-breccia (180
m-thick) overlie the Paleozoic rocks in the area of t he hot springs. The
R. 51 E .
J
Tts /
I
Pq
Tts
T.
42
N.
4 10 30'
_
"
-"' . . . -T.J
\ .-/
1 1
. . . . "'\ ts
Tt b
U'O " , , \ ,
I
I
Pq
/
",/\,.,J /
c;,
~......
I\\
'),
IT.. : \".
4 1° 30'
\ Tv i
Jvi
(
7,..i \
I
\.,
"
\
U
A
DI U
A'
•
M4
~
•
T.
\
41
N.
EXPLIIATIOI
QUA TERNARY
IQssl Sinter
•
Gal
IQa l! Alluvi um
I Qg I De forn:'led g ra ve l depOSits TERT I ARY IT vii Quartz la tite and dacite la v a f lows a nd plug s I T a I A n d esite a nd basal tic-and e site PALEOZIC r-;::;:-, lava f lows
.
[E9J Quartz i te and argi llite I..!!!.J Tu ffa ceous sedimen ts
~
.
.
,..,--"Contac t
~ Tuff breCCia , vent faCies
~"" Faul t. dashed wh E~re covered
Geothermal exploration hole
• MT base
• Tell uric si t e
JR 5 2 E.
.
o
FIGURE 2.
T.
41
",
N.
\
\
\
\
\
,
~
9
I
,
~
o
GENERALIZED GEOLOGIC MAP OF THE TUSCARORA AREA. NEVADA (AFTER SIB BE TT. 1981>
1MILE
I
1 KM.
41
0
25
,
tuff-breccia is exposed in its vent area three kilometers to the west. The
southwest border of the st udy area i s covered by Tertiary andesite and
basaltic-andesite lava flows.
Sibbett (1981) reports these flows and the
tuff-breccia have been dated (K-Ar) at 38.8 ± 1.3 m.y.
Overlying the tuff
breccia is approximately 320 m of tuffaceous sed iments containing a rhyolite
ash dat ed at 35.2 ± 1 m.y. (Schi ll ing, 1965).
These sediments have been
partially covered to the north by Tertiary dacite and quartz-1atite lava flows
dated at 13.6 ± 0.7 m.y. and 16.7 ± 1. 1. m.y. respectively (Sibbett, 1981).
The area is structural ly compl ex. The Tertiary rocks have been deformed
by north- and northwest-trending normal fault s.
These faults bound a graben
between the Independence Mountains on the east and a small horst on the west
(Figure 2).
This horst extends from t he Tuscarora Mountains northward to the
Bull Run Mountains and conta i ns the ve nt area for the tuff-breccia.
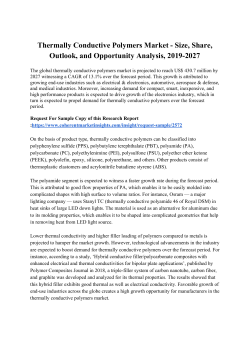
Another major structure t rends north to nort h-northeast along Hot
Creek . This structure, shown in greater detai l in Figure 3, has controlled
emplacement of several basa l tic-andes i te pl ugs and the surface expression of
the geothermal system (Sibbett, 1981 ) . Thi s fault and the associated thermal
spring along Hot Creek are central ly located within the large graben.
Numerous hot springs and an ext ens i ve opali ne sinter deposit roughly 330
mwide, 1000 m long and 35 m high are present.
No currently active springs
issue from this sinter deposi t but t hree springs do occur in the alluvium at
the west edge of the mound.
These spr i ngs are currently depositing silica.
Most of the spring activity occurs i n a small area 400 m upstream from the
large sinter mound.
The springs form a roughly triangular pattern and have
temperatures of 55-95° C. The hotter springs are depositing both siliceous
and calcareous sinter, sulfur, and subl imates.
5
Several springs are boiling
N
Tts
®66-S
Tvi
,
000 I
~-,
, .... - ... ~,
~
alluvium
~m
siliceous sinter
l Oss )
§111
@S9U
"" ",
/
I
I Tts
I
I ,.~ . .
Tal
I
I
'
travertine
silica - cemented alluvium
10001 older alluvium
10Toi grovel
Tts
Tts
'"
I
I
I
--- ' -
I
6:/ QTg
\
~TiPj
bosoltic - andesite intrusion
andesite lava flows
tuffaceous sediments
thermo I sprinos
argillic and quartz
sericite alteration
,. .. -_#* I
docite-Iatite lava flows
~
~
I
I
I
I
--,
[2;]
,, \
SCALE
o
I
1000
2000n
!~I~--~~~I~~~--~
i ~'
<r-, o
500m
I
FIGU RE 3, DEJA IL ED GE OLOGY OF THE HOT SP RING S AR EA . TUSCARORA AREA. NEVADA
(AFT ER SIBBE TT . 1981)
6
NV/T-Ol2
and one small steam vent occurs. The Na/K/Ca geothermometer indicates a
possible reservoir temperature of 181 0 t o 228 0 C (P ilkington et. al., 1980).
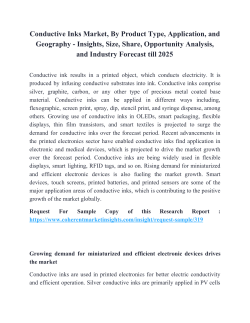
Two geologic sect ions, AA' and CC' , have been constructed (Sibbett, 1981)
which trend east-west and northwest-southeast, respectively, across the hot
spring area. These i nterpretative secti ons are shown in Figure 4. They
closely parallel t he T-MT profiles AA' and CC ' shown in plan view on Figure 2.
An intrusive is inferred beneath the horst on the west end of section AA'
because the vent area for the t uff-breccia is upli fted relative to the rest of
the horst, and the bounding faults, whe re well
expo~ed,
are convex upward.
This and ma ssive quartz veins withi n the vent and along some of the bounding
faults all suggest an int ru si on at depth (Si bbett, 1981).
TELLURIC-MAGNETOTELLURIC METHOD
The telluric-magnet otelluri c (T-MT) method is described by Hennance and
Thayer (1975).
It combines magnetotelluric measurements at a few base sites
with telluric measurements at a number of remote sites. This combination
minimizes t he time required, and thereby the cost, of completing a given
survey .
Crucial to the T-MT met hod is the implicit assumption of spatial
uniformity of the horizonta l magnet ic f i eld . Stodt et al. (1981), however, in
their computer model studies have shown that t his assumption is not always
valid in t he vicini ty of two-dimensiona l (2-D) and t hree-dimensional (3-D)
resi stivity inhomogeneiti es. They show, for a 2-D case, that the TE-mode
horizontal magnetic field can vary by as much as a factor of three over a
distance of five kilometers.
For a three-d imensional (3-D) case, spatial
variation of the horizonta l magnet ic f i eld i s not as great, but they conclude
7
w
A' A
~6 00 0
...,
...,
": 4000
Tt b
To
Tts
>
~
),,;"
,,1 ~ -'''''?_
,~_r.
Pq /
..., 2000
Tt b
-i ) /t --'!,?
1 ~ ,"7
"
T- 66- 6
,
'
i_?_
Tt~Jj.l
Tts
(,\ --- - -
__ ___ - -
\\'! ,-UJ>:.:: ------- --_ ---t;::'~ 1j/_ ,
-"'1
Pq
I
Int rusive? ,
,
oI '
--------
Pq
__ __
,
Pis
1 ,,'. I - "
q
J''t:\~'I-a,r' ,'
\.. -
~/ ;rtb/.J
'J:-,,(- -- ,--"!:--,'/Tia
,- ----- - \ -- - - - -..,7 Pq --'I
,
'I :
L ~'"
.r
Tt s
:rt b
-- f ---- -r/.'~ II~
,Tts .. _;{IITts~ 1
In
--,1-----,
0 01
______ _ ____
C4
ell:
...,
...,
~
.Pq
1000
I
I0
c
.
~
...,
...,
>
Pq
Pis
E
3000
c' NW
SE
8000
~6 000
...,
UoI
00
": 4000
>
UoI
UoI
2000
3000
;r t s
-
-- - ---
"!"!~-.\...
Tt s__ -, __I.!~--- I \ /
"\ '"-7----==.,-_
\
I.J
\~ ---7-'
, --' ) T t "
b
Pq '1/
\\
~\.'t
\:
~L --_J'I_
_ T ts
' I -----____
~.~Ttb
,'
"
\ Pq
Pq
:
I
I ---:
\ Pq,'
" ,
T io
-
_ - _ _ _-~-- _______ - . . ,
\- -~- - - ---::.::..,.._ ~ -- -- _
0
I
Ttb
-, \
-------9--------- -, T t s?
•
Pq
\ ~\
/1.1
:~ _ 1 _ _ 1 _ _ _ _\ '
Tts
, 'Ii
. "
. Pi s
•
0
o
4000
o,
,
1
Pi s
,
Clot
0 01
~
1---?- -,
"
----____
1000
::
~
...,
~
•
::
_
...,
,
0
8000 FEET
,
2 km
FIGURE 4. GEO LOG IC CROS S SECT IONS OF THE TUSCARORA AREA. NEVADA (AFTER SIB BETT. 19 81> --- - ~
...
that the variation can contribute significantly to impedance magnitude and
phase over shallow inhomogeni t ies at highe r frequencies.
SURVEY PROCED URE
The T-MT survey was conducted by Terraphysics (Mazzella, 1979) . Rotated
tensor data were obtai ned at 11 b.ase stat i ons and 22 remote si tes (Fi gure
2). Typical distances between base and remote sites are one to two
kilometers.
Telluric dipoles were 200 meters l ong and were oriented north
south and east-west . Figure 5 shows the record i ng setup for both base and
remote sites . Both t he magnet ic and el ectric fi eld da t a were processed using
a technique described by Gambe l et al . (1979) . Uti lizing the estimated
spectral powers, the impedance, pri nciple ax i s di rec t ion, rotated apparent
resistivity, skewness , impedance phase, tipper and tipper strike direction
were calculated. These data were the n pl otted as a function of frequency from
10 to 0.01 Hz.
Figure 6 shows the data for Stat ion Bl.
Note that the data
are highly variable, by a fac t or of 2 i n pl aces, in the frequency range of 1.0
to 0.1 Hz.
Thi s implies anisotropy is present and has a strong influence on
the observed data.
MODEL ING PROCEDURE
Only a cursory examinat ion of th e T-MT data and geologic setting is
needed to see that t he Tuscarora geot hermal prospect is at least two
dimensional and more likely three-d imensional . Several authors (Wannamaker et
al., 1980; Stodt et al., 1981; Ti ng and Hohmann, 1981) have suggested modeling
•
selected T-MT and MT field data f rom a 3-D area showing preferred structural
trends with a 2-D TM algorithm.
This approac h generally gives more accurate
conductivity cross sections than those obtained with a TE algorithm. A two
9
3 component Superconducting
Magnetometer
Receivers
Hx, Hy , Hz
Ex2
EX3
EY3
Ey2
' 12 channel
ehart
Recorders
SITE 1
BASE
24 channel
Filters and
Amp li f ie rs
LSI-ll
Tape
Recorder
Minicomputer
Printer, eRT
MAGNETOT ELLURIC SE T UP
F ilters,
Am plifeiers,
yeO 's
Transmi t ter
Filters,
Amplifiers,
yeo's
Transmitter
SITE 2
REMOTE
SITE 3
REMOTE
TELLURIC SE T UP
FIGURE 5. TELLURIC -M A GNE TOTE LLUR IC DATA RECORDING SETUP. TUSCARORA AREA.
NEVADA ( FROM "MAZZELLA, 1979)
10
10.0
f{Hz)
1.0
0.1
001
100 0~--~~~~~~----~~~~~~------~~~~~'
o
o
o
o
0
0
.S 0
",e""0
.,.
o
.
\~
~'
8
0
0
•
•
0
I
•• ••
o
:
i
..
o
o
0
••
•
o
•
• •
0
• •
•
'b+ •
•
•• •
1
~ 60
C!) _
S
Zoo
S
X X X X SX sX
<~
~
Z ~
S
OC!)
I
S
- ~
~ O
iI
X§
S § X
I
~
i
§
S ~
X
S
X X
[:S
O
~-90
!o:~.
! 06~
~
0
•
10 .0
•I • I •I I•I I•II••I • •
i
.I!I
1'1
P" '1
•I
•
I
• I
I I III
•
•
•I I•I I•11+
•
f (Hz)
..
• • • I •I I I II ~
•
0.1
FIGljR E 6. STATION 81 DA TA. TUSC AROR A AR EA. NEVADA
11 ·1 • 1·1
I!I
I!I~
0.01
dimensi onal finite el ement prog ram developed at t he University of Utah (Rijo,
1977) ha s been modified and consoli dated into a single program to handle the
2-D magn etotelluri c TE- and TM-mode pr obl ems (Stodt, 1978). This program was
used to model the T-MT (TM- mode) dat a.
T-MT stations al ig ned along general east-west and northwest-southeast
directions were used to construct t wo profil es l abeled AA' and CC'
respectively.
These profi l es i ntersect one another in close proximity to Hot
Sulphur Springs.
Rotat ed apparent resi st i viti es determined at each station
al ong the profiles at 4 freq uenci es (10 .0 - 0.01 Hz ) , a decade apart, were
compiled t o form observed data pseudosecti ons. A finite element mesh was then
designed for each profile.
Int erpreted intr ins ic resistivity values, closely
approxi mat ing those obt ai ned from modeli ng 610 m di pole-dipole data taken over
the same general profile, were t hen assi gned to t he MT model. MT models
showing acceptable fit s t o the observed dat a, t hr ough an iterative process,
were t hen obtained as shown i n Fi gures 8 through 12 .
INTERPRETATI ON
Figure 7 shows a cal culated di po l e-dipol e model (Mackelprang, 1981),
determined t o be a good fi t t o t he obse rved data and which closely parallels
T-MT profile AA '. The i nterpreted resi sti vi ti es shown in the upper 1 km of T
MT model AA' (Figure 8 ) have been genera li zed from this dipole-dipole model.
Both the 2-D TM-mode and di pol e-di po le model s for profile AA' show conductive
near-surface material in the vi ci nity of the hot springs.
Hot Creek and the
attendant st ruct ure, from wh ich the ho t spr ings issue, occur between T-MT
stations M1 and B1 and dipol e-di pole stati ons C2 and C3, spread 2. This low
resistivi ty « 10 ohm-met er) is thou ght to be partially caused by hot fluids
within shallow vol canic aquifers.
The more res isti ve (100-500 n m) material
12 COMPU TE D M O DEL
o
H o t C ,ee~
WEST
Cl
1000 '
2000'
C~C3
D H 5 1- 9
SPD 2
SPD 1
C4£S C6 C7
C2 C3 C4 CS C6 C7
EAST 0
150
. 20
1000
5
4000'
lCXXY
2000'
4000'
6000'
6000'
o
CALCULAT ED RESISTIVITY <ohm-meters)
SPD3
W EST
.......
I
W
SPD2
C l C 2 C3 C4 C 5 C6 C 7
~
I
I I ",
~
I
'&~ ~
,&'& ~d) ~
I
?s"~"'0 ~6;c 3~8" 52 '-38~)/ \
10......u::: 13
~
14V, ('f4~34
3~
2
14
9-9)
2 2 0 '1 2
1 /
t3Q,.
9
4~~
~~
~
0
I
8,~6,
59-57~ '~
8 ~9\ 1(~ 38~ 3
3
~
\0,/ 38
37. 43
"l7\ { I ~
2/2.7 51 58 /fi'jo......."&
c} '"b
I
cr '
I .
I
<6
~
I
~O
~
5
0
o'bO
~~ ~
I
'~i \~~
236\A~
I
§~
EA ST
#
~~
I
C)
(,~~e~J.: : . 399 ~6'P;'<b
~~l"'i5 57 \1 ~~2"\ 47d('W~3~2
\ ~~ '::f:,~~\~ ~
tit:>
0
O BSERVED A PPARENT RESISTIVITY <ohm-met e rs)
WEST
I
SPD3
I
Cl C2 C3 C4 C5 C6 C7
1
I
I
I
1
1
I
SPD2
I
I
Cl C2 C3 C4 C5 C6 C7
1
1
I
1
I
I
I
I
I
i
SPD 7
Cl C2 C3 C4 C5 C6 C7
I
I
tp
I
I
I
I
EAST
I
•. ~10
$l~2 29 2(~SI
2fJJll~ ~~.. JlJ
'S-~
. .[~/~
2~4~ !s
- 3ttsp,&'
/~ t12~''\\,~\\'\f..'&''
~ :r (6)X~~~ ~
7~~~\~~8t
;(4) 131 \"l27'(491~2 67~8~v
4
1O~~6~j
2 ~~5Jl-V:~~3
~6
~i;6-"('"",/2
t'/7~
802 6'fJ-59S-J!:
6 ~~
9
53 59 SO ~'
4~
/19
3
9
30 1
6 1
'4
5
2
/" 9-:::/25
4
'"\6~~a
27. 54s......D6/3s4
h"~7-37;;/";j(£\G7
1~3
~~''''''''6-6
J
~::/2¢.Y~~'
106
7,~
4~1./377
'0 ~~
~ ~ -. • ~ "6 ~ ~ . ':tb
'Oq)g t2~"'28::: "t' ~ \ CO ~ ~~()(T
b
LINE 9 - D IPOLE-DIPO LE DATA
TUSCARORA PROJECT ELKO COUNTY, NEVADA FIGURE 7
I
1220 METERS
(218 4'}2/i62Lsoo
3[..,4 ( 134~24Y360 5Q9 7~
~ ' 24 33 33' 86 12 363 26 ~ 1..778/ 408 '669
30-..26 ( 1 '81
C'J,~
~d ' (~\9'~G;'\7~
.)2090~\~ \J..~ .\.7,. . 'l<2 l~\'"
5
C l C2 C3 C4 C5 C 6 C 7
~7V4~? !y~~
~;;1.~7
5 .......
6
..,'
I
0
SPD 7
C l C 2 C 3 C4 C S C6 C 7
4 0 00 FE ET
I
FI GURE 8
MODEL 1
TUSCARORA AREA, NEVADA T-MT PROFILE AA' HOT SPRINGS
r---"I
82 M2
0.15
0.5
1.0
M1 81 M10 810
10
10
15
5
35
50
2.0
100
3.0
.....
2
4.0
...:z:a.
5.0
20
500
~
w
c
~5+-------------~
50
75
10.0
o
I
1
I
2
3
4
I
I
I
1.1
5 KM
I
£
occ uring at dept h between stations M8 and B2 coincides with the horst and vent
area for the Tert iary tuff-brecc ia .
The observed resi st iv ity data at stati on Bl are poorly matched at the
lower frequencies.
This is attri buted to l ateral and 3-D effects arising from
the larger intrusive plug occurring south of station Bl.
A modificat ion to
the geometry of the 500 n m body beneath t his station is required to fit the
observed data.
The conductive zone (1 n m), wh ich i s shown on Figure 8 to have a large
de pth extent begi nning wi th in about 2 km of the surface beneath the hot spring
area (station Ml), is of particula r i nterest.
It is tempting to infer that
this conductive zone i s the signature of a geothermal reservoir.
Figure 9
shows another calcula ted MT model for profi l e AA'. The primary divergence
from Figure 8 i s the modificat ion i n t he geometry of the conductive (1 n m)
body. The intrinsi c res ist ivi t y wa s increased by a factor of 20, yet the
overall fit to the observed data is essenti all y equal to that for the model
with the 1 n m conductor. Al t hough nume rical differences occur, they are, for
the most part, well within t he ac curacy of the field data.
It is understood t ha t models for profile AA' are non-unique, and
refinements can be made for a better overall fit to the observed data.
Profile AA ' is also not two-dimens io nal (F igure 2). The presence of
Independence Valley with its conducti ve volcanic sediments lying immediately
sout h of t he profile cau ses additional concern. Theoretical MT model studies
demo nstrating the applicability of 2-D interpret ation approaches in a geologic
setting similar t o Tuscarora are not availab l e. The veracity of models for
profile AA' is therefore uncerta in .
15
FI GURE 9
MODEL 2
TUSCARORA AREA, NEVADA T-MT PROFILE AA' W
AS
0.15
0 .5
1.0
20
15
E
82 M2
MS
10
50
2.0
3.0
....
::E
-
:r:
4.0
500
100
!III:
t-
5.0
Il.
W
c
50
7.5
75
20
10.0
10.0
'" 1.0
:r:
';: 0.1
0.01
10.0
'" 1.0
:r:
';: 0. 1
0.01
16 Figure 10 shows the di pol e-dipol e model t hat roughly parallels T-MT
profile CC I
•
Hot Creek is cros sed by spread 1 between stations C4 and C5.
The resist ivity section from this dipole-dipole model was again generalized
and used for the upper 1 km on the MT profil e.
Figure 11 shows the MT model
fit to t he observed TM-mode data along profile CC
I
•
This profile extends into
Independence Valley sout h of the hot spri ngs. The Hot Creek structure is
located between sta ti ons Ml and MID . The conduc ti ve (5 0 m) material at the
surface is apparently all uvium and volcani c sediments, possibly containing
clay, which may be saturated wit h thermal waters. The slightly more resistive
(10-25 0 m) materia l at the surface on the southeast end of the profile is
perhaps best explained by rel ati vel y dry sediments above the water table. The
resi stive (500 0 m) ma t eria l at dept h on t he southeast end of the profile is
tho ug ht to be a combinat ion of Pal eozoic sedi ments beneath Independence Valley
and the intrus ion near st at ion BI.
The 50 - 500 0 m material at depth on the
nort hwest end of the pr ofile is thought to represent Tertiary volcanics and
Pa leozoi c sediments.
The most si gni ficant feature shown by this model is again the very
conductive zone (10 m) at de pth in the central portion of the profile which
rises to within about 2 km of the surface between stations Ml and MID. This
zone is roughly cent ered on the Hot Creek f ault and appears to extend downward
for a considerab le depth then l at erall y into Independence Valley and the
buried Paleozoics (?).
It is aga in tempting to interpret this zone as an
indication of the geothermal reservoir. T-MT profile
eel appears more nearly
two-dimensional than profile AAI, and therefore a sensitivity test has been
performed upon the MT model shown as Figu re 11 . Figure 12 shows the results
of thi s alternate model which has a l ess conductive (50 0 m) body beneath the
hot spring area.
Note the strong simil ari ty between the computed resistivity
17 COM PUTED MODEL
o
SP02
N SOoW
1000'
20 00'
C2 C3 C4 C 5 C 6 C7 C8 C9
~
100 50
4000'
1'50
75
2
6000'
6000'
SPOT
I
I
I
~
I
I
I
0-
'6-- 6 ~ 5
I
US
~,.o
~
I
I
I
I
~O
.
~~~ E - 23-21_ 24
11
5 '<.... 4>' 5
1
29 (16 '10-10 13.--tl' \.5
S
2\ 16 14 )0"""'--'9 ')1
' 6...._ 5
~o
1220 ME TERS
I
I
I
I
I
d>-o;:;"~
5
~ R4"'4
12
7
5
0
Cl C2 C3 C4 C5 C 6 C7 C8 C9 SSoo E
I
a:
'~11 {\ 7 '
lS'Y21 ~o' 7
').0
I
4 000 FEET
SP0 2 N SooW Cl C2 C3 C4 C5 C6 C 7
I
o
I
CALC ULATED RESISTIVITY (ohm-meters)
':0
0
1000'
2000'
ro
40 00~'~r---------------~----~
SSoo E
23
22
&.
-0
26 ~_17_14-14-14-16-1 2~1 22 9~ 1 11 _ 1~ 12 20 23
5
~ ~/'7\ 10 1 \ 22 25 1"'- ' 3- 7'4,., 6. . 8~57· 11 ~ 1 15 '\t4 J7
-0
-1:1-
.".
t)
~ ~
OBSERVED APPARENT RESISTI V ITY ( ohm-meters)
NSOOW
I
I
SPOT
SP02
Cl C2 C3 C4 CS C6 C7
I
I
I
I
~.
'O~~""'b sJ6
'5_13 ~.. )9\ "
I
",.. . - 4
I
I
...,Ao-
I
d>"O
I
Cl C2 C3 C4 CS C6 C7 C8 C9 SSooE
I
I
I
~~~
I
I
~
0
I
I
I
I
0
~_3~~-:U::1~ 3V~ 21 26 ~ ~-6
16 _13~ 16
25\
'6 '-9.
2O-'2O-:>l'~118~\ ~,\-~""12
~~\.' ~~8 :~
;O(~\~10/8r~
29
18
28
1C>-""'" 14
\1~15",
~o
~
8
15
13
12' \
8,
1,V
,0
4
~
.6,
6'!)
3
3 ~/7/
0-.
~
12
.c4~
ti
0-
6>9/
11
..is- ~~
'\
qju
LINE 16 - DIPOLE-DIPOLE DATA
TUSCARORA PROJECT
ELKO COUNTY, NEVADA
FIGURE 10 3l,..
14
21 40 1.v. 25 /19\
~
f
FI GURE 11
MODEL 1 TUSCARORA AREA, NEVADA T-MT PROFILE CC' NW
A7
0.1
0.5
1.0
HOT SPRINGS
5
SE
r--"'--'"\ M1 81 A1M10ASa BSa MSa
87
10
25
83
M3
5
25
25
5
2.0
3.0
.....
4.0
-:z::
5.0
2
~
to-
500
G.
W
Q
10
7.5
10.0,-+-------1
CALCULATED RESISTIVITY (Q-m)
o
2
I
I
19
3
I
4
I
5 KM
I
values for the two models (Fi gures 11 and 12). Both figures show acceptable
fit s to the observed data. Thi s mode l (Fi gure 12) was further revised to
limit t he depth extent of the 50 n m body to 1.5 kilometers. This depth and
moderate resisti vi ty agree well wi t h resu 'lts of a resistivity log from a test
hole (66-5) drilled 300 meters no rt h of stati on MI. The only significant
change resulting from this modi fi cation as shown by Figure 13 occurred at 0.01
Hz wi t h stations Bl , AI , and MID . Cal cu l at ed resistivities for these stations
at this frequen cy actually agree more cl osely with the observed data than do
t he calculations using the prev ious t wo models . No conductive body at great
depths is therefore required t o fit the observed data.
20 FIGUR E12
MODEL 2
TUSCARORA AREA, NEVADA T-MT PROFILE ee' MW
A7
HOT SPRINGS
r---"---'\ SE
M1 B1 Ai M10 ASa Baa MSa
B7
0.1
0.5
1.0
B3
M3
5
5
2.0
3.0
-...:z::
:I
4.0
500
~
5.0
10
500
A.
W
0
7.5
1 0.01-+-----~'."'"'-'."'"'-:A...-------------'---+
CALCULATED RESISTIV I TY (Q-m)
o
2
I
I
21 3
4
I
I
5 KM
I
FIG URE 13
MODEL 3
TUSCARORA AREA, NEVADA T-MT PROFILE CC' NW
A7
HO T SPRINGS
~
B7
Mi B1 Ai Mi0 ASa
1
0.1
0.5
1.01
1 1
10
II
I
B
aa MSa
I
I
5
SE
M3
B3
I
.... 25
50
25'
5
I
2.0
~
rrr
3.0
i
4.01
:z:
a.
w
t
-
500
~
5.0 1-
500
10
-
Q
r-
7.5,
10.0
10.0 ~ 20
N 1.0
~
.... 0 .1
~
/
5
65~ 27,:- 76 _ _ 10..2.-914- 1 5 -13-13
8'--.
~
32
=~
~
4
~
2~~ . J
'-.
_____
"SI"-L.2J.2.Y 57/
8~
65 45 4552
ll0
12
33
1\ 24
'--16
fiQ7;)
0.01~~0\~~64---:3 C,:;:~? ~5. .b:S'
/13
/8
J..
____
'<
30
/'5
OBSERV ED APPAR E N T RESISTIVITY (.o.-m)
'-1 3::::::---:-8~10
10 .0
N 1.0
6'~ 20
79
~O.1
175
0.0 1
89
124 65/ '
611 21 21
2O®
10
18
........3 /'7,\19 21 21
8
24 ;331
~23
~ ,,0
7
9
15
26~
21 /1S
C ALCULATED RESIST I VITY (.o. -m)
o
1
2
:3
4
1
I
I
I
I
22 5 KM
1
5
CONCLUSIONS AND RECOMMENDATIONS
The heat source and reservoir for the t hermal springs occurring on the
Tuscarora Geothermal Exploration uni t have been an elusive target. Geologic
mapping has shown the prospect t o be struct urally complex.
Several
geophysical techni ques have been appl ied - each offering tidbits of
information.
This report has presented results of a telluric-magnetotelluric
survey modeled with a computer us i ng a two-d imensional algorithm. The
geometry of the near-surface conduct ive zones shown by the MT models was
guided by two-dimensional di pole-d i pol e resistivity model results which had
previously shown similar zones.
The results of this T-MT model ing are not conclusive.
The sensitivity of
the TM-mode, in this geologic environment, appears to be very low below depths
of about 2 km.
A conductive zone may exist beneath the hot springs at a depth
of approximately 2 km, but t he observed resistivity data can be explained
equally well by the conductive zones lyi ng wi thin 1 km of the surface. This
lack of resolution is attributed to ambi gui ty inherent in the geometry of the
2-D models themselves and is fur t her com plicated by a complex geologic
setting.
Three-dimensiona l effects combined with
t~ose
resulting from near
surface conductive bodies appear to dominat e any interpretive models drawn
from the data.
The T-MT method with its potent i al for acquiring deep electrical
soundings has become increasi ngl y popu lar with geothermal contractors and
industry in recent years. Geot hermal environments in the Basin and Range
Province have, at best, geometries t hat are t wo-dimensional and more likely
three-dimensional. The 1-0 and 2-D i nterpretation algorithms currently
applied must therefore be used wit h caut ion.
23 No general 3-D interpretative
algo rithm s are currently avai l ab l e.
Un ti l prac t ical 3-D interpretative aids
are devel oped, the T-MT method sho ul d be employed primarily where the geol ogy
is likely 1-0 or 2-D and the resu lt s can be reasonably interpreted .
Sens it i vi t y analysis of any inter pre ti ve model is of utmost importance and
should no t be omitted.
Support i ng evi dence from alternate explorat ion
tec hni ques should also be eva l ua t ed be for e deep, expensive, drill tests are
undertaken on geothermal reserv oirs postulat ed sol ely from T-MT surveys using
present interpretative a ids.
24 REFERENCES Berkman, F. E., 1981, The Tuscarora, Nevada geothermal prospect:
case history (abs): Geophysics, v. 46, no . 4, p. 455-456.
A continuing
Gambel, T. D., Goubau, W. M. , and Clarke, J., 1979, Magnetotellurics with a
remote reference. Geophysics, vol . 44 , no. 1, pp. 53-68.
Hermance, J. F., and Thayer, R. E., 1975, The t ell uric-magnetotelluric
method: Geophysics, v. 40, p. 664-668.
Mackelprang, C. E., 1981 , Interpretati on of the dipole-dipole electrical
resistivity survey, Tuscarora Geothermal Area, Elko County, Nevada:
Univ. of Utah Research Inst ./Earth Sc ience Lab Rept. (in preparation.)
Mazzella, A., 1979 , Tel lur ic-magnetotell uric survey at Tuscarora Prospect,
Elko County , Nevada: Terraphysics Rept. Prepared for AMAX Exploration,
Inc., Geothermal Group.
Pilki ngton, H. D., Lange , A. L., and Berkman, F. E. , 1980, Geothermal
exploration at the Tu scaror a Prospect in Elko County, Nevada: Geothermal
Resources Council, Transactions v. 4, p., 233-236.
Rijo, L., 1977 , Modeling of electric and electromagnetic data:
Univ. of Utah, Dept. of Geology and Geophysics, 242 p.
Ph.D. Thesis,
Schilling, J. H., 1965 , Isotropi c age dete rminations of Nevada rocks:
Bureau of Mines, Re port 10 , 79 p.
Nevada
Sibbett, B. S. , 1981, Geology of the Tuscarora Geot hermal Prospect, Elko
County, Nevada: Earth Science Laborato ry Division/Univ. of Utah Research
Institute Rept., 21 p.
Stodt, J.A ., 1978, Documentation of a finit e el ement program for solution of
geophysical problems governed by t he inhomogeneous 2-D scalar Helmholtz
equation: Univ . of Utah, Dept. of Geology and Geophysics, NSF Rept.,
Contract AER76-1 1155, 66 p.
Stodt, J. A. , Hohmann, G. W., and Ting, S. C., 1981, The Telluric
magnetotelluri c met hod i n two- and t hre e-d imens i onal Environments:
Geophysics, vol. 46, no. 8, p. 1137-1147.
Ting, S. C., and Hohmann, G. W., 1981, Integral equation modeling of three
di mensional magnetotel l uric response: Geophysics, v. 46, p. 182-197.
Wannamaker, P., Ward, S. H., Hohmann , G. W., and Sill, W. R., 1978,
Magnetotelluric model s of the Roosevel t. ~ot Springs Thermal Area, Utah:
Univ . of Utah , Dept. of Geology and Geophysi cs, Topical Report, Contract
No. DE-AC07-79ET27002.
25
© Copyright 2026 Paperzz