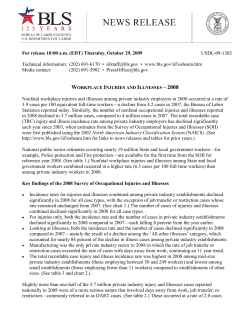
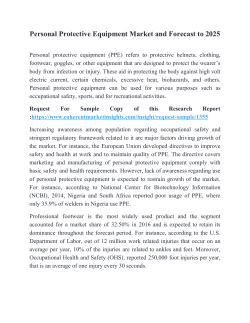
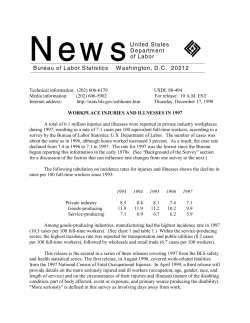
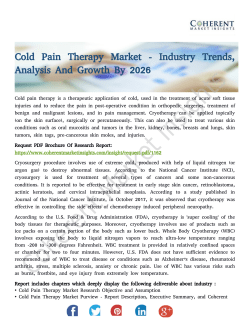
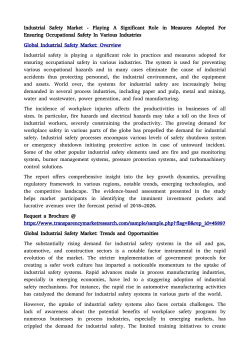
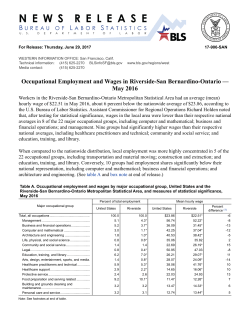
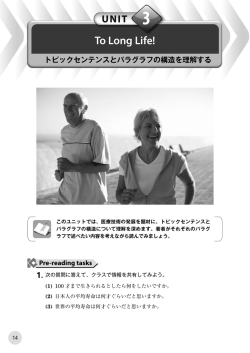
For release 10:00 a.m. (EST) Thursday, November 10, 2016 USDL-16-2130 Technical information: (202) 691-6170 • [email protected] • www.bls.gov/iif/oshcdnew.htm Media contact: (202) 691-5902 • [email protected] NONFATAL OCCUPATIONAL INJURIES AND ILLNESSES REQUIRING DAYS AWAY FROM WORK, 2015 The overall incidence rate of nonfatal occupational injury and illness cases requiring days away from work to recuperate was 104.0 cases per 10,000 full-time workers in 2015, down from 107.1 cases in 2014, the U.S. Bureau of Labor Statistics reported today. In 2015, there were 1,153,490 days-away-from-work cases in private industry, state government, and local government—essentially unchanged from the number of cases reported in 2014. The median days away from work to recuperate—a key measure of severity of injuries and illnesses—was 8 days in 2015, 1 day fewer than reported in 2014. (See table 1.) Private sector occupations In the private sector, the incidence rate per 10,000 full-time workers was 93.9 cases in 2015, down from 97.8 cases in 2014. (See table 1.) Occupations that had among the highest number of cases in 2015 resulting in days away from work included heavy and tractor-trailer truck drivers; laborers and freight, stock, and material movers; and nursing assistants. (See table 3.) The incidence rates decreased for heavy and tractor-trailer truck drivers (298.7 cases per 10,000 fulltime workers in 2015, down from 355.4) and nursing assistants (327.8 in 2015, down from 353.6). Private sector laborers and freight, stock, and material movers had 56,550 days-away-from-work cases in 2015, an increase from 2014 levels. However, the incidence rate of 289.4 cases was not significantly different from the rate reported in 2014 (284.5 cases). (See table 3 and chart A). Chart A. Incidence rates for occupational injuries and illnesses with days away from work by selected occupations, 2011‐15 700 600 Incidence rate per 10,000 full‐time workers 500 400 300 200 100 0 Heavy and tractor‐ Laborers and Nursing assistants Correctional Police and sheriff's Firefighters (local trailer truck drivers freight, stock, and (private industry) officers and jailers patrol officers gov.) (private industry) material movers (state gov.) (local gov.) (private industry) 2011 2012 2013 2014 Janitors and cleaners (local gov.) 2015 Note: These occupations had at least 0.1 percent of employment and among the highest case counts in their respective ownership classes. Source: U.S. Bureau of Labor Statistics State and local government occupations The incidence rates for nonfatal occupational injuries and illnesses with days away from work for state (149.2 cases per 10,000 full-time workers) and local government (177.5) were essentially unchanged in 2015. (See table 1.) In state or local government, there were five occupations with at least 10,000 cases: police and sheriff’s patrol officers; firefighters; janitors and cleaners; and teacher assistants in local government and correctional officers and jailers in state government. (See table 3.) The incidence rate of injuries and illnesses to janitors and cleaners in local government increased to 657.4 cases per 10,000 full-time workers in 2015 from 434.0 cases in 2014. (See chart A.) The incidence rate of injuries and illnesses to firefighters in local government decreased to 422.2 cases per 10,000 full-time workers in 2015 from a rate of 495.2 in 2014. (See chart A.) Musculoskeletal disorders In 2015, musculoskeletal disorders (MSDs), such as sprains or strains resulting from overexertion in lifting, accounted for 31 percent (356,910 cases) of the total cases for all workers. Of the total MSD cases, 80 percent occurred to private industry workers. This resulted in an incidence rate of 29.8 cases per 10,000 full-time workers in 2015, down from 31.9 cases in 2014. Private industry workers who sustained an MSD required a median of 12 days (down from 13 days in 2014) to recuperate before returning to work in 2015, compared to 8 days for all days-away-from-work cases. (See chart B and table 9.) Laborers and freight, stock, and material movers (20,990), nursing assistants (16,860), and heavy and tractor-trailer truck drivers (14,900) each incurred at least 5 percent of the total private sector MSD cases in 2015. The MSD incidence rate for nursing assistants was 171.0 cases per 10,000 full-time workers in 2015, down from 191.1 in 2014. For heavy and tractor-trailer truck drivers, both the MSD rate (94.0) and number (14,900) of MSD cases in 2015 decreased from 2014 figures. However, the median days away from work increased to 30 days, up from 20 days in 2014. (See table 9 and chart B.) Chart B. Incidence rates and median days away from work for musculoskeletal disorders, private industry, 2013‐15 Total Heavy and tractor‐trailer truck drivers Laborers and freight, stock, and material movers 2013 2014 Nursing assistants 2015 250 Source: U.S. Bureau of Labor Statistics 200 150 100 50 Incidence rates per 10,000 full‐time workers 1 0 0 5 10 15 20 Median days away from work 25 30 35 Event or exposure leading to injury or illness The leading major event or exposure resulting in occupational injuries or illnesses for all ownerships in 2015 was overexertion and bodily reaction with 376,190 cases accounting for 33 percent of total cases. The 2015 incidence rate for overexertion or bodily reaction was 33.9 cases per 10,000 full-time workers, down from 35.6 in 2014. (See table 4.) Falls, slips, and trips accounted for 27 percent (309,060 cases) of the total occupational injuries and illnesses in 2015 and decreased from 2014 levels. The incidence rate for falls, slips, and trips was 27.9 cases per 10,000 full-time workers and was a decrease from the rate reported in 2014 (29.3). Chart C. Incidence rates for occupational injuries and illnesses with days away from work by selected detailed events or exposures, all ownerships, 2011‐15 20 Incidence 16 rate per 12 10,000 8 full‐time 4 workers 0 Falls on the same level Source: U.S. Bureau of Labor Statistics Struck by object or equipment 2011 2012 2013 2014 Overexertion in lifting, lowering 2015 The leading detailed types of event or exposure in 2015 included falls on the same level (197,260 cases), struck by object or equipment (157,490 cases), and overexertion in lifting or lowering (113,260 cases). (See table 4.) The incidence rate of workers being struck by an object or equipment increased to 14.2 cases per 10,000 full-time workers in 2015 from 13.4 cases in 2014. (See chart C.) The number of struck by object or equipment cases for laborers and freight, stock, and material movers increased to 12,240 cases in 2015 and contributed to the overall increase. Nature of injury or illness The leading nature (type) of injury or illness in 2015 for all ownerships was sprains, strains, or tears with 421,610 days-away-from-work cases accounting for 37 percent of total cases. The 2015 rate was 38.0 cases per 10,000 full-time workers, down from a rate of 38.9 in 2014. Workers who sustained sprains, strains, or tears required a median of 10 days away from work compared to 8 days for all types of injuries or illnesses. (See table 4 and chart D.) Chart D. Percent distribution for occupational injuries and illnesses with days away from work by selected nature of injury or illness, all ownerships, 2015 All other nature of injury or illness 21% Sprains, strains, tears 37% Fractures 9% Bruise, contusions 9% Cuts, lacerations, punctures 9% Soreness, pain 16% Total cases = 1,153,490 Note: Percentages may not add to 100 due to rounding. Source: U.S. Bureau of Labor Statistics 2 The rate of injuries and illnesses resulting from cuts, lacerations, or punctures was 9.6 cases per 10,000 full-time workers in 2015, up from 8.8 cases in 2014. (See table 7.) Laborers and freight, stock, and material movers; maintenance and repair workers, general; and janitors and cleaners were among the occupations that had increases in the number of cuts, lacerations, or punctures cases in 2015. Fractures (31 days), carpal tunnel syndrome (28 days), and amputations (22 days) required 14 or more additional median days away from work to recuperate than all types (8 days) of injuries or illnesses in 2015. (See table 4.) However, less than 1 percent of total cases resulted in carpal tunnel syndrome or amputation. Occupational injuries and illnesses with days away from work resulted in a fractured bone in 9 percent of total cases. (See chart D.) Industry Three private industry sectors had more than 100,000 days-away-from-work incidents in 2015: health care and social assistance (158,410), retail trade (123,770), and manufacturing (122,610). These 3 industries also had rates greater than the total rate of 93.9 cases per 10,000 full-time workers. (See tables 1 and 2.) Health care and social assistance The incidence rate was 113.6 cases in 2015, down from 121.3 cases in 2014. (See table 1.) The rate of fractures was 7.4 cases in 2015, up from 6.9 cases in 2014. (See table 2.) The median days away from work was 6 days in 2015, the same as reported in 2014. Retail trade The incidence rate was 105.3 cases per 10,000 full-time workers in 2015, which was not statistically different from the rate of 104.5 reported in 2014. (See table 1.) Cuts and lacerations accounted for 11 percent (13,490) of the total cases in retail trade in 2015. The rate of cuts and lacerations was 11.5 cases in 2015, up from 10.6 cases in 2014. (See table 2.) Manufacturing The incidence rate in manufacturing was 99.0 cases per 10,000 full-time workers in 2015, down from 103.1 in 2014. (See table 1.) The rate of amputations in manufacturing increased to 2.1 cases in 2015 from 1.7 cases in 2014. (See table 2.) The median days away from work in manufacturing decreased to 9 days in 2015 from 10 days in 2014. Demographics Gender The incidence rate for men in private sector, state government, and local government (all ownerships) was 113.5 cases per 10,000 full-time workers in 2015, down from 116.5 cases reported for 2014. (See table 5.) Injuries and illnesses to men accounted for 61 percent (702,400) of all cases and required a median of 10 days away from work, 3 days more than the median for women. The leading nature of injury or illness for both men and women was sprains, strains, or tears in 2015. The rate for men was 41.1 cases per 10,000 full-time workers and 34.1 cases for women. Age Workers in the age group 45-54 for all ownerships had the highest number (280,100) of daysaway-from work cases in 2015. This resulted in a rate of 112.8 cases per 10,000 full-time workers, down from 117.2 in 2014. (See table 5.) 3 Workers in age group 55-64 had among the highest incidence rate in 2015 with 115.8 cases per 10,000 full-time workers. This was not significantly different from the rate of 116.3 reported in 2014. Race or ethnicity There were 434,250 days-away-from-work cases reported among white workers in 2015, which accounted for 38 percent of all cases for all ownerships. (See table 5.) Hispanic or Latino workers had 142,170 occupational injuries or illnesses in 2015, accounting for 12 percent of the total cases. Black or African-American workers had 91,190 cases in 2015, accounting for 8 percent of total days-away-from-work cases. Race or ethnicity were unreported in 40 percent of all cases. Notes This release is the second in a series of releases from the BLS covering occupational safety and health statistics for 2015. The first release, in October 2016, covered the Survey of Occupational Injuries and Illnesses-Annual Summary (SOII-AS) and reported counts and rates of injuries and illnesses by detailed industry and case type for 2015. A third release is scheduled in December 2016 for the 2015 Census of Fatal Occupational Injuries. Data in this release are a subset of the SOII-AS data and include additional detail about the case circumstances and worker characteristics for occupational injury and illness cases that required at least 1 day away from work to recuperate. While the data come from the same survey, they are reported at different levels of precision. For example, in this release, injury and illness incidence rates for days-awayfrom-work cases are reported as 104 cases per 10,000 full-time workers. However, the same incidence rate in the SOII annual summary news release is reported as 1.0 cases per 100 full-time workers. Data users are cautioned to take into account the different levels of precision when analyzing the data. Additional background and methodological information regarding the BLS occupational safety and health statistics program can be found in Chapter 9 of the BLS Handbook of Methods at www.bls.gov/opub/hom/pdf/homch9.pdf. In 2014, the SOII began using the 2012 North American Industry Classification System (NAICS). Comparison of SOII estimates for 2014 to prior years is not advised below the sector level due to this change. For additional detailed information regarding NAICS revisions, visit www.bls.gov/bls/naics.htm. This release does not present all the publishable estimates for days-away-from-work cases. Additional detailed data are available from BLS staff at (202) 691-6170, [email protected], and the BLS website at www.bls.gov/iif/home.htm. Information in this release is available to sensory-impaired individuals upon request. Voice phone: (202) 691-5200; Federal relay service: (800) 877-8339. Days of job transfer or restriction pilot study In January of 2012, the BLS Survey of Occupational Injuries and Illnesses (SOII) began to collect information on case circumstances and worker characteristics for days-of-job-transfer-or-restriction (DJTR) cases. The pilot included six industries: specialty trade contractors; food manufacturing; building material and garden equipment supplies dealers; air transportation; warehousing and storage; and nursing and residential care facilities. The 2011-13 data from this study were published in July 2015 in BLS Report 1056: www.bls.gov/opub/reports/iif/a-pilotstudy-of-job-transfer-or-work-restriction-cases-2011-2013.pdf. Beginning in January 2015, for the DJTR study a new set of six industries replaced the original pilot industries. The new industries for which detailed DJTR data are being collected are beverage and tobacco product manufacturing; general merchandise stores; couriers and messengers; waste management and remediation services; hospitals; and accommodation. The 2015 DJTR data for these industries will be 4 released in 2017. Data for the details of days of job transfer or restriction cases can be found at http://www.bls.gov/iif/days-of-job-transfer-or-restriction.htm. Completeness of SOII BLS has long acknowledged that some conditions that are difficult for employers to relate to the workplace are not adequately recognized and reported during a calendar year (for example, long-term latent illnesses) and are believed to be understated in SOII illness measures. Following several studies in the mid-2000s questioning the completeness of SOII injury and illness counts, BLS began internal research in 2007 and, at the request of Congress, established an ongoing research program. Initial research conducted between 2009 and 2012 found that the SOII failed to capture some cases but could not determine the magnitude or leading cause of an undercount. Researchers determined that the ability to match injury and illness data across different data sources was impacted by various factors, such as establishment type, the time of case filing, and the type of injury. BLS initiated additional research from 2012 to 2014 that included interviews with employers in four states to learn more about their injury and illness recordkeeping practices. Following the four state study, BLS conducted a nationwide follow-back survey with SOII respondents in 2015 and 2016. Analysis of the results of this study will help BLS learn more about recordkeeping practices and timing issues that may negatively affect employer injury and illness reporting to the SOII. BLS also continues to conduct exploratory research on the collection of occupational injury and illness data directly from employees and will pilot test collection of these data beginning in 2017. For more information on undercount research, please see www.bls.gov/iif/undercount.htm. 5 TABLE 1. Number, median days away from work1, and incidence rate2 for nonfatal occupational injuries and illnesses involving days away from work3 by ownership, industry, musculoskeletal disorders4, and event or exposure, 2015 Event or exposure leading to injury or illness5 Industry Number Total private, state and local government ............... 1,153,490 MusculoMedian skeletal days disorders away (incifrom dence work rate) Incidence rate Contact with objects Falls, Slips, Trips OverRepetiexertion tive in lifting motion lowering Exposure to Transharmful portation subincistances dents or environments Fires and explosions Violence and other injuries by persons or animal 8 32.2 104.0 24.3 27.9 10.2 2.2 4.7 5.7 0.2 6.8 Total private industry6,7,8 ...................................... 902,160 8 29.8 93.9 24.2 24.8 9.8 2.2 4.2 4.8 .1 4.0 Total goods producing ........................................... Natural resources and mining6,7 ........................ Agriculture, forestry, fishing, and hunting6 ..... Mining7 .......................................................... Construction ...................................................... Manufacturing .................................................... 226,320 23,830 18,660 5,160 79,890 122,610 10 8 6 29 13 9 33.1 26.9 39.6 12.9 34.6 33.4 112.1 126.8 189.0 57.9 134.8 99.0 39.2 38.4 53.5 21.7 44.8 36.7 26.8 35.8 54.4 15.2 40.3 19.0 9.9 8.4 11.2 5.3 10.6 9.7 4.0 2.1 3.8 – 1.2 5.7 5.2 7.0 10.9 2.5 4.7 5.2 3.6 6.4 10.1 2.3 5.7 2.1 .3 .8 .9 .7 .2 .2 1.5 8.1 15.0 .5 1.3 .5 Total service providing ........................................... Trade, transportation and utilities8 ..................... Wholesale trade ............................................. Retail trade .................................................... Transportation and warehousing ................... Utilities ........................................................... Information ......................................................... Financial activities ............................................. Real estate and rental and leasing ................ Professional and business services .................. Professional, scientific, and technical services ....................................................... Management of companies and enterprises Administrative and support and waste management and remediation services ....... Education and health services ........................... Educational services ...................................... Health care and social assistance ................. Leisure and hospitality ....................................... Arts, entertainment, and recreation ............... Accommodation and food services ................ Other services ................................................... 675,840 279,150 60,340 123,770 90,990 4,060 14,050 30,110 20,630 67,320 8 11 9 7 20 19 18 7 7 7 28.9 44.5 38.4 36.2 76.4 27.7 21.3 11.7 34.5 11.3 89.1 124.5 106.5 105.3 204.3 73.4 56.3 41.3 111.0 44.5 20.1 33.1 31.8 32.0 40.1 12.3 9.1 7.5 26.8 9.4 24.3 30.8 24.1 26.6 51.4 22.0 15.7 15.3 31.5 14.6 9.8 17.3 14.7 16.1 25.2 5.1 3.0 4.8 17.0 3.6 1.7 2.0 1.9 1.9 2.3 3.0 2.0 2.3 2.1 1.0 3.9 3.1 2.6 3.2 3.6 2.1 1.8 1.5 4.4 1.7 5.2 9.0 6.8 3.7 26.5 5.3 4.9 3.0 8.3 3.6 .1 .2 .2 .1 .1 1.4 – – – – 4.7 1.6 .8 1.7 2.6 1.1 1.2 1.1 3.0 2.8 18,030 5,700 5 8 5.6 7.0 22.8 26.6 3.4 5.1 7.1 11.2 1.6 2.5 .5 .7 1.1 1.1 1.4 1.3 – – 3.2 .2 43,590 168,940 10,530 158,410 92,670 14,110 78,560 23,600 9 6 5 6 6 6 6 6 21.9 39.3 12.8 42.9 20.3 28.8 19.0 22.0 85.7 106.8 56.3 113.6 96.2 105.8 94.7 75.9 20.6 13.4 10.5 13.8 29.7 24.6 30.5 21.9 27.5 29.2 18.8 30.6 27.6 30.9 27.1 17.9 7.1 10.9 3.4 11.9 6.9 8.5 6.7 6.5 2.0 1.7 .9 1.8 1.8 2.5 1.6 1.7 3.0 4.8 1.3 5.2 10.5 6.4 11.1 3.4 7.8 4.2 1.4 4.6 2.0 2.8 1.8 4.9 See footnotes at end of table. .1 .1 – .1 .1 .1 .1 .3 3.1 13.7 10.8 14.0 3.7 8.4 2.9 4.6 TABLE 1. Number, median days away from work1, and incidence rate2 for nonfatal occupational injuries and illnesses involving days away from work3 by ownership, industry, musculoskeletal disorders4, and event or exposure, 2015 — Continued Event or exposure leading to injury or illness5 Industry Number MusculoMedian skeletal days disorders away (incifrom dence work rate) Incidence rate Contact with objects Falls, Slips, Trips OverRepetiexertion tive in lifting motion lowering Exposure to Transharmful portation subincistances dents or environments Fires and explosions Violence and other injuries by persons or animal Total state government6,7,8 ................................... 59,590 11 41.0 149.2 17.8 38.3 8.4 2.3 6.5 10.8 Total service providing ........................................... Education and health services ........................... Educational services ...................................... Health care and social assistance ................. Public administration ......................................... Justice, public order, and safety activities ..... 57,960 25,980 7,520 18,460 27,500 18,620 11 10 10 10 12 13 40.5 36.8 17.3 89.4 40.7 67.2 147.8 127.2 50.5 334.4 157.5 261.6 17.3 14.4 7.1 34.0 17.1 26.2 37.9 30.5 18.6 62.5 45.5 67.3 8.2 9.1 5.4 19.2 6.5 10.5 2.3 1.8 1.2 3.5 2.6 2.5 6.4 3.4 2.5 5.9 9.6 11.4 10.4 4.3 1.6 11.7 10.3 13.6 Total local government6,7,8 ................................... 191,750 9 50.2 177.5 28.4 51.1 14.4 2.1 8.2 11.6 Total goods producing ........................................... Construction ...................................................... 3,250 3,250 20 20 112.7 113.2 320.9 322.0 69.1 69.2 102.8 103.0 35.9 36.0 5.8 5.8 5.6 5.6 24.9 25.0 – – – – Total service providing ........................................... Trade, transportation and utilities8 ..................... Transportation and warehousing ................... Utilities ........................................................... Education and health services ........................... Educational services ...................................... Health care and social assistance ................. Public administration ......................................... Justice, public order, and safety activities ..... 188,490 14,920 9,790 5,130 80,810 69,800 11,010 84,380 38,200 9 17 19 10 8 8 7 9 10 49.6 123.5 148.0 96.8 34.2 31.0 58.8 66.8 103.6 176.1 315.2 391.0 232.1 124.7 121.7 148.5 248.2 414.0 28.0 49.6 60.1 38.0 21.2 21.7 16.7 34.7 56.2 50.6 55.1 48.9 62.8 43.1 43.8 37.3 63.6 93.6 14.1 26.3 15.0 39.3 10.7 10.1 15.9 17.5 20.8 2.1 8.9 9.1 8.8 1.1 .9 2.7 2.8 2.4 8.2 13.9 12.9 15.1 4.6 4.2 7.4 13.7 26.1 11.5 44.3 80.2 4.1 3.4 3.5 2.7 20.3 31.6 .5 – – – – – – 1.4 2.1 23.2 24.6 35.1 12.8 15.4 14.8 20.1 39.4 85.2 0.1 31.2 .1 31.7 35.6 1.4 127.7 29.0 66.6 – – – .2 – .5 23.0 1 Median days away from work is the measure used to summarize the varying lengths of absences from work among the cases with days away from work. Half the cases involved more days and half involved fewer days than a specified median. Median days away from work are represented in actual values. 2 The incidence rates represent the number of injuries and illnesses per 10,000 full-time workers and were calculated as (N/EH) x 20,000,000, where N = number of injuries and illnesses EH = total hours worked by all employees during the calendar year 20,000,000 = base for 10,000 equivalent full-time workers (working 40 hours per week, 50 weeks per year). 3 Days-away-from-work cases include those that resulted in days away from work, some of which also included job transfer or restriction. 4 Musculoskeletal disorders include cases in which the nature of the injury or illness is pinched nerve; herniated disc; meniscus tear; sprains, strains, tears; hernia (traumatic and nontraumatic); pain, swelling, and numbness; carpal or tarsal tunnel syndrome; Raynaud’s syndrome or phenomenon; musculoskeletal system and connective tissue diseases and disorders, and when the event or exposure leading to the injury or illness is overexertion and bodily reaction, unspecified; overexertion involving outside sources; repetitive motion involving microtasks; other and multiple exertions or bodily reactions; and rubbed, abraded, or jarred by vibration. 5 Data shown in columns correspond to Event codes based on the Occupational Injury and Illness Classification System 2.01 developed by the Bureau of Labor Statistics. 6 Excludes farms with fewer than 11 employees. 7 Data for Mining (Sector 21 in the North American Industry Classification System United States, 2012) include establishments not governed by the Mine Safety and Health Administration rules and reporting, such as those in Oil and Gas Extraction and related support activities. Data for mining operators in coal, metal, and nonmetal mining are provided to BLS by the Mine Safety and Health Administration, U.S. Department of Labor. Independent mining contractors are excluded from the coal, metal, and nonmetal mining industries. These data do not reflect the changes the Occupational Safety and Health Administration made to its recordkeeping requirements effective January 1, 2002; therefore, estimates for these industries are not comparable to estimates in other industries. 8 Data for employers in rail transportation are provided to BLS by the Federal Railroad Administration, U.S. Department of Transportation. Note: Dash indicates data do not meet publication guidelines. Because of rounding and data exclusion of nonclassifiable responses, data may not sum to the totals. Source: U.S. Bureau of Labor Statistics, Survey of Occupational Injuries and Illnesses, in cooperation with participating state agencies. TABLE 2. Number, median days away from work1, and incidence rate2 for nonfatal occupational injuries and illnesses involving days away from work3 by ownership, industry, and nature of injury, 2015 Nature of injury or illness4 Industry Number Total private, state and local government .. 1,153,490 Total private industry6,7,8 Median days away from work 8 Incidence rate 104.0 Sprains, strains, tears 38.0 Fractures 8.9 Cuts, lacerations 8.1 Amputations Bruises, contusions 0.5 9.1 ......................... 902,160 8 93.9 33.8 8.4 8.2 .6 7.9 Total goods producing .............................. Natural resources and mining6,7 ........... Agriculture, forestry, fishing, and hunting6 .......................................... Mining7 .............................................. Construction ......................................... Manufacturing ....................................... 226,320 23,830 10 8 112.1 126.8 33.4 36.5 13.2 15.1 12.6 9.1 1.6 1.4 7.7 13.2 18,660 5,160 79,890 122,610 6 29 13 9 189.0 57.9 134.8 99.0 51.9 19.4 38.8 30.3 17.3 12.7 19.8 9.8 15.4 2.1 17.2 10.9 1.4 1.4 .7 2.1 20.9 4.7 6.7 7.4 Total service providing .............................. Trade, transportation and utilities8 ........ Wholesale trade ................................ Retail trade ....................................... Transportation and warehousing ...... Utilities .............................................. Information ............................................ Financial activities ................................ Real estate and rental and leasing ... Professional and business services ..... Professional, scientific, and technical services .......................................... Management of companies and enterprises ...................................... Administrative and support and waste management and remediation services ....................... Education and health services .............. Educational services ......................... Health care and social assistance .... Leisure and hospitality .......................... Arts, entertainment, and recreation .. Accommodation and food services ... Other services ...................................... 675,840 279,150 60,340 123,770 90,990 4,060 14,050 30,110 20,630 67,320 8 11 9 7 20 19 18 7 7 7 89.1 124.5 106.5 105.3 204.3 73.4 56.3 41.3 111.0 44.5 33.9 51.8 41.4 41.0 96.1 31.6 22.5 12.8 35.7 14.5 7.2 10.3 9.8 7.7 17.8 8.1 5.4 4.4 12.0 4.4 7.0 9.8 9.1 11.5 7.2 4.0 2.2 4.1 15.1 3.3 .3 .5 .6 .4 .6 8.0 12.5 9.1 11.4 20.7 4.7 3.4 2.2 4.3 3.2 18,030 5 22.8 6.2 2.2 1.1 – 1.6 5,700 8 26.6 8.7 4.0 2.4 – 2.1 43,590 168,940 10,530 158,410 92,670 14,110 78,560 23,600 9 6 5 6 6 6 6 6 85.7 106.8 56.3 113.6 96.2 105.8 94.7 75.9 29.9 46.5 18.6 50.3 24.2 35.7 22.3 23.3 7.8 7.2 5.9 7.4 6.9 8.8 6.6 7.3 7.0 3.0 3.0 3.0 16.9 8.8 18.2 5.9 See footnotes at end of table. – – – – .2 .4 .1 .1 .1 .4 .6 .4 1.2 6.2 10.7 6.2 11.2 7.2 7.3 7.2 5.0 TABLE 2. Number, median days away from work1, and incidence rate2 for nonfatal occupational injuries and illnesses involving days away from work3 by ownership, industry, and nature of injury, 2015 — Continued Nature of injury or illness4 Heat (thermal) burns Industry Total private, state and local government .. Total private industry6,7,8 1.6 Chemical burns 0.3 Carpal tunnel syndrome 0.5 Multiple Soreness, Tendonitis traumatic in- pain, in(other or unjuries and cluding specified) disorders back 0.2 2.8 16.6 All other natures5 15.8 ......................... 1.6 .3 .5 .3 2.4 14.2 14.2 Total goods producing .............................. Natural resources and mining6,7 ........... Agriculture, forestry, fishing, and hunting6 .......................................... Mining7 .............................................. Construction ......................................... Manufacturing ....................................... 1.4 1.7 .8 1.2 1.1 .6 .3 .2 2.7 3.6 14.9 18.8 19.8 23.9 2.4 1.0 .5 1.7 1.2 1.2 .7 .8 1.1 – .2 1.6 .4 5.9 1.0 2.8 2.6 32.9 3.2 20.1 11.9 35.6 11.0 22.7 17.8 1.6 .9 .5 1.4 .4 .5 .2 .2 .5 .5 .2 .3 .6 .3 .2 .4 .3 .4 .3 .3 .3 .3 .8 .2 .2 .2 .3 .5 .3 2.3 2.9 3.0 1.6 6.1 3.6 1.8 1.7 2.8 1.0 14.0 16.6 15.0 14.0 26.6 10.2 9.3 7.6 20.5 7.7 12.8 16.9 15.4 14.4 26.4 9.5 10.4 6.5 17.7 7.8 .1 .3 4.0 5.2 .7 3.6 4.3 2.2 2.9 2.3 3.0 2.7 3.8 2.5 1.6 15.3 19.6 9.9 20.9 14.9 17.3 14.5 12.6 13.2 14.2 8.7 15.0 13.8 19.5 12.9 12.9 Total service providing .............................. Trade, transportation and utilities8 ........ Wholesale trade ................................ Retail trade ....................................... Transportation and warehousing ...... Utilities .............................................. Information ............................................ Financial activities ................................ Real estate and rental and leasing ... Professional and business services ..... Professional, scientific, and technical services .......................................... Management of companies and enterprises ...................................... Administrative and support and waste management and remediation services ....................... Education and health services .............. Educational services ......................... Health care and social assistance .... Leisure and hospitality .......................... Arts, entertainment, and recreation .. Accommodation and food services ... Other services ...................................... See footnotes at end of table. – – .1 .6 .1 .1 – .2 .5 – .2 1.0 .8 .6 .8 7.9 2.2 8.8 1.2 .3 .2 – .2 .2 .3 .2 .1 .4 .3 .3 .3 .3 .2 .3 .6 – .1 .4 .2 .2 .1 .2 .5 – – .9 .3 – .3 .2 .2 .1 – TABLE 2. Number, median days away from work1, and incidence rate2 for nonfatal occupational injuries and illnesses involving days away from work3 by ownership, industry, and nature of injury, 2015 — Continued Nature of injury or illness4 Industry Number Median days away from work Incidence rate Sprains, strains, tears Fractures Cuts, lacerations Total state government6,7,8 ...................... 59,590 11 149.2 56.4 8.2 4.5 Total service providing .............................. Education and health services .............. Educational services ......................... Health care and social assistance .... Public administration ............................ Justice, public order, and safety activities .......................................... 57,960 25,980 7,520 18,460 27,500 11 10 10 10 12 147.8 127.2 50.5 334.4 157.5 56.0 47.8 18.7 126.1 56.3 8.1 5.3 4.0 8.9 11.4 4.3 4.1 3.3 6.1 3.8 18,620 13 261.6 97.3 13.0 5.8 ...................... 191,750 9 177.5 68.9 13.0 8.1 Total goods producing .............................. Construction ......................................... 3,250 3,250 20 20 320.9 322.0 129.9 130.5 48.7 48.8 20.0 20.1 Total service providing .............................. Trade, transportation and utilities8 ........ Transportation and warehousing ...... Utilities .............................................. Education and health services .............. Educational services ......................... Health care and social assistance .... Public administration ............................ Justice, public order, and safety activities .......................................... 188,490 14,920 9,790 5,130 80,810 69,800 11,010 84,380 9 17 19 10 8 8 7 9 176.1 315.2 391.0 232.1 124.7 121.7 148.5 248.2 68.3 146.1 184.3 104.2 47.3 45.0 65.2 96.1 12.7 11.1 10.3 12.1 12.3 12.9 6.9 14.2 8.0 14.4 8.0 21.6 3.8 3.9 3.5 12.9 38,200 10 414.0 166.0 24.0 16.9 Total local government6,7,8 See footnotes at end of table. Amputations Bruises, contusions 0.1 13.3 .1 – – – – 13.1 13.6 3.9 39.8 10.3 – 17.3 .3 – – 17.5 24.7 24.7 .3 .7 .7 17.4 19.0 30.3 6.4 15.7 15.4 17.9 20.2 2.0 41.0 – – – – – TABLE 2. Number, median days away from work1, and incidence rate2 for nonfatal occupational injuries and illnesses involving days away from work3 by ownership, industry, and nature of injury, 2015 — Continued Nature of injury or illness4 Heat (thermal) burns Industry Chemical burns Carpal tunnel syndrome Multiple Soreness, Tendonitis traumatic in- pain, in(other or unjuries and cluding specified) disorders back All other natures5 Total state government6,7,8 ...................... 1.3 0.2 0.6 0.1 5.8 35.0 22.1 Total service providing .............................. Education and health services .............. Educational services ......................... Health care and social assistance .... Public administration ............................ Justice, public order, and safety activities .......................................... 1.3 .8 .5 1.8 1.8 .2 .3 .3 .4 .1 .1 .1 – .7 .4 .2 1.2 .9 5.8 4.7 1.5 13.4 5.9 34.8 33.7 10.0 97.8 36.1 21.9 15.4 7.6 36.6 28.9 1.3 – 1.3 11.2 63.2 48.2 6.0 31.6 27.6 9.5 9.5 35.8 36.0 41.8 41.9 – 5.9 17.4 26.9 6.9 3.8 3.8 4.2 8.6 31.6 45.5 62.5 26.7 22.9 22.2 28.5 43.6 27.5 56.5 62.3 50.4 16.9 16.9 16.8 43.2 – 14.0 59.9 76.2 Total local government6,7,8 ...................... 1.8 .2 Total goods producing .............................. Construction ......................................... – – – – Total service providing .............................. Trade, transportation and utilities8 ........ Transportation and warehousing ...... Utilities .............................................. Education and health services .............. Educational services ......................... Health care and social assistance .... Public administration ............................ Justice, public order, and safety activities .......................................... 1.8 – – – .8 .5 2.9 3.2 .2 1.0 – 2.1 .1 – .7 .1 4.9 – – .1 – .4 3.8 3.9 .4 .9 1.1 – .2 .1 .4 .8 .6 .1 – – .1 – – – .2 .1 .3 1 Median days away from work is the measure used to summarize the varying lengths of absences from work among the cases with days away from work. Half the cases involved more days and half involved fewer days than a specified median. Median days away from work are represented in actual values. 2 The incidence rates represent the number of injuries and illnesses per 10,000 full-time workers and were calculated as (N/EH) x 20,000,000, where N = number of injuries and illnesses EH = total hours worked by all employees during the calendar year 20,000,000 = base for 10,000 equivalent full-time workers (working 40 hours per week, 50 weeks per year). 3 Days-away-from-work cases include those that resulted in days away from work, some of which also included job transfer or restriction. 4 Data shown in columns correspond to Nature codes based on the Occupational Injury and Illness Classification System 2.01 developed by the Bureau of Labor Statistics. 5 Includes nonclassifiable responses. 6 Excludes farms with fewer than 11 employees. 7 Data for Mining (Sector 21 in the North American Industry Classification System United States, 2012) include establishments not governed by the Mine Safety and Health Administration rules and reporting, such as those in Oil and Gas Extraction and related support activities. Data for mining operators in coal, metal, and nonmetal mining are provided to BLS by the Mine Safety and Health Administration, U.S. Department of Labor. Independent mining contractors are excluded from the coal, metal, and nonmetal mining industries. These data do not reflect the changes the Occupational Safety and Health Administration made to its recordkeeping requirements effective January 1, 2002; therefore, estimates for these industries are not comparable to estimates in other industries. 8 Data for employers in rail transportation are provided to BLS by the Federal Railroad Administration, U.S. Department of Transportation. Note: Dash indicates data do not meet publication guidelines. Because of rounding and data exclusion of nonclassifiable responses, data may not sum to the totals. Source: U.S. Bureau of Labor Statistics, Survey of Occupational Injuries and Illnesses, in cooperation with participating state agencies. TABLE 3. Number, incidence rate1, and median days away from work2 for nonfatal occupational injuries and illnesses involving days away from work3 by selected worker occupation4 and ownership, 2015 Total private, state, and local government5,6,7 Occupation4 Number Incidence rate Median days away from work Private industry5,6,7 Number Incidence rate Median days away from work Total ....................................................................................... 1,153,490 104.0 8 902,160 93.9 8 Police and Sheriffs Patrol Officers ................................................. Correctional Officers and Jailers .................................................... Firefighters ..................................................................................... Nursing Assistants ......................................................................... Heating, Air Conditioning, and Refrigeration Mechanics and Installers ...................................................................................... 29,670 16,080 13,280 37,370 497.7 420.2 397.5 348.5 8 11 11 6 200 610 200 32,320 401.1 345.4 143.0 327.8 16 7 14 5 7,880 319.5 9 7,420 318.7 8 Light Truck or Delivery Services Drivers ........................................ Emergency Medical Technicians and Paramedics ........................ Heavy and Tractor-Trailer Truck Drivers ....................................... Laborers and Freight, Stock, and Material Movers, Hand ............. Food Preparation Workers ............................................................. 24,780 6,670 49,260 59,010 15,860 314.0 313.5 307.5 297.8 290.8 14 9 22 9 6 23,330 4,160 47,350 56,550 14,310 298.0 291.0 298.7 289.4 277.0 15 8 21 9 6 Sheet Metal Workers ..................................................................... Nonfarm Animal Caretakers .......................................................... Janitors and Cleaners, Except Maids and Housekeeping Cleaners ...................................................................................... Construction Laborers ................................................................... Maintenance and Repair Workers, General .................................. 3,360 3,320 289.9 278.0 7 3 3,340 3,080 289.5 264.6 7 3 42,740 19,960 30,020 277.4 265.3 262.4 10 11 9 20,200 18,530 22,820 172.0 256.0 240.2 9 11 8 Maids and Housekeeping Cleaners ............................................... Bus and Truck Mechanics and Diesel Engine Specialists ............. Painters, Construction and Maintenance ....................................... Taxi Drivers and Chauffeurs .......................................................... Automotive Service Technicians and Mechanics .......................... 17,440 5,870 4,140 3,100 11,920 255.6 246.0 235.9 213.6 207.2 7 18 9 11 8 16,390 4,080 3,490 2,990 11,450 248.6 199.6 208.8 213.6 206.3 7 18 10 11 7 Food Servers, Nonrestaurant ........................................................ Landscaping and Groundskeeping Workers .................................. Plumbers, Pipefitters, and Steamfitters ......................................... Teacher Assistants ........................................................................ Bus Drivers, School or Special Client ............................................ 3,360 14,180 6,860 15,590 6,680 201.0 194.1 193.7 185.9 185.8 5 7 22 5 13 2,700 10,100 6,410 2,840 3,130 165.3 157.2 190.0 156.5 176.4 5 7 23 5 12 Cooks, Institution and Cafeteria ..................................................... Chefs and Head Cooks .................................................................. Counter Attendants, Cafeteria, Food Concession, and Coffee Shop ............................................................................................ Carpenters ..................................................................................... Laundry and Dry-Cleaning Workers .............................................. 5,450 2,180 184.9 182.7 8 5 2,970 2,120 161.6 181.9 5 5 4,400 9,990 2,770 182.6 179.6 175.5 13 12 11 3,130 9,710 2,600 137.2 178.2 169.4 19 12 10 3,510 5,950 1,810 2,350 175.3 163.9 158.0 156.8 20 7 13 7 3,490 5,800 1,780 1,560 177.5 160.4 156.6 130.2 20 7 13 4 2,650 155.7 10 2,340 140.2 8 21,420 3,450 14,640 4,600 1,830 154.4 151.4 149.4 145.6 144.5 8 5 8 6 8 21,160 2,800 12,800 4,510 1,640 154.7 130.2 132.0 144.3 143.8 8 5 8 6 8 Telecommunications Equipment Installers and Repairers, Except Line Installers ............................................................................... Welders, Cutters, Solderers, and Brazers ..................................... Reservation and Transportation Ticket Agents and Travel Clerks First-Line Supervisors of Housekeeping and Janitorial Workers ... First-Line Supervisors of Helpers, Laborers, and Material Movers, Hand ............................................................................................ Stock Clerks and Order Fillers ....................................................... Dining Room and Cafeteria Attendants and Bartender Helpers .... Personal Care Aides ...................................................................... Dishwashers .................................................................................. Medical and Clinical Laboratory Technicians ................................ See footnotes at end of table. TABLE 3. Number, incidence rate1, and median days away from work2 for nonfatal occupational injuries and illnesses involving days away from work3 by selected worker occupation4 and ownership, 2015 — Continued State government6,7 Occupation4 Number Incidence rate Local government6,7 Median days away from work Number Incidence rate Median days away from work Total ....................................................................................... 59,590 149.2 11 191,750 177.5 9 Police and Sheriffs Patrol Officers ................................................. Correctional Officers and Jailers .................................................... Firefighters ..................................................................................... Nursing Assistants ......................................................................... Heating, Air Conditioning, and Refrigeration Mechanics and Installers ...................................................................................... 2,790 10,790 690 2,220 393.9 457.5 624.4 737.9 13 14 4 8 26,680 4,680 12,390 2,830 530.2 333.0 422.2 494.5 7 5 12 6 180 368.5 9 280 303.8 16 60 – – – 296.0 853.1 14 – 16 9 10 1,390 2,500 1,790 2,210 1,240 1,975.9 387.5 896.5 957.6 490.5 8 10 30 8 6 43 24 – – – – 3 Light Truck or Delivery Services Drivers ........................................ Emergency Medical Technicians and Paramedics ........................ Heavy and Tractor-Trailer Truck Drivers ....................................... Laborers and Freight, Stock, and Material Movers, Hand ............. Food Preparation Workers ............................................................. – 110 240 310 Sheet Metal Workers ..................................................................... Nonfarm Animal Caretakers .......................................................... Janitors and Cleaners, Except Maids and Housekeeping Cleaners ...................................................................................... Construction Laborers ................................................................... Maintenance and Repair Workers, General .................................. 20 60 2,400 130 1,400 405.7 – 320.3 15 25 10 20,140 1,310 5,810 657.4 485.8 390.4 10 7 10 Maids and Housekeeping Cleaners ............................................... Bus and Truck Mechanics and Diesel Engine Specialists ............. Painters, Construction and Maintenance ....................................... Taxi Drivers and Chauffeurs .......................................................... Automotive Service Technicians and Mechanics .......................... 340 350 120 20 180 687.5 863.1 – – 310.6 6 22 6 14 10 710 1,430 540 90 290 365.9 486.3 834.2 215.6 193.1 6 15 9 14 10 Food Servers, Nonrestaurant ........................................................ Landscaping and Groundskeeping Workers .................................. Plumbers, Pipefitters, and Steamfitters ......................................... Teacher Assistants ........................................................................ Bus Drivers, School or Special Client ............................................ 370 710 120 120 – 557.1 295.5 53.7 – 13 7 13 9 – 290 3,370 330 12,630 3,530 547.7 451.0 246.4 207.7 206.7 3 7 9 5 13 500 50 576.5 – 20 180 1,980 – 210.2 – 12 – 60 140 100 – 378.4 – 12 10 85 1,200 140 80 1,505.8 155.2 275.5 7 21 15 – – – 216.2 – 5 – 10 – 120 20 650 – – – 284.0 – 6 1 20 25 200 721.5 34 7 7 9 – 15 120 590 660 90 80 96.9 619.0 698.4 – 108.8 26 6 13 4 4 – Cooks, Institution and Cafeteria ..................................................... Chefs and Head Cooks .................................................................. Counter Attendants, Cafeteria, Food Concession, and Coffee Shop ............................................................................................ Carpenters ..................................................................................... Laundry and Dry-Cleaning Workers .............................................. Telecommunications Equipment Installers and Repairers, Except Line Installers ............................................................................... Welders, Cutters, Solderers, and Brazers ..................................... Reservation and Transportation Ticket Agents and Travel Clerks First-Line Supervisors of Housekeeping and Janitorial Workers ... First-Line Supervisors of Helpers, Laborers, and Material Movers, Hand ............................................................................................ – Stock Clerks and Order Fillers ....................................................... Dining Room and Cafeteria Attendants and Bartender Helpers .... Personal Care Aides ...................................................................... Dishwashers .................................................................................. Medical and Clinical Laboratory Technicians ................................ 150 60 1,180 – 110 – 30 130 120 – – – 132.4 – 894.1 – 182.0 170 1 The incidence rates represent the number of injuries and illnesses per 10,000 full-time workers and were calculated as (N/EH) x 20,000,000, where N = number of injuries and illnesses EH = total hours worked by all employees during the calendar year 20,000,000 = base for 10,000 equivalent full-time workers (working 40 hours per week, 50 weeks per year). 2 Median days away from work is the measure used to summarize the varying lengths of absences from work among the cases with days away from work. Half the cases involved more days and half involved fewer days than a specified median. Median days away from work are represented in actual values. 3 Days-away-from-work cases include those that resulted in days away from work, some of which also included job transfer or restriction. 4 These occupations have at least 0.1% of full-time equivalent employment. 5 Excludes farms with fewer than 11 employees. 6 Data for Mining (Sector 21 in the North American Industry Classification System United States, 2012) include establishments not governed by the Mine Safety and Health Administration rules and reporting, such as those in Oil and Gas Extraction and related support activities. Data for mining operators in coal, metal, and nonmetal mining are provided to BLS by the Mine Safety and Health Administration, U.S. Department of Labor. Independent mining contractors are excluded from the coal, metal, and nonmetal mining industries. These data do not reflect the changes the Occupational Safety and Health Administration made to its recordkeeping requirements effective January 1, 2002; therefore, estimates for these industries are not comparable to estimates in other industries. 7 Data for employers in rail transportation are provided to BLS by the Federal Railroad Administration, U.S. Department of Transportation. Note: Dash indicates data do not meet publication guidelines. Because of rounding and data exclusion of nonclassifiable responses, data may not sum to the totals. Source: U.S. Bureau of Labor Statistics, Survey of Occupational Injuries and Illnesses, in cooperation with participating state agencies. TABLE 4. Number, incidence rate1, and median days away from work2 for nonfatal occupational injuries and illnesses involving days away from work3 by injury or illness characteristics and ownership, 2015 Total private, state, and local government4,5,6 Characteristic Total .............................................................................. Musculoskeletal disorders7 Number Incidence rate Median days away from work 1,153,490 104.0 8 Private industry4,5,6 Incidence rate Median days away from work 902,160 93.9 8 Number ............................................... 356,910 32.2 12 286,350 29.8 12 Nature of injury or illness: Fractures ........................................................................... Sprains, strains, tears ....................................................... Amputations ...................................................................... Cuts, lacerations, punctures ............................................. Cuts, lacerations ........................................................... Punctures (except gunshot wounds) ............................ Bruises, contusions ........................................................... Chemical burns and corrosions ........................................ Heat (thermal) burns ......................................................... Multiple traumatic injuries ................................................. With sprains .................................................................. With fractures ................................................................ Soreness, pain .................................................................. Carpal tunnel syndrome .................................................... Tendonitis (other or unspecified) ...................................... All other natures ................................................................ 98,530 421,610 5,700 106,410 89,300 17,110 100,480 3,490 17,520 31,570 14,600 4,540 184,400 5,650 2,650 175,500 8.9 38.0 .5 9.6 8.1 1.5 9.1 .3 1.6 2.8 1.3 .4 16.6 .5 .2 15.8 31 10 22 4 4 3 5 3 5 10 9 31 8 28 14 7 81,180 324,700 5,360 93,090 78,790 14,300 76,290 3,200 15,010 22,800 10,110 3,970 136,300 4,920 2,470 136,840 8.4 33.8 .6 9.7 8.2 1.5 7.9 .3 1.6 2.4 1.1 .4 14.2 .5 .3 14.2 32 10 26 3 3 3 4 3 4 10 11 32 7 28 14 7 Event or exposure leading to injury or illness: Violence and other injuries by persons or animal ............. Intentional injury by other person .................................... Injury by person unintentional or intent unknown ........... Animal and insect related incidents ................................ Transportation incidents ................................................... Roadway incidents involving motorized land vehicles .... Fires and explosions ......................................................... Falls, slips, trips ................................................................ Slips, trips without fall ..................................................... Fall on same level ........................................................... Fall to lower level ............................................................ Exposure to harmful substances or environments ............ Contact with object, equipment ......................................... Struck by object or equipment ........................................ Struck against object or equipment ................................ Caught in or compressed by object or equipment .......... Overexertion and bodily reaction ...................................... Overexertion in lifting or lowering ................................... Repetitive motion involving microtasks ........................... All other event or exposures ............................................. 75,720 34,750 25,450 14,740 63,210 44,490 1,850 309,060 45,170 197,260 60,490 51,650 269,910 157,490 59,010 36,870 376,190 113,260 24,410 5,900 6.8 3.1 2.3 1.3 5.7 4.0 .2 27.9 4.1 17.8 5.5 4.7 24.3 14.2 5.3 3.3 33.9 10.2 2.2 .5 5 7 7 3 10 8 9 12 11 10 18 4 5 5 5 10 12 11 22 8 38,440 16,160 9,930 12,020 46,360 31,130 1,270 238,610 34,140 149,180 50,490 40,250 232,120 135,280 50,160 33,400 300,600 94,420 21,230 4,520 4.0 1.7 1.0 1.3 4.8 3.2 .1 24.8 3.6 15.5 5.3 4.2 24.2 14.1 5.2 3.5 31.3 9.8 2.2 .5 4 5 5 3 11 10 11 12 10 10 19 3 5 5 5 10 12 11 22 7 See footnotes at end of table. TABLE 4. Number, incidence rate1, and median days away from work2 for nonfatal occupational injuries and illnesses involving days away from work3 by injury or illness characteristics and ownership, 2015 — Continued State government5,6 Characteristic Number Total .............................................................................. Musculoskeletal disorders7 Local government5,6 Median Incidence days away rate from work Number Incidence rate Median days away from work 59,590 149.2 11 191,750 177.5 9 ............................................... 16,380 41.0 15 54,190 50.2 10 Nature of injury or illness: Fractures ........................................................................... Sprains, strains, tears ....................................................... Amputations ...................................................................... Cuts, lacerations, punctures ............................................. Cuts, lacerations ........................................................... Punctures (except gunshot wounds) ............................ Bruises, contusions ........................................................... Chemical burns and corrosions ........................................ Heat (thermal) burns ......................................................... Multiple traumatic injuries ................................................. With sprains .................................................................. With fractures ................................................................ Soreness, pain .................................................................. Carpal tunnel syndrome .................................................... Tendonitis (other or unspecified) ...................................... All other natures ................................................................ 3,270 22,530 40 2,360 1,790 570 5,330 90 540 2,330 1,300 140 13,970 260 50 8,820 8.2 56.4 .1 5.9 4.5 1.4 13.3 .2 1.3 5.8 3.3 .3 35.0 .6 .1 22.1 46 13 16 4 4 3 6 2 6 6 5 15 11 35 30 8 14,070 74,390 290 10,950 8,720 2,230 18,870 210 1,970 6,440 3,190 430 34,130 470 130 29,830 13.0 68.9 .3 10.1 8.1 2.1 17.5 .2 1.8 6.0 2.9 .4 31.6 .4 .1 27.6 30 10 12 4 4 5 5 5 9 9 6 22 9 21 29 9 Event or exposure leading to injury or illness: Violence and other injuries by persons or animal ............. Intentional injury by other person .................................... Injury by person unintentional or intent unknown ........... Animal and insect related incidents ................................ Transportation incidents ................................................... Roadway incidents involving motorized land vehicles .... Fires and explosions ......................................................... Falls, slips, trips ................................................................ Slips, trips without fall ..................................................... Fall on same level ........................................................... Fall to lower level ............................................................ Exposure to harmful substances or environments ............ Contact with object, equipment ......................................... Struck by object or equipment ........................................ Struck against object or equipment ................................ Caught in or compressed by object or equipment .......... Overexertion and bodily reaction ...................................... Overexertion in lifting or lowering ................................... Repetitive motion involving microtasks ........................... All other event or exposures ............................................. 12,470 7,090 4,660 600 4,300 3,640 60 15,290 2,270 10,500 2,310 2,590 7,120 3,910 1,770 860 17,360 3,340 920 400 31.2 17.7 11.7 1.5 10.8 9.1 .1 38.3 5.7 26.3 5.8 6.5 17.8 9.8 4.4 2.2 43.5 8.4 2.3 1.0 10 9 15 4 7 7 33 14 9 14 51 4 6 6 8 7 15 14 21 15 24,810 11,510 10,860 2,120 12,550 9,720 530 55,160 8,760 37,580 7,700 8,810 30,680 18,300 7,090 2,600 58,230 15,500 2,260 980 23.0 10.7 10.1 2.0 11.6 9.0 .5 51.1 8.1 34.8 7.1 8.2 28.4 16.9 6.6 2.4 53.9 14.4 2.1 .9 7 9 8 3 8 6 3 11 14 10 10 7 6 6 5 6 10 13 19 10 See footnotes at end of table. TABLE 4. Number, incidence rate1, and median days away from work2 for nonfatal occupational injuries and illnesses involving days away from work3 by injury or illness characteristics and ownership, 2015 — Continued Total private, state, and local government4,5,6 Characteristic Number Incidence rate Median days away from work Private industry4,5,6 Number Incidence rate Median days away from work Part of body affected by the injury or illness: Head ................................................................................. Eye(s) ........................................................................... Neck .................................................................................. Trunk ................................................................................. Back .............................................................................. Upper extremities .............................................................. Shoulder ....................................................................... Arm ............................................................................... Wrist .............................................................................. Hand ............................................................................. Lower extremities .............................................................. Knee ............................................................................. Ankle ............................................................................. Foot ............................................................................... Body systems ................................................................... Multiple ............................................................................. All other parts of body ....................................................... 94,360 25,080 15,950 258,000 191,450 358,890 92,850 56,390 41,790 143,900 266,470 100,880 59,350 53,530 24,620 127,180 8,020 8.5 2.3 1.4 23.3 17.3 32.4 8.4 5.1 3.8 13.0 24.0 9.1 5.4 4.8 2.2 11.5 .7 3 2 8 8 7 10 23 10 14 5 12 16 9 10 5 9 6 74,180 20,600 12,430 209,360 155,740 294,420 72,270 45,760 34,210 124,540 202,460 73,810 45,780 43,310 16,560 86,410 6,350 7.7 2.1 1.3 21.8 16.2 30.6 7.5 4.8 3.6 13.0 21.1 7.7 4.8 4.5 1.7 9.0 .7 3 2 9 8 7 9 23 8 14 5 13 17 10 10 3 9 5 Source of injury or illness: Chemicals and chemical products .................................... Containers ........................................................................ Furniture and fixtures ........................................................ Machinery ......................................................................... Parts and materials ........................................................... Person, injured or ill worker .............................................. Worker motion or position ............................................. Person, other than injured or ill worker ............................. Patient ........................................................................... Floors, walkways, ground surfaces ................................... Handtools .......................................................................... Ladder ............................................................................... Vehicles ............................................................................ Trucks ........................................................................... Cart, dolly, hand truck nonpowered .............................. All other sources ............................................................... 14,280 117,440 49,080 59,830 81,670 178,620 167,620 110,520 56,090 202,150 52,030 23,920 116,430 27,480 15,490 147,530 1.3 10.6 4.4 5.4 7.4 16.1 15.1 10.0 5.1 18.2 4.7 2.2 10.5 2.5 1.4 13.3 3 9 7 7 9 12 12 7 7 11 5 21 10 14 9 5 11,050 101,690 39,520 53,400 73,250 135,790 128,270 64,340 41,820 152,830 45,630 20,490 91,410 24,000 13,140 112,770 1.1 10.6 4.1 5.6 7.6 14.1 13.3 6.7 4.4 15.9 4.7 2.1 9.5 2.5 1.4 11.7 3 9 7 7 9 12 13 6 6 11 5 18 12 16 10 5 See footnotes at end of table. TABLE 4. Number, incidence rate1, and median days away from work2 for nonfatal occupational injuries and illnesses involving days away from work3 by injury or illness characteristics and ownership, 2015 — Continued State government5,6 Characteristic Number Local government5,6 Median Incidence days away rate from work Number Incidence rate Median days away from work Part of body affected by the injury or illness: Head ................................................................................. Eye(s) ........................................................................... Neck .................................................................................. Trunk ................................................................................. Back .............................................................................. Upper extremities .............................................................. Shoulder ....................................................................... Arm ............................................................................... Wrist .............................................................................. Hand ............................................................................. Lower extremities .............................................................. Knee ............................................................................. Ankle ............................................................................. Foot ............................................................................... Body systems ................................................................... Multiple ............................................................................. All other parts of body ....................................................... 5,140 1,010 920 12,500 9,240 14,640 4,470 2,140 1,690 4,560 12,620 5,610 2,980 1,700 1,960 11,060 750 12.9 2.5 2.3 31.3 23.1 36.6 11.2 5.4 4.2 11.4 31.6 14.0 7.5 4.3 4.9 27.7 1.9 4 3 10 10 8 14 25 11 13 8 13 18 9 11 5 12 21 15,040 3,460 2,600 36,150 26,480 49,830 16,110 8,490 5,890 14,800 51,400 21,470 10,590 8,520 6,100 29,710 920 13.9 3.2 2.4 33.5 24.5 46.1 14.9 7.9 5.5 13.7 47.6 19.9 9.8 7.9 5.6 27.5 .9 5 4 7 8 8 10 23 11 13 6 10 12 7 11 7 9 8 Source of injury or illness: Chemicals and chemical products .................................... Containers ........................................................................ Furniture and fixtures ........................................................ Machinery ......................................................................... Parts and materials ........................................................... Person, injured or ill worker .............................................. Worker motion or position ............................................. Person, other than injured or ill worker ............................. Patient ........................................................................... Floors, walkways, ground surfaces ................................... Handtools .......................................................................... Ladder ............................................................................... Vehicles ............................................................................ Trucks ........................................................................... Cart, dolly, hand truck nonpowered .............................. All other sources ............................................................... 600 2,630 2,000 1,100 1,580 9,820 9,070 15,180 8,010 10,600 1,340 1,100 5,920 640 810 7,710 1.5 6.6 5.0 2.7 3.9 24.6 22.7 38.0 20.1 26.5 3.3 2.8 14.8 1.6 2.0 19.3 3 19 7 9 15 13 14 11 10 14 8 54 7 10 20 6 2,630 13,130 7,560 5,340 6,840 33,000 30,280 31,000 6,250 38,720 5,070 2,320 19,100 2,850 1,540 27,050 2.4 12.2 7.0 4.9 6.3 30.6 28.0 28.7 5.8 35.8 4.7 2.2 17.7 2.6 1.4 25.0 8 10 7 7 11 10 10 8 8 10 12 24 8 9 6 6 1 The incidence rates represent the number of injuries and illnesses per 10,000 full-time workers and were calculated as (N/EH) x 20,000,000, where N = number of injuries and illnesses EH = total hours worked by all employees during the calendar year 20,000,000 = base for 10,000 equivalent full-time workers (working 40 hours per week, 50 weeks per year). 2 Median days away from work is the measure used to summarize the varying lengths of absences from work among the cases with days away from work. Half the cases involved more days and half involved fewer days than a specified median. Median days away from work are represented in actual values. 3 Days-away-from-work cases include those that resulted in days away from work, some of which also included job transfer or restriction. 4 Excludes farms with fewer than 11 employees. 5 Data for Mining (Sector 21 in the North American Industry Classification System United States, 2012) include establishments not governed by the Mine Safety and Health Administration rules and reporting, such as those in Oil and Gas Extraction and related support activities. Data for mining operators in coal, metal, and nonmetal mining are provided to BLS by the Mine Safety and Health Administration, U.S. Department of Labor. Independent mining contractors are excluded from the coal, metal, and nonmetal mining industries. These data do not reflect the changes the Occupational Safety and Health Administration made to its recordkeeping requirements effective January 1, 2002; therefore, estimates for these industries are not comparable to estimates in other industries. 6 Data for employers in rail transportation are provided to BLS by the Federal Railroad Administration, U.S. Department of Transportation. 7 Musculoskeletal disorders include cases in which the nature of the injury or illness is pinched nerve; herniated disc; meniscus tear; sprains, strains, tears; hernia (traumatic and nontraumatic); pain, swelling, and numbness; carpal or tarsal tunnel syndrome; Raynaud’s syndrome or phenomenon; musculoskeletal system and connective tissue diseases and disorders, and when the event or exposure leading to the injury or illness is overexertion and bodily reaction, unspecified; overexertion involving outside sources; repetitive motion involving microtasks; other and multiple exertions or bodily reactions; and rubbed, abraded, or jarred by vibration. Note: Dash indicates data do not meet publication guidelines. Because of rounding and data exclusion of nonclassifiable responses, data may not sum to the totals. Source: U.S. Bureau of Labor Statistics, Survey of Occupational Injuries and Illnesses, in cooperation with participating state agencies. TABLE 5. Number, incidence rate1, and median days away from work2 for nonfatal occupational injuries and illnesses involving days away from work3 by gender, age groups, length of service, race or ethnic origin, by ownership, 2015 Total private, state, and local government4,5,6 Characteristic Total ............................................................ Number Incidence rate Median days away from work 1,153,490 104.0 8 702,400 445,970 113.5 91.9 140 24,910 93,940 233,940 245,450 280,100 207,250 43,390 Private industry4,5,6 Incidence rate Median days away from work 902,160 93.9 8 10 7 556,370 341,130 100.5 84.8 9 7 – 110.5 98.3 92.9 102.6 112.8 115.8 89.2 4 4 4 6 9 12 13 14 130 23,560 86,590 190,500 187,950 210,200 152,590 33,850 – 109.2 97.5 85.2 91.4 99.6 101.3 81.0 3 4 4 6 9 12 14 17 111,110 200,000 352,170 465,720 – – – – 6 6 7 12 103,010 183,470 293,100 306,050 – – – – 6 7 7 13 434,250 91,190 142,170 16,190 3,050 4,830 630 1,240 459,960 – – – – – – – – – 7 8 7 7 9 4 5 2 10 347,200 73,590 125,360 14,530 2,490 4,040 460 1,130 333,370 – – – – – – – – – 7 8 7 7 7 4 5 2 10 Number Gender: Male .................................................................. Female .............................................................. Age: 14 - 15 .............................................................. 16 - 19 .............................................................. 20 - 24 .............................................................. 25 - 34 .............................................................. 35 - 44 .............................................................. 45 - 54 .............................................................. 55 - 64 .............................................................. 65 and over ....................................................... Length of service with employer: Less than 3 months .......................................... 3 - 11 months .................................................... 1 - 5 years ......................................................... More than 5 years ............................................. Race or ethnic origin:7 White only ......................................................... Black only ......................................................... Hispanic or Latino only ..................................... Asian only ......................................................... Native Hawaiian or Pacific Islander only .......... American Indian or Alaskan Native only ........... Hispanic or Latino and other race ..................... Multi-race .......................................................... Not reported ...................................................... See footnotes at end of table. TABLE 5. Number, incidence rate1, and median days away from work2 for nonfatal occupational injuries and illnesses involving days away from work3 by gender, age groups, length of service, race or ethnic origin, by ownership, 2015 — Continued State government5,6 Characteristic Number Total ............................................................ Local government5,6 Median Incidence days away rate from work Number Incidence rate Median days away from work 59,590 149.2 11 191,750 177.5 9 31,420 28,060 188.0 121.1 12 9 114,600 76,780 237.9 128.7 10 8 360 2,160 10,280 13,560 17,740 12,720 1,710 – 138.4 93.3 132.3 150.8 180.0 158.3 85.1 – 4 6 8 10 13 14 12 – 1,000 5,200 33,170 43,940 52,170 41,940 7,830 – 128.3 112.3 158.1 176.1 188.5 205.5 158.5 – 4 5 6 9 10 11 8 2,230 4,130 13,690 37,570 – – – – 5 5 9 13 5,870 12,390 45,380 122,100 – – – – 5 6 7 10 17,350 6,380 2,030 500 130 230 40 40 32,900 – – – – – – – – – 10 9 18 7 22 7 6 5 11 69,700 11,230 14,770 1,160 430 570 130 70 93,690 – – – – – – – – – 7 10 9 5 30 7 5 43 10 Gender: Male .................................................................. Female .............................................................. Age: 14 - 15 .............................................................. 16 - 19 .............................................................. 20 - 24 .............................................................. 25 - 34 .............................................................. 35 - 44 .............................................................. 45 - 54 .............................................................. 55 - 64 .............................................................. 65 and over ....................................................... – Length of service with employer: Less than 3 months .......................................... 3 - 11 months .................................................... 1 - 5 years ......................................................... More than 5 years ............................................. Race or ethnic origin:7 White only ......................................................... Black only ......................................................... Hispanic or Latino only ..................................... Asian only ......................................................... Native Hawaiian or Pacific Islander only .......... American Indian or Alaskan Native only ........... Hispanic or Latino and other race ..................... Multi-race .......................................................... Not reported ...................................................... 1 The incidence rates represent the number of injuries and illnesses per 10,000 full-time workers and were calculated as (N/EH) x 20,000,000, where N = number of injuries and illnesses EH = total hours worked by all employees during the calendar year 20,000,000 = base for 10,000 equivalent full-time workers (working 40 hours per week, 50 weeks per year). 2 Median days away from work is the measure used to summarize the varying lengths of absences from work among the cases with days away from work. Half the cases involved more days and half involved fewer days than a specified median. Median days away from work are represented in actual values. 3 Days-away-from-work cases include those that resulted in days away from work, some of which also included job transfer or restriction. 4 Excludes farms with fewer than 11 employees. 5 Data for Mining (Sector 21 in the North American Industry Classification System United States, 2012) include establishments not governed by the Mine Safety and Health Administration rules and reporting, such as those in Oil and Gas Extraction and related support activities. Data for mining operators in coal, metal, and nonmetal mining are provided to BLS by the Mine Safety and Health Administration, U.S. Department of Labor. Independent mining contractors are excluded from the coal, metal, and nonmetal mining industries. These data do not reflect the changes the Occupational Safety and Health Administration made to its recordkeeping requirements effective January 1, 2002; therefore, estimates for these industries are not comparable to estimates in other industries. 6 Data for employers in rail transportation are provided to BLS by the Federal Railroad Administration, U.S. Department of Transportation. 7 Race and ethnicity data do not add to total. Some cases may be counted as both multi-race and Hispanic and other race. Note: Dash indicates data do not meet publication guidelines. Because of rounding and data exclusion of nonclassifiable responses, data may not sum to the totals. Source: U.S. Bureau of Labor Statistics, Survey of Occupational Injuries and Illnesses, in cooperation with participating state agencies. TABLE 6. Incidence rates1 for nonfatal occupational injuries and illnesses involving days away from work2 per 10,000 full-time workers by injury or illness characteristics, gender, and age groups, all ownerships, 2015 Characteristic Total .............................................................. Total Incidence rate Gender Male Age Female 16-19 20-24 25-34 35-44 45-54 55-64 65 and over 104.0 113.5 91.9 110.5 98.3 92.9 102.6 112.8 115.8 89.2 ............................... 32.2 35.9 27.4 17.6 25.1 28.0 35.5 38.6 35.0 17.5 Nature of injury or illness: Fractures .......................................................... Sprains, strains, tears ....................................... Amputations ...................................................... Cuts, lacerations, punctures ............................. Cuts, lacerations ........................................... Punctures (except gunshot wounds) ............ Bruises, contusions .......................................... Chemical burns and corrosions ........................ Heat (thermal) burns ......................................... Multiple traumatic injuries ................................. With sprains .................................................. With fractures ............................................... Soreness, pain .................................................. Carpal tunnel syndrome ................................... Tendonitis (other or unspecified) ...................... All other natures ............................................... 8.9 38.0 .5 9.6 8.1 1.5 9.1 .3 1.6 2.8 1.3 .4 16.6 .5 .2 15.8 10.2 41.1 .8 12.9 11.0 1.9 8.3 .5 1.8 2.8 1.2 .5 16.5 .3 .2 18.2 7.2 34.1 .1 5.5 4.3 1.1 10.0 .1 1.3 2.9 1.5 .3 16.8 .8 .3 12.8 6.8 23.0 .6 22.4 20.4 1.9 11.4 .6 7.4 1.5 .4 .1 15.0 .1 – 21.6 6.6 29.9 .6 15.1 13.2 1.9 9.8 .4 3.6 1.6 .7 .2 12.3 .1 .1 18.0 6.7 33.8 .6 10.6 8.7 1.9 8.4 .3 2.0 2.0 1.0 .2 14.7 .2 .3 13.3 7.1 42.1 .5 8.1 6.8 1.3 8.2 .4 1.5 2.8 1.3 .5 16.5 .4 .3 14.7 9.5 43.4 .6 8.9 7.3 1.5 9.4 .3 .8 3.4 1.7 .4 18.4 1.0 .3 16.8 13.5 42.5 .5 7.5 6.1 1.4 9.8 .3 .8 3.8 1.7 .7 19.7 .7 .2 16.4 16.2 24.4 .2 5.0 4.7 .4 10.8 .1 .4 4.8 1.5 .5 15.3 .3 .1 11.5 6.8 3.1 5.8 2.3 8.1 4.2 6.0 1.7 6.5 2.9 8.5 3.9 7.6 3.4 6.3 3.2 5.5 2.4 3.4 1.8 2.3 1.3 5.7 2.2 1.3 6.7 2.5 1.3 4.4 1.3 2.9 5.4 1.9 1.6 4.5 3.0 1.6 5.0 2.9 1.2 6.6 2.1 1.0 5.9 1.6 1.4 6.3 .9 .6 5.1 4.0 .2 27.9 4.1 17.8 5.5 4.5 .3 26.2 4.6 13.6 7.5 3.4 – 30.0 3.4 23.3 2.9 2.3 .1 17.6 2.7 10.8 3.3 2.7 .2 16.6 2.7 10.0 3.5 3.5 .2 19.1 3.3 11.1 4.1 4.8 .1 24.0 4.3 13.9 5.3 4.4 .2 32.2 4.9 20.3 6.3 4.3 .1 42.5 4.9 29.5 7.6 3.9 .1 47.6 3.8 36.3 7.3 4.7 24.3 14.2 5.3 5.2 31.0 17.8 6.5 4.0 15.8 9.7 3.8 11.4 50.5 33.4 9.4 8.9 34.9 20.8 7.6 4.3 25.8 15.7 5.1 4.7 22.2 12.7 5.0 4.1 23.1 13.1 5.6 3.2 20.8 11.9 4.5 1.2 12.5 7.4 3.1 3.3 33.9 10.2 2.2 .5 4.6 37.7 12.4 1.5 .6 1.7 29.1 7.5 3.1 .4 6.0 19.2 6.5 .7 .3 4.6 26.4 9.2 1.0 .3 3.4 29.4 9.3 1.5 .4 3.4 37.1 11.7 2.1 .3 2.9 40.6 12.1 3.3 .4 3.2 36.9 9.6 2.9 .5 1.2 19.2 5.1 1.2 .1 Musculoskeletal disorders3 Event or exposure leading to injury or illness: Violence and other injuries by persons or animal ............................................................. Intentional injury by other person ................... Injury by person unintentional or intent unknown ....................................................... Animal and insect related incidents ................ Transportation incidents ................................... Roadway incidents involving motorized land vehicles ......................................................... Fires and explosions ......................................... Falls, slips, trips ................................................ Slips, trips without fall ..................................... Fall on same level ........................................... Fall to lower level ............................................ Exposure to harmful substances or environments .................................................. Contact with object, equipment ........................ Struck by object or equipment ........................ Struck against object or equipment ................ Caught in or compressed by object or equipment ..................................................... Overexertion and bodily reaction ...................... Overexertion in lifting or lowering ................... Repetitive motion involving microtasks ........... All other event or exposures ............................. See footnotes at end of table. TABLE 6. Incidence rates1 for nonfatal occupational injuries and illnesses involving days away from work2 per 10,000 full-time workers by injury or illness characteristics, gender, and age groups, all ownerships, 2015 — Continued Characteristic Total Incidence rate Gender Male Age Female 16-19 20-24 25-34 35-44 45-54 55-64 65 and over Part of body affected by the injury or illness: Head ................................................................. Eye(s) ........................................................... Neck ................................................................. Trunk ................................................................ Back .............................................................. Upper extremities ............................................. Shoulder ....................................................... Arm ............................................................... Wrist ............................................................. Hand ............................................................. Lower extremities ............................................. Knee ............................................................. Ankle ............................................................. Foot .............................................................. Body systems ................................................... Multiple ............................................................. All other parts of body ....................................... 8.5 2.3 1.4 23.3 17.3 32.4 8.4 5.1 3.8 13.0 24.0 9.1 5.4 4.8 2.2 11.5 .7 9.3 3.2 1.3 27.0 19.4 36.2 9.6 5.5 3.1 16.1 26.8 9.8 5.7 5.5 2.3 10.0 .7 7.5 1.1 1.6 18.5 14.6 27.5 6.8 4.6 4.6 9.0 20.5 8.2 4.9 4.0 2.1 13.3 .7 12.5 2.8 .4 13.7 10.5 49.4 4.6 4.8 2.7 35.2 25.5 5.9 5.6 8.7 1.9 6.6 .6 11.6 3.0 1.0 19.9 15.0 32.8 4.3 4.1 3.4 19.7 23.6 6.7 6.4 6.6 2.6 6.1 .6 8.7 2.7 1.3 22.8 18.3 28.4 5.7 4.0 3.3 13.8 21.1 6.6 5.4 4.5 1.9 8.3 .5 8.0 2.4 1.8 25.6 20.0 31.4 8.8 5.0 3.6 11.8 22.3 8.4 5.2 4.3 2.0 10.9 .6 7.5 1.8 1.5 24.4 18.0 34.7 10.2 6.1 4.3 11.2 26.8 10.7 6.0 4.9 2.8 14.3 .8 8.0 1.7 1.4 24.2 15.8 35.7 11.8 6.1 4.5 10.7 28.0 13.1 4.6 5.0 2.0 15.9 .7 9.1 .9 .7 17.4 9.2 26.2 9.1 4.2 3.4 7.4 19.6 9.2 3.5 2.6 1.5 14.5 .3 Source of injury or illness: Chemicals and chemical products .................... Containers ........................................................ Furniture and fixtures ........................................ Machinery ......................................................... Parts and materials ........................................... Person, injured or ill worker .............................. Worker motion or position ............................. Person, other than injured or ill worker ............. Patient .......................................................... Floors, walkways, ground surfaces .................. Handtools ......................................................... Ladder .............................................................. Vehicles ............................................................ Trucks ........................................................... Cart, dolly, hand truck nonpowered .............. All other sources ............................................... 1.3 10.6 4.4 5.4 7.4 16.1 15.1 10.0 5.1 18.2 4.7 2.2 10.5 2.5 1.4 13.3 1.5 12.5 4.0 7.5 11.6 17.5 16.4 6.1 2.0 14.6 6.8 3.2 13.1 4.2 1.4 15.2 1.0 8.3 5.0 2.8 2.0 14.4 13.5 14.9 9.0 23.0 2.0 .8 7.1 .4 1.4 10.7 1.7 14.0 3.7 10.8 7.0 9.5 8.8 6.0 2.7 11.5 13.2 1.3 10.6 1.3 1.4 21.1 1.7 11.2 4.4 7.1 7.4 11.4 10.8 10.8 6.1 10.3 7.3 1.3 9.6 1.5 1.4 15.6 1.1 9.9 3.8 5.1 7.1 13.3 12.5 11.4 5.5 11.6 5.3 1.8 8.9 1.6 1.1 13.4 1.3 11.2 4.0 5.2 7.7 16.8 15.9 11.2 5.5 14.9 4.4 2.2 11.3 2.8 1.5 12.5 1.6 11.6 5.1 5.4 8.2 19.5 18.3 9.9 5.4 20.9 4.1 2.2 11.2 3.1 1.5 13.0 1.1 9.8 5.1 5.5 7.2 19.0 17.9 7.4 4.1 29.4 3.4 2.9 11.9 3.3 1.6 13.0 .5 5.9 4.9 3.0 4.0 11.5 10.3 4.7 2.0 35.0 1.7 2.8 8.9 2.0 1.2 6.1 1 The incidence rates represent the number of injuries and illnesses per 10,000 full-time workers and were calculated as (N/EH) x 20,000,000, where N = number of injuries and illnesses EH = total hours worked by all employees during the calendar year 20,000,000 = base for 10,000 equivalent full-time workers (working 40 hours per week, 50 weeks per year). 2 Days-away-from-work cases include those that resulted in days away from work, some of which also included job transfer or restriction. 3 Musculoskeletal disorders include cases in which the nature of the injury or illness is pinched nerve; herniated disc; meniscus tear; sprains, strains, tears; hernia (traumatic and nontraumatic); pain, swelling, and numbness; carpal or tarsal tunnel syndrome; Raynaud’s syndrome or phenomenon; musculoskeletal system and connective tissue diseases and disorders, and when the event or exposure leading to the injury or illness is overexertion and bodily reaction, unspecified; overexertion involving outside sources; repetitive motion involving microtasks; other and multiple exertions or bodily reactions; and rubbed, abraded, or jarred by vibration. Note: Dash indicates data do not meet publication guidelines. Because of rounding and data exclusion of nonclassifiable responses, data may not sum to the totals. Source: U.S. Bureau of Labor Statistics, Survey of Occupational Injuries and Illnesses, in cooperation with participating state agencies. TABLE 7. Incidence rates1 for nonfatal occupational injuries and illnesses involving days away from work2 per 10,000 full-time workers by selected worker occupation3 and nature of injury or illness, all ownerships, 2015 Nature of injury or illness4 Occupation3 Cuts, Total laceratiincidence Sprains, strains, Fractures ons, rate tears punctures Bruises, contusions Heat burns Chemical burns Total ........................................................................................... 104.0 38.0 8.9 9.6 9.1 1.6 0.3 Police and Sheriffs Patrol Officers ..................................................... Correctional Officers and Jailers ....................................................... Firefighters ......................................................................................... Nursing Assistants ............................................................................. Heating, Air Conditioning, and Refrigeration Mechanics and Installers .......................................................................................... 497.7 420.2 397.5 348.5 187.5 138.8 212.7 187.1 27.2 22.3 8.8 10.8 28.6 28.3 15.7 5.9 45.4 44.8 15.1 31.6 4.3 .7 8.6 .5 – 319.5 93.1 32.5 56.8 29.0 5.4 3.1 Light Truck or Delivery Services Drivers ........................................... Emergency Medical Technicians and Paramedics ............................ Heavy and Tractor-Trailer Truck Drivers ........................................... Laborers and Freight, Stock, and Material Movers, Hand ................. Food Preparation Workers ................................................................ 314.0 313.5 307.5 297.8 290.8 144.8 177.7 132.9 119.9 68.7 20.4 7.6 36.1 23.5 14.8 14.7 5.4 12.6 30.9 94.5 23.0 18.1 26.0 29.2 27.1 1.2 1.5 .9 1.3 24.5 – – 1.1 .9 .9 Sheet Metal Workers ......................................................................... Nonfarm Animal Caretakers .............................................................. Janitors and Cleaners, Except Maids and Housekeeping Cleaners .. Construction Laborers ....................................................................... Maintenance and Repair Workers, General ...................................... 289.9 278.0 277.4 265.3 262.4 117.0 103.0 113.1 72.2 92.9 15.6 6.4 23.3 38.1 23.7 86.5 81.2 20.0 46.1 31.6 11.2 5.1 26.5 18.7 13.9 – – 1.6 1.8 3.3 – – 2.0 1.8 2.6 Maids and Housekeeping Cleaners ................................................... Bus and Truck Mechanics and Diesel Engine Specialists ................. Painters, Construction and Maintenance ........................................... Taxi Drivers and Chauffeurs .............................................................. Automotive Service Technicians and Mechanics .............................. 255.6 246.0 235.9 213.6 207.2 106.2 93.6 82.6 104.2 66.5 14.6 23.8 67.9 14.4 16.2 12.1 24.6 28.1 5.7 34.0 29.8 21.6 17.0 10.1 8.2 .3 1.2 – – 4.0 1.7 – – – .9 Food Servers, Nonrestaurant ............................................................ Landscaping and Groundskeeping Workers ..................................... Plumbers, Pipefitters, and Steamfitters ............................................. Teacher Assistants ............................................................................ Bus Drivers, School or Special Client ................................................ 201.0 194.1 193.7 185.9 185.8 63.7 72.2 58.2 54.3 93.5 11.6 21.1 20.8 12.7 10.3 34.5 25.7 26.0 4.2 2.2 21.8 7.1 6.1 29.9 17.7 11.6 .5 2.1 – – – Cooks, Institution and Cafeteria ........................................................ Chefs and Head Cooks ..................................................................... Counter Attendants, Cafeteria, Food Concession, and Coffee Shop Carpenters ......................................................................................... Laundry and Dry-Cleaning Workers .................................................. 184.9 182.7 182.6 179.6 175.5 54.5 42.0 62.2 42.2 63.9 8.1 5.3 24.0 26.4 6.7 26.2 39.5 19.1 50.8 5.4 21.1 11.7 8.3 5.3 18.6 19.2 28.5 25.2 – 5.8 .8 – – – 1.4 175.3 163.9 158.0 156.8 93.7 41.7 98.1 47.5 9.1 19.5 6.7 8.7 12.8 28.3 3.3 12.7 10.2 7.2 13.0 9.1 – 4.1 – 19.5 – – – – 155.7 65.4 15.4 2.6 14.6 1.5 – 154.4 151.4 149.4 145.6 144.5 75.3 37.1 67.2 29.5 61.6 8.2 9.1 9.4 7.0 7.0 12.0 30.3 3.4 53.4 5.5 19.5 26.7 13.3 9.2 10.2 .2 7.2 1.2 5.0 – – – – 1.6 – Telecommunications Equipment Installers and Repairers, Except Line Installers .................................................................................. Welders, Cutters, Solderers, and Brazers ......................................... Reservation and Transportation Ticket Agents and Travel Clerks .... First-Line Supervisors of Housekeeping and Janitorial Workers ....... First-Line Supervisors of Helpers, Laborers, and Material Movers, Hand ................................................................................................ Stock Clerks and Order Fillers ........................................................... Dining Room and Cafeteria Attendants and Bartender Helpers ........ Personal Care Aides .......................................................................... Dishwashers ...................................................................................... Medical and Clinical Laboratory Technicians .................................... See footnotes at end of table. .6 – – .3 3.6 – – TABLE 7. Incidence rates1 for nonfatal occupational injuries and illnesses involving days away from work2 per 10,000 full-time workers by selected worker occupation3 and nature of injury or illness, all ownerships, 2015 — Continued Nature of injury or illness4 Occupation3 Total ........................................................................................... Police and Sheriffs Patrol Officers ..................................................... Correctional Officers and Jailers ....................................................... Firefighters ......................................................................................... Nursing Assistants ............................................................................. Heating, Air Conditioning, and Refrigeration Mechanics and Installers .......................................................................................... Light Truck or Delivery Services Drivers ........................................... Emergency Medical Technicians and Paramedics ............................ Heavy and Tractor-Trailer Truck Drivers ........................................... Laborers and Freight, Stock, and Material Movers, Hand ................. Food Preparation Workers ................................................................ Amputations Carpal tunnel syndrome Tendonitis 0.5 0.5 0.2 – – – – .8 1.6 – – – – – 1.3 – – – .4 .8 1.1 1.1 1.0 .3 .4 .5 – – – – 1.8 .6 – 1.8 2.2 1.9 .4 Multiple traumatic All Sorenesinjuries other s, pain and natures5 disorders 2.8 16.6 15.8 25.5 21.8 6.1 6.9 87.0 94.0 52.0 72.9 91.1 67.0 78.4 32.3 5.8 39.6 50.9 9.1 3.7 11.2 6.4 3.5 48.7 55.0 46.9 41.5 30.9 50.1 43.0 37.1 40.7 22.4 11.0 29.1 42.9 34.7 38.8 38.5 50.2 41.6 44.7 47.3 Sheet Metal Workers ......................................................................... Nonfarm Animal Caretakers .............................................................. Janitors and Cleaners, Except Maids and Housekeeping Cleaners .. Construction Laborers ....................................................................... Maintenance and Repair Workers, General ...................................... – – .3 1.2 2.3 .7 .3 .7 .4 .2 .2 9.0 – 5.0 5.4 5.0 Maids and Housekeeping Cleaners ................................................... Bus and Truck Mechanics and Diesel Engine Specialists ................. Painters, Construction and Maintenance ........................................... Taxi Drivers and Chauffeurs .............................................................. Automotive Service Technicians and Mechanics .............................. – – – – 6.4 1.0 – – – .6 1.3 – – – – 6.3 6.3 2.1 13.9 1.3 50.1 36.7 19.8 45.2 27.9 32.1 37.1 17.3 19.9 41.0 Food Servers, Nonrestaurant ............................................................ Landscaping and Groundskeeping Workers ..................................... Plumbers, Pipefitters, and Steamfitters ............................................. Teacher Assistants ............................................................................ Bus Drivers, School or Special Client ................................................ – 1.4 1.8 – – – – – – – 6.9 3.6 2.1 5.6 6.5 27.1 24.2 37.7 55.4 41.8 23.4 37.5 34.7 23.6 13.2 Cooks, Institution and Cafeteria ........................................................ Chefs and Head Cooks ..................................................................... Counter Attendants, Cafeteria, Food Concession, and Coffee Shop Carpenters ......................................................................................... Laundry and Dry-Cleaning Workers .................................................. – – – – – – .4 1.2 – – – – – 2.6 23.6 2.6 3.0 7.1 41.2 12.0 17.5 33.8 41.7 10.4 11.5 22.9 16.9 23.5 – 1.0 – – – – – – – – 4.7 1.7 3.4 3.1 23.1 20.0 11.9 40.9 21.6 39.3 21.4 14.5 2.3 – – 4.7 24.8 24.2 .5 – – – 1.4 .3 – – – 2.7 2.6 3.5 4.1 3.7 3.5 18.7 18.4 32.8 10.8 22.1 16.5 18.3 17.8 24.8 30.1 Telecommunications Equipment Installers and Repairers, Except Line Installers .................................................................................. Welders, Cutters, Solderers, and Brazers ......................................... Reservation and Transportation Ticket Agents and Travel Clerks .... First-Line Supervisors of Housekeeping and Janitorial Workers ....... First-Line Supervisors of Helpers, Laborers, and Material Movers, Hand ................................................................................................ Stock Clerks and Order Fillers ........................................................... Dining Room and Cafeteria Attendants and Bartender Helpers ........ Personal Care Aides .......................................................................... Dishwashers ...................................................................................... Medical and Clinical Laboratory Technicians .................................... .6 – .4 – – – – .4 – – – .6 .5 .6 1 The incidence rates represent the number of injuries and illnesses per 10,000 full-time workers and were calculated as (N/EH) x 20,000,000, where N = number of injuries and illnesses EH = total hours worked by all employees during the calendar year 20,000,000 = base for 10,000 equivalent full-time workers (working 40 hours per week, 50 weeks per year). 2 Days-away-from-work cases include those that resulted in days away from work, some of which also included job transfer or restriction. 3 These occupations have at least 0.1% of full-time equivalent employment. 4 Data shown in columns correspond to Nature codes based on the Occupational Injury and Illness Classification System 2.01 developed by the Bureau of Labor Statistics. 5 Includes nonclassifiable responses. Note: Dash indicates data do not meet publication guidelines. Because of rounding and data exclusion of nonclassifiable responses, data may not sum to the totals. Source: U.S. Bureau of Labor Statistics, Survey of Occupational Injuries and Illnesses, in cooperation with participating state agencies. TABLE 8. Incidence rates1 for nonfatal occupational injuries and illnesses involving days away from work2 per 10,000 full-time workers by selected worker occupation3 and events or exposures, all ownerships, 2015 Event or exposure leading to injury or illness4 Overexertion and bodily reaction Occupation3 Total incidence rate Contact with objects Falls, Slips, Trips Total Overexertion in lifting lowering Repetitive motion Exposure to harmful substances or environments Transportation incidents Total Roadway incidents Total ........................................................................................... 104.0 24.3 27.9 33.9 10.2 2.2 4.7 5.7 4.0 Police and Sheriffs Patrol Officers ..................................................... Correctional Officers and Jailers ....................................................... Firefighters ......................................................................................... Nursing Assistants ............................................................................. Heating, Air Conditioning, and Refrigeration Mechanics and Installers .......................................................................................... 497.7 420.2 397.5 348.5 42.4 50.5 53.4 31.0 108.8 100.4 102.8 64.7 98.8 93.9 189.3 186.3 10.5 13.1 44.6 42.5 2.0 2.5 – 1.7 23.8 18.1 28.8 5.6 78.4 6.6 6.1 2.8 66.1 3.1 4.4 2.6 319.5 111.8 88.7 87.7 21.3 3.3 18.1 8.2 7.5 Light Truck or Delivery Services Drivers ........................................... Emergency Medical Technicians and Paramedics ............................ Heavy and Tractor-Trailer Truck Drivers ........................................... Laborers and Freight, Stock, and Material Movers, Hand ................. Food Preparation Workers ................................................................ 314.0 313.5 307.5 297.8 290.8 42.3 33.9 52.1 102.9 133.1 82.8 40.3 101.1 55.8 71.0 144.4 193.7 97.0 115.3 54.5 47.7 95.0 21.4 49.5 26.7 2.0 1.9 1.8 5.0 5.5 4.2 8.2 4.3 5.2 29.3 36.7 21.2 48.0 14.6 1.0 30.3 18.8 40.7 2.5 – Sheet Metal Workers ......................................................................... Nonfarm Animal Caretakers .............................................................. Janitors and Cleaners, Except Maids and Housekeeping Cleaners .. Construction Laborers ....................................................................... Maintenance and Repair Workers, General ...................................... 289.9 278.0 277.4 265.3 262.4 124.5 22.7 62.0 102.8 75.1 27.5 27.5 79.8 59.3 69.6 107.6 116.5 106.9 70.4 92.7 28.6 19.2 36.8 20.6 28.2 – 2.3 3.3 2.0 2.8 2.5 6.5 19.0 14.0 14.8 – – 4.8 16.0 7.3 – – 2.8 6.8 4.6 Maids and Housekeeping Cleaners ................................................... Bus and Truck Mechanics and Diesel Engine Specialists ................. Painters, Construction and Maintenance ........................................... Taxi Drivers and Chauffeurs .............................................................. Automotive Service Technicians and Mechanics .............................. 255.6 246.0 235.9 213.6 207.2 49.1 83.9 65.3 10.7 90.4 83.3 42.9 116.8 54.9 20.0 103.0 95.1 49.0 71.8 79.4 27.8 25.3 13.6 44.3 29.7 5.3 2.0 4.2 – 2.7 12.0 7.9 2.4 1.2 5.9 3.8 11.4 – 66.3 8.8 3.4 5.2 – 62.6 3.8 Food Servers, Nonrestaurant ............................................................ Landscaping and Groundskeeping Workers ..................................... Plumbers, Pipefitters, and Steamfitters ............................................. Teacher Assistants ............................................................................ Bus Drivers, School or Special Client ................................................ 201.0 194.1 193.7 185.9 185.8 66.3 63.1 56.1 23.9 14.2 66.0 44.6 44.4 64.9 60.4 50.3 54.9 72.1 35.3 43.9 18.9 19.4 15.3 9.6 5.7 1.1 1.5 2.7 – 1.3 14.5 9.4 12.1 .5 1.8 – 13.1 5.1 2.8 58.5 – 6.5 4.6 2.5 50.2 Cooks, Institution and Cafeteria ........................................................ Chefs and Head Cooks ..................................................................... Counter Attendants, Cafeteria, Food Concession, and Coffee Shop Carpenters ......................................................................................... Laundry and Dry-Cleaning Workers .................................................. 184.9 182.7 182.6 179.6 175.5 49.8 60.5 35.3 80.2 37.5 55.8 43.8 66.2 49.7 43.4 53.2 44.6 51.5 41.3 75.7 21.7 15.0 17.4 14.5 16.8 2.0 – 6.6 2.0 4.7 22.0 28.4 27.2 3.2 17.0 .9 1.4 1.4 2.3 – – – – 1.2 – 175.3 163.9 158.0 156.8 26.2 77.1 26.8 33.0 45.9 35.6 42.5 38.3 75.2 36.2 81.3 50.0 8.7 13.6 41.6 18.0 1.8 2.3 2.3 2.0 6.9 11.8 1.8 3.2 13.4 1.4 – 21.8 12.1 – – 2.1 155.7 43.6 37.5 63.5 19.7 – 2.8 8.1 1.1 154.4 151.4 149.4 145.6 144.5 44.7 65.5 11.8 79.9 19.4 25.9 34.8 36.0 25.0 42.8 75.1 37.9 56.1 24.5 62.3 38.2 16.1 18.5 10.0 8.9 5.1 1.5 .7 1.9 17.1 2.3 11.2 3.0 14.2 12.7 4.4 – 9.2 1.6 2.8 .6 – 7.7 – 2.6 Telecommunications Equipment Installers and Repairers, Except Line Installers .................................................................................. Welders, Cutters, Solderers, and Brazers ......................................... Reservation and Transportation Ticket Agents and Travel Clerks .... First-Line Supervisors of Housekeeping and Janitorial Workers ....... First-Line Supervisors of Helpers, Laborers, and Material Movers, Hand ................................................................................................ Stock Clerks and Order Fillers ........................................................... Dining Room and Cafeteria Attendants and Bartender Helpers ........ Personal Care Aides .......................................................................... Dishwashers ...................................................................................... Medical and Clinical Laboratory Technicians .................................... See footnotes at end of table. TABLE 8. Incidence rates1 for nonfatal occupational injuries and illnesses involving days away from work2 per 10,000 full-time workers by selected worker occupation3 and events or exposures, all ownerships, 2015 — Continued Event or exposure leading to injury or illness4 Violence and other injuries by persons or animal Fires and explosions Total Total ........................................................................................... 0.2 6.8 3.1 2.3 1.3 0.5 Police and Sheriffs Patrol Officers ..................................................... Correctional Officers and Jailers ....................................................... Firefighters ......................................................................................... Nursing Assistants ............................................................................. Heating, Air Conditioning, and Refrigeration Mechanics and Installers .......................................................................................... .8 – 10.0 – 140.4 147.5 4.6 56.3 51.2 72.3 – 34.5 76.1 71.0 2.3 17.0 12.8 1.2 2.2 4.6 4.4 3.3 2.6 1.8 – 1.2 – – 1.1 3.5 Light Truck or Delivery Services Drivers ........................................... Emergency Medical Technicians and Paramedics ............................ Heavy and Tractor-Trailer Truck Drivers ........................................... Laborers and Freight, Stock, and Material Movers, Hand ................. Food Preparation Workers ................................................................ – – 2.7 15.5 2.3 1.9 .5 .4 6.3 .3 .3 – – 8.8 .1 .3 .3 2.2 – 1.8 1.2 – .9 – 2.0 1.6 1.2 Sheet Metal Workers ......................................................................... Nonfarm Animal Caretakers .............................................................. Janitors and Cleaners, Except Maids and Housekeeping Cleaners .. Construction Laborers ....................................................................... Maintenance and Repair Workers, General ...................................... – – – – – – – 102.5 2.1 1.4 1.2 – – 1.8 .8 1.1 Maids and Housekeeping Cleaners ................................................... Bus and Truck Mechanics and Diesel Engine Specialists ................. Painters, Construction and Maintenance ........................................... Taxi Drivers and Chauffeurs .............................................................. Automotive Service Technicians and Mechanics .............................. – Food Servers, Nonrestaurant ............................................................ Landscaping and Groundskeeping Workers ..................................... Plumbers, Pipefitters, and Steamfitters ............................................. Teacher Assistants ............................................................................ Bus Drivers, School or Special Client ................................................ – – – – – Cooks, Institution and Cafeteria ........................................................ Chefs and Head Cooks ..................................................................... Counter Attendants, Cafeteria, Food Concession, and Coffee Shop Carpenters ......................................................................................... Laundry and Dry-Cleaning Workers .................................................. Occupation3 .7 .5 – .2 .4 – 102.8 2.9 1.6 1.6 Intentional injury by other person Injury by person-unintentional or intent unknown .6 All other events5 .3 – – 3.4 3.6 1.5 8.8 .5 .7 – – 2.9 – .3 – – – – 2.4 2.7 – 5.2 .4 1.0 – – – .7 1.5 8.2 1.1 56.6 6.8 .9 .3 – 34.0 4.2 – – – 21.6 1.6 – 7.8 1.1 .2 1.1 – – 3.5 – – – 1.7 – 1.0 .6 1.6 1.5 – – – – – – 1.0 – – – – – 1.3 – – 1.9 – – 1.2 – – 7.6 – 3.9 10.3 – – – – – – 1.5 – 7.3 – 1.7 9.4 – – – – .2 – 9.8 – – .6 – 1.6 – – – .8 – – 1.5 – .2 Animal and insect related Telecommunications Equipment Installers and Repairers, Except Line Installers .................................................................................. Welders, Cutters, Solderers, and Brazers ......................................... Reservation and Transportation Ticket Agents and Travel Clerks .... First-Line Supervisors of Housekeeping and Janitorial Workers ....... First-Line Supervisors of Helpers, Laborers, and Material Movers, Hand ................................................................................................ – – – Stock Clerks and Order Fillers ........................................................... Dining Room and Cafeteria Attendants and Bartender Helpers ........ Personal Care Aides .......................................................................... Dishwashers ...................................................................................... Medical and Clinical Laboratory Technicians .................................... – – – – – 1.6 1.2 32.9 – 3.2 .8 .8 21.2 – 1.8 .6 1.6 .9 2.8 1.9 – .5 – – .4 – .5 – – 1 The incidence rates represent the number of injuries and illnesses per 10,000 full-time workers and were calculated as (N/EH) x 20,000,000, where N = number of injuries and illnesses EH = total hours worked by all employees during the calendar year 20,000,000 = base for 10,000 equivalent full-time workers (working 40 hours per week, 50 weeks per year). 2 Days-away-from-work cases include those that resulted in days away from work, some of which also included job transfer or restriction. 3 These occupations have at least 0.1% of full-time equivalent employment. 4 Data shown in columns correspond to Event codes based on the Occupational Injury and Illness Classification System 2.01 developed by the Bureau of Labor Statistics. 5 Includes nonclassifiable responses. Note: Dash indicates data do not meet publication guidelines. Because of rounding and data exclusion of nonclassifiable responses, data may not sum to the totals. Source: U.S. Bureau of Labor Statistics, Survey of Occupational Injuries and Illnesses, in cooperation with participating state agencies. TABLE 9. Number, incidence rate1, and median days2 away from work for nonfatal occupational injuries and illnesses involving days away from work3 and musculoskeletal disorders4 by selected worker occupation5 and ownership, 2015 Musculoskeletal disorders (MSDs) Total private, state, and local government6,7,8 Private industry6,7,8 Occupation Incidence Number rate Median days away from work Incidence Number rate Median days away from work Total ........................................................................................... 356,910 32.2 12 286,350 29.8 12 Laborers and freight, stock, and material movers, hand ................... Nursing assistants ............................................................................. Janitors and cleaners, except maids and housekeeping cleaners .... Heavy and tractor-trailer truck drivers ............................................... Light truck or delivery services drivers .............................................. 21,990 19,360 15,810 15,320 10,730 111.0 180.5 102.6 95.6 135.9 11 6 10 30 14 20,990 16,860 6,730 14,900 10,040 107.4 171.0 57.3 94.0 128.3 11 6 12 30 17 Registered nurses ............................................................................. Maintenance and repair workers, general ......................................... Stock clerks and order fillers ............................................................. Retail salespersons ........................................................................... Production workers, all other ............................................................. 10,290 10,290 10,150 8,920 7,860 48.1 90.0 73.2 27.1 – 9 15 11 13 12 8,530 7,210 10,010 8,660 7,830 46.8 75.9 73.2 26.2 – 9 13 11 12 11 Maids and housekeeping cleaners .................................................... Firefighters ......................................................................................... First-line supervisors of retail sales workers ...................................... Personal care aides ........................................................................... Police and sheriffs patrol officers ....................................................... 6,680 5,630 5,550 5,290 5,270 98.0 168.5 50.0 54.0 88.4 10 10 10 9 12 6,230 30 5,510 4,830 20 94.4 24.0 49.7 49.8 42.2 10 15 10 9 19 Construction laborers ........................................................................ Assemblers and fabricators, all other ................................................ Automotive service technicians and mechanics ................................ Emergency medical technicians and paramedics ............................. Landscaping and groundskeeping workers ....................................... 5,150 4,500 4,430 3,980 3,820 68.4 – 77.0 187.4 52.3 15 13 17 9 8 4,540 4,490 4,290 2,600 2,380 62.7 – 77.3 181.6 37.0 13 13 17 8 10 Cargo and freight agents ................................................................... Correctional officers and jailers ......................................................... Driversales workers ........................................................................... Home health aides ............................................................................. Cashiers ............................................................................................ 3,730 3,160 3,110 2,980 2,980 – 82.5 – 47.7 13.9 21 16 19 11 10 3,720 140 3,110 2,940 2,900 539.4 80.3 77.4 47.9 13.7 21 7 19 11 10 Bus drivers, transit and intercity ........................................................ Teacher assistants ............................................................................ Food preparation workers .................................................................. Licensed practical and licensed vocational nurses ............................ Plumbers, pipefitters, and steamfitters .............................................. 2,860 2,830 2,830 2,570 2,490 – 33.7 51.9 47.4 70.3 20 6 10 10 80 670 600 2,440 2,140 2,340 113.8 32.9 47.3 43.8 69.3 12 2 8 8 84 Installation, maintenance, and repair workers, all other .................... Customer service representatives ..................................................... Shipping, receiving, and traffic clerks ................................................ Telecommunications line installers and repairers .............................. Bus and truck mechanics and diesel engine specialists .................... 2,470 2,450 2,200 2,190 2,160 – 12.0 38.5 224.6 90.7 25 15 4 52 30 2,160 2,420 2,200 2,170 1,390 – 12.2 38.6 224.3 67.9 25 15 4 52 30 See footnotes at end of table. TABLE 9. Number, incidence rate1, and median days2 away from work for nonfatal occupational injuries and illnesses involving days away from work3 and musculoskeletal disorders4 by selected worker occupation5 and ownership, 2015 — Continued Musculoskeletal disorders (MSDs) State government7,8 Local government7,8 Occupation Incidence Number rate Median days away from work Incidence Number rate Median days away from work Total ........................................................................................... 16,380 41.0 15 54,190 50.2 10 Laborers and freight, stock, and material movers, hand ................... Nursing assistants ............................................................................. Janitors and cleaners, except maids and housekeeping cleaners .... Heavy and tractor-trailer truck drivers ............................................... Light truck or delivery services drivers .............................................. 70 880 1,090 20 30 85.4 291.4 183.8 – – 19 8 21 21 45 930 1,620 7,990 400 660 403.1 283.0 260.8 199.9 938.6 24 6 10 33 10 Registered nurses ............................................................................. Maintenance and repair workers, general ......................................... Stock clerks and order fillers ............................................................. Retail salespersons ........................................................................... Production workers, all other ............................................................. 860 630 80 250 73.3 145.1 75.1 – – 14 14 8 60 – 890 2,460 60 – 20 43.9 165.1 47.9 – – 7 19 41 – 18 120 40 245.0 33.1 – 270.6 129.4 20 47 – 9 16 340 5,560 – 100 4,340 173.7 189.4 – 104.7 86.2 9 10 – 9 11 25 – 34 – 7 520 280 – – 95.8 – 215.3 192.0 – 55.3 214.9 156.0 16 – 6 9 8 – 2,500 – – 40 – 105.9 – – 55.0 – 19 – – 6 – 30 50 – 36.9 – 62.4 21.8 – 8 – 86 5 240 – – 321.9 126.5 71.4 22 – 14 16 31 1,950 2,220 270 150 120 372.3 36.5 107.4 48.5 91.7 21 8 10 18 3 – 7.7 – – 352.6 15 30 – – 44 280 – – – – 213.7 32 – – 51 19 Maids and housekeeping cleaners .................................................... Firefighters ......................................................................................... First-line supervisors of retail sales workers ...................................... Personal care aides ........................................................................... Police and sheriffs patrol officers ....................................................... Construction laborers ........................................................................ Assemblers and fabricators, all other ................................................ Automotive service technicians and mechanics ................................ Emergency medical technicians and paramedics ............................. Landscaping and groundskeeping workers ....................................... Cargo and freight agents ................................................................... Correctional officers and jailers ......................................................... Driversales workers ........................................................................... Home health aides ............................................................................. Cashiers ............................................................................................ Bus drivers, transit and intercity ........................................................ Teacher assistants ............................................................................ Food preparation workers .................................................................. Licensed practical and licensed vocational nurses ............................ Plumbers, pipefitters, and steamfitters .............................................. Installation, maintenance, and repair workers, all other .................... Customer service representatives ..................................................... Shipping, receiving, and traffic clerks ................................................ Telecommunications line installers and repairers .............................. Bus and truck mechanics and diesel engine specialists .................... – – 360 910 90 – 60 – – 120 270 30 30 20 – – 140 – 80 1,390 1,160 520 – – – 20 630 1 The incidence rates represent the number of injuries and illnesses per 10,000 full-time workers and were calculated as (N/EH) x 20,000,000, where N = number of injuries and illnesses EH = total hours worked by all employees during the calendar year 20,000,000 = base for 10,000 equivalent full-time workers (working 40 hours per week, 50 weeks per year). 2 Median days away from work is the measure used to summarize the varying lengths of absences from work among the cases with days away from work. Half the cases involved more days and half involved fewer days than a specified median. Median days away from work are represented in actual values. 3 Days-away-from-work cases include those that resulted in days away from work, some of which also included job transfer or restriction. 4 Musculoskeletal disorders include cases in which the nature of the injury or illness is pinched nerve; herniated disc; meniscus tear; sprains, strains, tears; hernia (traumatic and nontraumatic); pain, swelling, and numbness; carpal or tarsal tunnel syndrome; Raynaud’s syndrome or phenomenon; musculoskeletal system and connective tissue diseases and disorders, and when the event or exposure leading to the injury or illness is overexertion and bodily reaction, unspecified; overexertion involving outside sources; repetitive motion involving microtasks; other and multiple exertions or bodily reactions; and rubbed, abraded, or jarred by vibration. 5 Selected occupations ranked in descending musculoskeletal disorder count for private, State, and local government. 6 Excludes farms with fewer than 11 employees. 7 Data for Mining (Sector 21 in the North American Industry Classification System United States, 2012) include establishments not governed by the Mine Safety and Health Administration rules and reporting, such as those in Oil and Gas Extraction and related support activities. Data for mining operators in coal, metal, and nonmetal mining are provided to BLS by the Mine Safety and Health Administration, U.S. Department of Labor. Independent mining contractors are excluded from the coal, metal, and nonmetal mining industries. These data do not reflect the changes the Occupational Safety and Health Administration made to its recordkeeping requirements effective January 1, 2002; therefore, estimates for these industries are not comparable to estimates in other industries. 8 Data for employers in rail transportation are provided to BLS by the Federal Railroad Administration, U.S. Department of Transportation. Note: Dash indicates data do not meet publication guidelines. Because of rounding and data exclusion of nonclassifiable responses, data may not sum to the totals. Source: U.S. Bureau of Labor Statistics, Survey of Occupational Injuries and Illnesses, in cooperation with participating state agencies.
© Copyright 2026 Paperzz