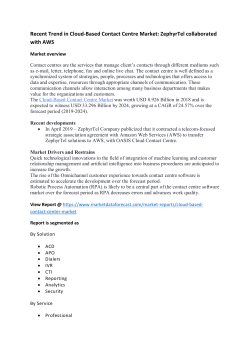
Virginia’s Current Budget Issues Presentation for the FOCUS Conference Richard D. Brown Secretary of Finance April 30, 2014 2012-2014 Operating Budget General Fund vs. Nongeneral Fund General Fund 40.8% Nongeneral Fund 59.2% Data from 2013 Reconvened Session House Bill 1500 Re-enrolled 2 General Fund Revenues for 2012-2014 Economic trends are important because employment, wage gains, and consumer spending account for about 87.4% of all general fund revenues. 2012-2014 general fund revenues = $33.4 billion Individual income tax 68.1% Sales & use taxes 19.3% Corporate income tax 5.0% Other taxes & revenue 7.6% Data does not include transfers or balances. Data from 2013 Reconvened Session HB 1500 Re-enrolled 3 Nongeneral Fund Revenues for 2012-2014 Federal grants account for over 37% of all nongeneral funds revenue Institutional revenue from higher education tuition & fees and hospitals 25% Transportation 10.4% Other revenue 27.7% Federal grants & contracts 37.1% 2012-2014 nongeneral fund revenues = $50.3 billion “Transportation” includes fuel tax, sales tax, motor vehicle sales tax, and motor vehicle licenses. Data does not include balances or bond proceeds. Data from 2013 Reconvened Session HB 1500 Re-enrolled. 4 Where the Money Goes 2012-2014 (All Funds) = $86.0 Billion 78.6% of the budget (all funds) goes to education, health and human resources, and transportation Other 3.8% Transporation 11.8% Public Safety 6.0% Health and Human Resources 28.9% General Government 9.4% Commerce and Trade 2.2% Education 37.8% “Other” includes legislative and judicial branches, technology, agriculture and forestry, natural resources, independent agencies and non-state agencies. “General Government” category includes administration, finance, executive offices, central appropriations and Veterans Affairs and Homeland Security. Source: 2013 Session HB 1500 Re-enrolled (operating only) 5 Where the Money Goes 2012-2014 (GF Funds) = $35 Billion 78.9% of the general fund budget goes to education, health and human resources, and public safety $ in billions General Government 14.9% Commerce & Trade 1.0% Other $1.2 4% Public Safety 10.3% Education 40.2% Transportation 0.4% Health & Human Resources 28.6% “Other” includes legislative and judicial branches, technology, agriculture and forestry, natural resources, independent agencies and non-state agencies. “General Government” category includes administration, finance, executive offices, central appropriations and Veterans Affairs and Homeland Security. Source: 2013 Session HB 1500 Re-enrolled (operating only) 6 Over 40% of the General Fund Operating Budget Goes to Localities Total GF Operating $35.0 Billion $ in billions State Programs $9.9 28.2% Aid to Localities $15.1 43.1% Debt Service $1.2 3.5% Aid to individuals $8.8 25.1% Public Education $10.5 69.6% Car Tax $1.9 12.4% Local Sheriffs $0.8 5.4% Other Aid to Localities $1.9 12.4% Source: Department of Planning and Budget April 2013. Data from HB 1500 Re-enrolled (operating only) 7 Calendar Effects Throughout Fiscal Year 2013 Led to a Roller Coaster for Monthly Revenue • Total general fund revenue collections exceeded the forecast by $263.6 million in fiscal year 2013, a forecast variance of 1.6 percent. Total revenues rose 5.3 percent, ahead of the revised annual forecast of 3.6 percent growth. – Adjusting for the accelerated sales tax (AST) program, total revenues grew 5.1 percent, ahead of the economic-base forecast of 3.4 percent growth. 8 Fiscal Year 2013 Revenues and Transfers Finished $264.3 Million (1.6 Percent) Above Forecast Summary of Fiscal Year 2013 Revenue Collections (millions of dollars) Major Source Withholding Nonwithholding Refunds Net Individual Forecast $ 10,366.3 2,517.6 (1,791.3) 11,092.6 Sales Corporate Wills (Recordation) Insurance All Other Revenue Total Revenues 3,248.8 820.9 336.5 255.6 666.6 3,219.8 796.7 377.5 262.2 688.4 $ 16,421.0 $ 16,684.6 66.6 222.8 134.5 68.0 221.4 135.2 ABC Profits Sales Tax (0.25%) Transfers Total Transfers $ 423.9 Total General Fund $ 16,844.9 • Actual $ 10,251.3 2,807.7 (1,719.1) 11,340.0 $ Variance % Growth Over FY12 Dollars Percent Forecast Actual $ (115.0) (1.1) % 3.3 % 2.1 % 290.1 11.5 6.8 19.1 72.2 (4.0) 0.4 (3.7) 247.4 2.2 4.5 6.9 (29.0) (24.2) 41.0 6.6 21.8 $ 263.6 1.4 (1.4) 0.7 (0.9) (2.9) 12.2 2.6 3.3 4.1 (4.5) 4.5 1.1 (1.6) 1.6 % 2.1 (0.6) 0.5 424.6 $ 0.7 0.2 % $ 17,109.2 $ 264.3 1.6 % 3.6 % 4.4 4.1 (39.8) 3.1 (7.3) 17.2 3.7 1.6 5.3 % 6.6 3.4 (39.5) (15.4) % (15.3) % Total revenues are 5.7% above the previous peak year of fiscal year 2008. 3.0 % 4.7 % 9 Why is Federal Fiscal Policy Important? Virginia’s Ranking Among the States for Per Capita Amounts of Federal Government Expenditures Fiscal Year 2009 Category Rank (Highest=1) Retirement and Disability 5 Other Direct Payments 39 Grants 49 Procurement 1 Salaries and Wages 4 Total Expenditures 2 10 The Fall 2013 Consensus Forecasting Process • The Joint Advisory Board of Economists (JABE) met in October. – Members were presented the September standard economic outlook, a forecast that was moderately weaker than the official economic forecast. – A majority of JABE members supported the standard outlook; however, most members felt more comfortable lowering Virginia’s employment growth to 1.0 percent in FY14. The members also unanimously approved of maintaining a key assumption that Virginia would underperform the nation. – The October standard outlook was adjusted consistent with these concerns – specifically lowering employment and wages and salary growth in FY14.15 Key Virginia Economic Indicators Official and November Forecasts Annual Percent Change Fiscal Year 13 14 11 12 Employment Official (Nov '12) Nov Standard 15 16 1.0 1.6 1.2 1.3 1.4 1.0 2.0 1.5 2.0 1.7 Personal Income Official (Nov '12) Nov Standard 5.6 4.0 3.4 3.0 4.1 2.9 4.6 4.3 4.7 4.4 Wages & Salaries Official (Nov '12) Nov Standard 3.6 2.6 3.7 3.0 3.9 2.6 4.4 4.0 4.2 4.2 Average Wage Official (Nov '12) Nov Standard 2.5 1.0 2.5 1.7 2.5 1.6 2.3 2.5 2.2 2.5 As a result, the November 2013 Virginia Economic Outlook for FY14-16 remains a low growth forecast that is weaker than last year’s official forecast. 11 A Concern in Withholding is the Softness in Federal Contractors, Professional and Business Services and the Public Sector Withholding Tax Collections Year-to-Date December Industry (% of Total $ Amount) Public Sector (19%) Education and Health Services (7%) Federal Contractors (5%) Professional and Business Services (3%) Finance (3%) Investment (1%) Manufacturing (2%) Transportation (1%) Energy (1%) Other (4%) # of Firms in FY14 92 240 189 134 526 147 167 41 47 704 Millions of Dollars FY12 FY13 FY14 $1,063.2 $1,106.0 $1,099.0 $439.2 $441.5 $450.3 $276.3 $274.2 $253.3 $142.0 $175.4 $169.6 $132.8 $156.5 $156.9 $76.3 $89.6 $102.4 $67.6 $73.8 $80.6 $55.3 $61.6 $65.3 $55.9 $50.5 $49.6 $249.7 $256.1 $252.1 Total Large Payers (45%) 2,287 $2,558.3 $2,685.3 $2,679.1 Total Small Payers (55%) 227,858 $3,135.6 $3,240.8 $3,401.4 Total All 230,145 $5,693.9 $5,926.1 $6,080.5 * Makes payments in excess of $110,000. * Number in parentheses represents percent of total DOA withholding collections in FY13. Percent Change FY13 FY14 4.0% -0.6% 0.5% 2.0% -0.7% -7.6% 23.5% -3.3% 17.9% 0.2% 17.5% 14.3% 9.1% 9.2% 11.3% 6.0% -9.6% -1.9% 2.6% -1.6% 5.0% 3.4% 4.1% -0.2% 5.0% 2.6% 12 FY2014 January Year-To-Date Revenues Percent Growth over Prior Year Major Source Withholding Nonwithholding Refunds Net Individual As a % of Total Revenues 62.4 % 17.6 (10.6) 69.3 Sales Corporate Wills (Recordation) Insurance All Other Revenue Total 18.1 4.7 2.2 1.7 3.9 100.0 % YTD Annual Feb-June Req'd Prior Year Actual Estimate Variance to Meet Est. Feb-June 2.5 % 3.3 % (0.8) % 4.4 % (0.5) % (3.8) 6.3 (10.1) 11.8 22.1 26.0 5.1 20.9 1.8 2.2 0.7 3.7 (3.0) 8.1 6.3 (3.8) (14.5) (11.2) 176.8 (1.9) (4.4) 0.4 0.0 10.4 (3.8) 0.6 (14.9) (11.2) 166.4 1.9 (5.1) 15.6 14.7 (13.9) (5.4) 2.0 (18.2) 16.4 16.7 3.1 (0.5) % 1.7 % (2.2) % 4.6 % 4.1 % Sales (x HB2313) 1.4 % 1.6 % (0.2) % 2.0 % 2.0 % Total (x HB2313) 0.5 % 2.9 % (2.4) % 6.1 % 4.1 % 13 The February Mid-Session Revenue Review • The mid-session revenue review involves an analysis of two elements: – Updated economic information; and – Actual revenue collections for the first seven months of the current fiscal year. Economic Outlook • The January economic outlook remained one of modest growth. – Slightly more optimistic than the November outlook, which underpins the revenue forecast in the introduced budget. • Real GDP is now expected to grow 2.5 percent in FY2014 vs 2.1 percent in November. • Virginia employment growth is now expected to be 1.2 percent in FY2014 vs. 1.0 percent in November. • Wages and salaries are anticipated to increase 2.3 percent in FY2014 vs. 2.6 percent in November. – There are no significant changes to the economic outlook over the next biennium. • The major downside risk is that the combination of unwarranted fiscal tightening and a bleak global outlook could stall U.S. Economic growth. 14 Mid-Session Revenue Review Conclusion • Two consecutive months of disappointing national job growth illustrate the fragility in the economic recovery. • Bottom line, there is no compelling economic basis to revise the revenue forecast upward. • However, a collections-based analysis has led to a different conclusion that the revenue estimate should be reduced. 15 February Mid-Session Forecast Revisions Address Sources Trailing Their Targets Summary of Reforecast for Fiscal Year 2014 (millions of dollars) Major Source Personal Income Tax: Withholding Nonwithholding Refunds Net Individual Sales Increase No Change -$35.0 -$60.0 $0.0 -$95.0 $0.0 Corporate Wills (Recordation) Insurance All Other Revenue Decrease -$30.0 (Refunds) $0.0 $0.0 $0.0 Total -$125.0 • Withholding and nonwithholding are trailing their annual estimates. • Corporate refunds in July to December exceeded expectations. • In total, year-to-date collection trends support lowering the December forecast by $125.0 million in fiscal year 2014. For the next biennium, downward revisions total $15.0 million in fiscal year 2015 in withholding. 16 February Mid-Session Forecast Revisions Lower Fiscal Year 2014 Withholding and Total Revenue Growth Rates A Comparison of Growth Rates (percent change) FY14 FY15 FY16 3.3 4.3 4.2 2.9 4.5 4.3 Withholding December Mid-Session Nonwithholding December Mid-Session 6.3 4.2 7.4 9.6 5.9 5.9 Corporate December Mid-Session 0.4 (3.4) 2.1 6.1 0.7 0.7 Total Revenue December Mid-Session 1.7 1.0 4.2 4.9 3.9 4.0 17 Summary of Fiscal Year 2014 Revenue Collections July through February Percent Growth over Prior Year Major Source Withholding Nonwithholding Refunds Net Individual As a % of Total Revenues 62.6 % 17.4 (10.7) 69.3 Sales Corporate Wills (Recordation) Insurance All Other Revenue Total 18.3 4.6 2.2 1.7 3.9 100.0 % YTD Annual Mar-June Req'd Prior Year Actual Estimate Variance to Meet Est. Mar-June 3.0 % 2.9 % 0.1 % 2.8 % 0.9 % (2.7) 4.2 (6.9) 8.2 23.5 13.5 5.1 8.4 (0.2) 2.1 1.1 2.9 (1.8) 5.8 8.9 (4.9) (10.8) (14.2) 38.1 (0.3) (4.4) (3.4) 0.0 10.4 (3.8) (0.5) (7.4) (14.2) 27.7 3.5 (3.5) 4.0 25.2 4.6 (8.7) 0.5 (14.4) 15.5 (4.6) 3.4 (0.8) % 1.0 % (1.8) % 3.7 % 4.9 % Sales (x HB2313) 0.3 % 1.6 % (1.3) % 4.3 % 0.3 % Total (x HB2313) 0.3 % 2.1 % (1.8) % 5.2 % 5.0 % 18 Growth in Total General Fund Revenue Collections FY14 Monthly and Year-to-Date 14% 13.0% 12% 10% 8% 6% Forecast: 1.0% 2.8% 4% 2% 3.0% 0% 0.6% 0.7% 0.7% -2% -0.5% -0.8% 0.0% -4% -6% -8% Monthly Year-to-Date -10% Monthly Growth: Jul Aug Sep Oct Nov Dec Jan Feb Mar 13.0% -4.8% 2.6% -5.4% 1.1% 0.8% -5.9% -3.4% 7.8% Apr May Jun • Total general fund revenues increased 7.8 percent in March due to individual and corporations making final payments for tax year 2013 ahead of the due date and fewer individual income tax refunds being issued. • On a year-to-date basis, total revenues were flat, trailing the annual forecast of 1.0 percent growth. – Adjusting for AST and the HB2313 program, total revenues grew 1.1 percent through March, behind the economic-base forecast of 2.1 percent growth. 19 Issues Affecting the Future Looking Ahead 20 Total General Fund Revenues Annual Percent Change 20% 15% 10% 5% 0% -5% -10% -15% 80 81 82 83 84 85 86 87 88 89 90 91 92 93 94 95 96 97 98 99 '00 '01 '02 '03 '04'05 '06 '07 '08 '09 10 11 12 13 14*15*16* * February 10, 2014 Midsession Forecast (Excludes Transfers) 21 Growth in Total General Fund Revenues Fiscal Year 1961 - Fiscal Year 2016 (Nominal - Actual Dollars) FY Total Revenues Growth FY Total Revenues Growth 61 230,998,887 - 89 5,478,912,000 8.4% 62 242,144,567 4.8% 90 5,494,884,000 0.3% 63 64 286,304,265 18.2% 91 5,471,879,000 -0.4% 298,033,919 4.1% 92 5,623,213,000 2.8% 65 323,213,412 8.4% 93 6,133,637,000 9.1% 66 365,129,776 13.0% 94 6,503,368,000 6.0% 67 414,755,644 13.6% 95 6,881,145,000 5.8% 68 533,597,744 28.7% 96 7,356,110,000 6.9% 69 706,254,374 32.4% 97 7,949,327,000 8.1% 70 743,721,322 5.3% 98 8,773,520,000 10.4% 71 807,954,651 8.6% 99 9,702,747,000 10.6% 72 922,653,686 14.2% 00 10,788,482,000 11.2% 73 1,054,469,443 14.3% 01 11,105,275,000 2.9% 74 1,168,562,871 10.8% 02 10,678,954,000 -3.8% 75 1,303,178,893 11.5% 03 10,867,149,000 1.8% 76 1,428,421,157 9.6% 04 11,917,867,000 9.7% 77 1,636,301,819 14.6% 05 13,687,252,000 14.8% 78 1,923,085,084 17.5% 06 14,834,298,000 8.4% 79 2,115,211,522 10.0% 07 15,565,827,000 4.9% 80 2,344,928,934 10.9% 08 15,766,951,000 1.3% 81 2,579,663,941 10.0% 09 14,315,060,000 -9.2% 82 2,796,458,741 8.4% 10 14,219,477,000 -0.7% 83 2,975,687,935 6.4% 11 15,040,200,000 5.8% 84 3,397,710,261 14.2% 12 15,846,665,000 5.4% 85 3,790,816,000 11.6% 13 16,684,600,000 5.3% 86 4,131,778,000 9.0% 14* 16,845,900,000 1.0% 87 4,590,434,000 11.1% 15* 17,671,100,000 4.9% 88 5,054,382,000 10.1% 16* 18,373,300,000 4.0% *February 12, 2014 Midsession Forecast (Excludes Transfers) 22 General Fund Revenue $ in Millions Fiscal Year 2000 2001 2002 2003 2004 2005 2006 2007 2008 2009 2010 2011 2012 2013 2014 Revenue Growth 10.5% 2.9 (3.8) 1.8 9.7 14.8 8.4 4.9 1.3 (9.2) (0.7) 5.8 5.4 5.3 1.0 Total Revenue $10,721.5 11,105.3 10,679.0 10,867.1 11,917.9 13,687.3 14,834.3 15,565.8 15,767.0 14,315.1 14,219.5 15,040.2 15,846.7 16,684.6 16,849.4 Nonwithholding $1,669.7 1,806.8 1,459.5 1,402.7 1,562.8 2,073.5 2,530.2 2,782.0 2,861.2 2,310.4 1,906.8 2,178.6 2,357.9 2,807.7 2,926.0 % of Total 15.57% 16.27% 13.67% 12.91% 13.11% 15.15% 17.06% 17.87% 18.15% 16.14% 13.41% 14.49% 14.88% 16.82% 17.37% 23 Trends in Withholding Compared to Individual Nonwithholding Percent Change Percent Growth Over the Prior Year 50 40 30 20 10 0 -10 -20 -30 -40 86 87 88 89 90 91 92 93 94 95 96 97 98 99 '00 '01 '02 '03 '04 '05 '06 '07 '08 '09 '10 '11 '12 '13'14*'15*'16* * Forecast Withholding Nonwithholding 24 Mandatory Deposits into the Revenue Stabilization Fund Will Triple the Size of the Fund Between the End of FY2010 and FY2016, Approaching $1.0 Billion by June 30, 2016 Revenue Stabilization Fund – June 30 Balance FY1995-2013 Actual and FY2014-2016 Forecast (millions of dollars) $1,189.8 $1,200 $1,064.7 $1,014.9 $948.5 $1,000 $939.1 $800 $715.6 $689.0 $575.1 $574.6 $600 $482.3 $472.4 $361.5 $400 $299.4 $295.2 $224.3 $156.6 $200 $340.1 $440.0 $303.6 $247.5 $80.1 $85.0 $0 • Mandatory deposits of $244.6 million in fiscal year 2014 and $243.2 in fiscal year 2015 are required. There is no deposit required in fiscal year 2016 based on official revenue projections. 25 Budget Driver: Medicaid Medicaid Enrollment & Expenditures, FY 2008 Aged Blind & Disabled Adults 9% 20% 20% 16% 47% Children Aged 55% 10% 23% Recipients Department of Planning and Budget, 2008. Blind & Disabled Adults Children Expenditures 26 Budget Drivers FY 1985 All Other $1,078,603,451 28.7% K-12 $1,355,514,703 36.1% Medicaid $202,916,420 5.4% Corrections $276,877,715 7.4% Per CH 221 Mental Disabilities $212,605,320 5.7% HEd $627,012,547 16.7% 27 Five Budget Drivers Make Up 70 Percent of the FY 2012 General Fund Budget Corrections $1,218.0 7% Medicaid $3,258.4 20% CarTax $950.0 6% Mental Health $709.5 4% DebtService $583.2 4% All Other $4,813.7 29% Higher Ed $1,538.1 9% Other $3,280.5 20% K-12 $5,010.2 30% Per Chapter 890, 2011 Virginia Acts of Assembly 28 Comparison of Total Medicaid Projected Spending (DMAS only) 6,500,000,000 6,000,000,000 5,500,000,000 2015 introduced spending level No expansion 5,000,000,000 Expansion 4,500,000,000 4,000,000,000 2015 2016 2017 2018 2019 2020 2021 2022 29 Net New Savings from Medicaid Pilot Provide $225 Million in Resources Medicaid Pilot Amendments Agency Title FY 2015 FY 2016 790: Grants to Localities Reflect Medicaid expansion savings at Community Services Boards ($8,500,410) ($29,144,262) 602: Department of Medical Assistance Services Reflect savings for the involuntary mental commitment fund from Medicaid Expansion ($526,112) ($1,302,286) 602: Department of Medical Assistance Services Reflect additional woodwork costs for FAMIS from Medicaid expansion $483,307 $776,121 602: Department of Medical Assistance Services Reflects savings for indigent care and other public coverage programs resulting from Medicaid Expansion 602: Department of Medical Assistance Services Fund additional woodwork costs for the Medicaid children's health insurance program from Medicaid expansion 602: Department of Medical Assistance Services Fund administrative costs related to the expansion of Medicaid 765: Department of Social Services Fund administrative costs of expanding Medicaid 799: Department of Corrections Capture savings resulting from Medicaid expansion TOTAL FOR MEDICAID PILOT AMENDMENTS ($53,125,686) ($121,618,603) $135,019 $216,337 $15,539,457 $13,163,607 $2,934,706 $708,125 ($14,576,472) ($30,435,674) ($57,636,191) ($167,636,635) 30 Funding Comparison for Higher Education Biennial Amounts (millions $) Governor HB/SB 5003 House Bill 5002 Senate Bill 5003 150.7 189.8 99.5 Financial aid-public institutions 32.5 3.1 45.5 Salary/bonus increases* 30.9 26.0 31.8 $214.1 $218.9 $176.8 Higher Ed-related operations *Governor McAuliffe provides 2% salary increase by April 2015; House Bill 5002 provides 1% bonus by January 2015 and 1% salary by June 2015; and Senate Bill 5003 provides 2% salary increase by April 2015 and includes graduate teaching assistants in its salary calculations. 31 For more information on Virginia’s budget, visit: www.DPB.Virginia.gov www.Finance.Virginia.gov 32
© Copyright 2026 Paperzz