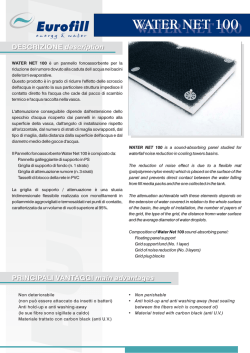
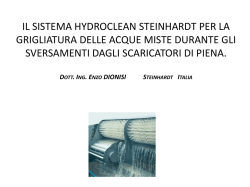
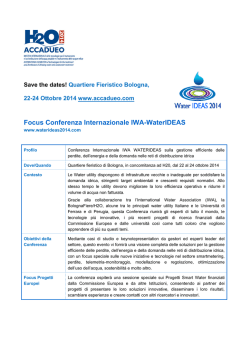
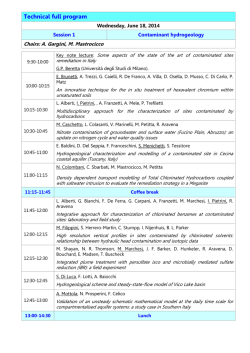
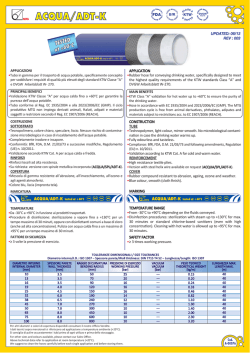
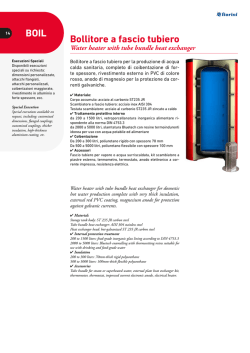
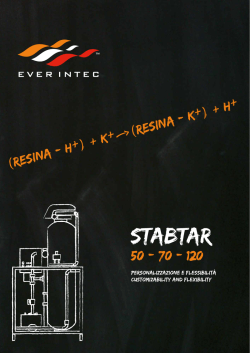
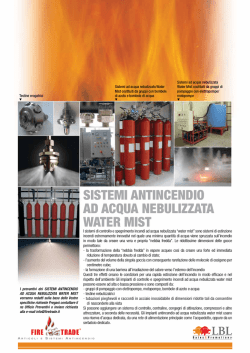
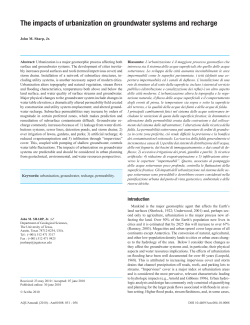
Brigham Young University
BYU ScholarsArchive
International Congress on Environmental
Modelling and Software
4th International Congress on Environmental
Modelling and Software - Barcelona, Catalonia,
Spain - July 2008
Jul 1st, 12:00 AM
Land subsidence induced by groundwater
extraction: the case of Bologna
G. Darini
G. Modoni
M. Saroli
P. Croce
Follow this and additional works at: http://scholarsarchive.byu.edu/iemssconference
Darini, G.; Modoni, G.; Saroli, M.; and Croce, P., "Land subsidence induced by groundwater extraction: the case of Bologna" (2008).
International Congress on Environmental Modelling and Software. 11.
http://scholarsarchive.byu.edu/iemssconference/2008/all/11
This Event is brought to you for free and open access by the Civil and Environmental Engineering at BYU ScholarsArchive. It has been accepted for
inclusion in International Congress on Environmental Modelling and Software by an authorized administrator of BYU ScholarsArchive. For more
information, please contact [email protected].
iEMSs 2008: International Congress on Environmental Modelling and Software
Integrating Sciences and Information Technology for Environmental Assessment and Decision Making
4th Biennial Meeting of iEMSs, http://www.iemss.org/iemss2008/index.php?n=Main.Proceedings
M. Sànchez-Marrè, J. Béjar, J. Comas, A. Rizzoli and G. Guariso (Eds.)
International Environmental Modelling and Software Society (iEMSs), 2008
Land subsidence induced by groundwater
extraction:
the case of Bologna
G. Darini, G. Modoni, M. Saroli and P. Croce
Di.M.S.A.T. – Dipartimento di Meccanica, Strutture, Ambiente e Territorio, Università di
Cassino, Via di Biasio, 42 03043, Cassino, Italia ([email protected])
Abstract: A comprehensive investigation of the subsidence induced in the area of Bologna
(Italy) by groundwater extraction is presented. Initially, the geological pattern of the region
is reviewed in order to identify the large scale subsoil features governing the water flow
regime and the ground displacements. Several types of data, covering the different aspects
of the problem are then combined into a Geographical Information System and interpolated
data by means of geostatistical analyses. A detailed reconstruction of subsidence over the
considered area is accomplished by processing available topographical measurements. The
subsoil stratigraphy, the physical, hydraulic and the mechanical characteristics of the
different geotechnical units are estimated by integrating the results of available
geotechnical site and laboratory investigations. The groundwater regime is investigated by
correlating the water head measures recorded on several pumping wells distributed over the
area of Bologna. A groundwater flow simulation model has been finally formulated in order
to derive the undisturbed pre-existing water level, to identify the effects of the actual
groundwater withdrawal and to predict the modifications induced by possible future
exploitations.
Keywords: Settlements; Seepage; Model; Spatial analysis.
1.
INTRODUCTION
In the second half of the past century intensive groundwater extraction was made in the Po
Valley by well pumping from the subsoil bearing strata, in order to satisfy the increasing
demand of water due to the rapid growth and concentration of inhabitants and economical
activities. Such a strong groundwater exploitation induced significant modifications on the
groundwater flow regime and different undesired effects on the urban and natural
environments. One main consequence, also recorded in other lowland areas of the world
[USGS, 1999], was a marked increase of ground subsidence observed around the urban
areas. In fact, while the whole Po valley is subjected to a long term natural subsidence of
few millimetres per year, produced by the self weight consolidation of the high thickness
alluvial deposits, in the period after 1950 some cities of northern Italy (Milano, Venezia,
Ravenna and Bologna are the most enlightening cases), suffered very high settlements,
reaching in some cases rates of dozens centimetres per year [Carminati and Martinelli,
2002]. This situation induced several local institutions to undertake investigations aimed to
discover the causes of such unexpected movements and to quantify their extent. However,
due to the large extension of the subsiding areas, to the natural delay of the phenomenon
and to the lack of a comprehensive investigation method, covering all the different aspects
of the problem, only qualitative conclusions could be retrieved for long time. It is nowadays
possible to process the large amount of data collected over the years on large geographical
1386
G. Darini et al./ Land subsidence induced by groundwater extraction: the case of Bologna
areas by means of dedicated software and to perform more complete analysis of the
phenomena.
This is the situation for the city of Bologna, which is the case presented in this paper. After
the second world war, the city experienced a significant demographic growth and industrial
development. In particular, from 1950 to 1960, the population increased of about 33%
(from 330.00 to 440.000 inhabitants) (Fig. 1.c) [Osservatorio Astronomico di Bologna,
2007]. To meet the subsequent water requirements, a large number of deep pumping wells
was excavated all around the city (Fig.1). In the same period, intensive subsidence was
observed, distributed with different settlement rates, all over the urban area [Pieri and
Russo, 1985]. The most clear sign of correlation between well pumping and subsidence can
be inferred by comparing the similar time progressions of the cumulated number of wells
and of recorded settlements at a typical monitored benchmark (Fig.1.b).
N
agricultural
civil (I-IV see tab 1.b)
Reno
industrial
(a)
I
deep borehole (Fig. 2.c)
III
II
monitored benchmark
Bologna
IV
pede-apenninic line
alluvial fan
0
3000m
Savena
section of Fig.2.a
year
1970
year
1980
1990
2000
(b)
32
31
30
29
28
1900
0
100.000
Population
wells total number
0
10
20
30
40
50
60
70
80
90
1960
monitored benchmark (m asl)
1950
1920
1940
1960
1980
2000
2020
(c)
200.000
300.000
400.000
500.000
600.000
Figure 1. Map of Bologna area (a); progression with time of well’s number and ground
level at a monitored benchmark (b); population growth [Regione Emilia Romagna –
UnionCamere, 2007] (c).
The plot shows that the most sharp increase of well number is concentrated in the period
between 1960 and 1975, while the maximum settlement rate occurred after 1970.
Explanation for such delay requires a more detailed analysis on the type of wells and the
relative amount of water withdrawn from each of them. To this aim, a distinction of
extracted water depending on its different uses (namely civil, industrial and agricultural),
provided for two years by Vassena [2003], shows that the larger amount of water is
withdrawn for civil activities (tab.1.a). Furthermore, it must be considered that while the
agricultural and industrial activities are more numerous and widely distributed all over the
country surrounding Bologna, the most active aqueduct wells (tab.1.b), excavated in a
relatively short period around 1970, are concentrated only in four zones within the two
alluvial fans of Reno and Savena Rivers (Fig.1.a).
Information available for the present analysis concerns ground movements, subsoil
characteristics, groundwater flow and piezometric heads. These different data, collected in
the past decades, have been included into a Geographical Information System (GIS),
covering an area of about 200 square kilometres, to seek a mechanical interpretation of the
observed phenomena. In order to correlate the different variables, each of them
characterised by an independent spatial distribution of measures, interpolation over the
considered area has been achieved by means of geo-statistical methods which consider each
1387
G. Darini et al./ Land subsidence induced by groundwater extraction: the case of Bologna
measure as a sample of a statistical population. A mathematical model (theoretical
variogram), defined to simulate the statistically observed spatial variability of measures
(experimental variogram), forms the basis for interpolation of measures over the study area
by means of a Kriging method [Matheron, 1971]. By this method all the different
considered variables have been evaluated on the same grid of points uniformly distributed
over the Bologna area with a spacing of 500 m.
Table 1. Groundwater volumes extracted in the years 1985 and 2002
(a. water extraction distinguished by use; b. water extracted from each single civil well)
[Vassena, 2003].
Use
Civil
Industrial
Agricultural
Zootechnical
Total
Year
Groundwater withdrawal
(106 m3/year)
43.9
18.4
5.1
1.1
68.5
1985
38.5
22.7
9.5
0.6
71.3
2002
Borgo Panigale
Tiro a segno
Fossolo
Year
Well location name
S. Vitale.
Position in Fig.1.a
I
II
III
IV
Groundwater withdrawal
(106 m3/year)
12.1
12.1
13.2
6.5
1985
12.7
12.5
7.9
5.4
2002
2.
(a)
(b)
SUBSOIL CHARACTERISTICS
The city of Bologna is located in the southern part of the Po Valley, at the foothills of the
Apennines. From a geological viewpoint, the Po Valley can be considered as the result of a
foreland basin evolution process [Carminati and Martinelli, 2002] with the Apennines and
the plain presently interested by different evolution processes. The Po Valley links the
padanian-adriatic sector with the external portion of the thrust belt composed by the
tectonic units of the Upper Miocene – Quaternary, currently subjected to tectonic up-lift
movements and consequent erosive processes [Bartolini et al., 1996]. Starting from the
middle Plio-Quaternary, when the whole Po valley was an extension of the present Adriatic
sea, the basin was gradually filled by alternations of marine and continental sediments, the
latter coming from the erosion of the Apennines [Amorosi et al.,1996]. This dynamic
evolution caused the transition line between the continental slope and the marine basin to
progressively advance eastward [RER and ENI-AGIP, 1998].
A comprehensive subsoil reconstruction of the southern part of the Po Valley is available
thanks to a study carried out for oil and water exploitation [RER and ENI-AGIP, 1998].
Combining boreholes and deep wells stratigraphies together with seismic investigation
results, three thick aquifer groups, named respectively A (shallow), B (intermediate) and C
(deep), were identified. Each group consists of alternation of coarse and fine grained soil
strata and is separated from the others by thick impervious barriers of regional extension
[Farina et al., 2000]. The group A in the Bologna area is mainly formed by the two big
alluvial fans of Reno and Savena rivers (Fig.2.a), which are the most important
groundwater supplies of the city [Elmi, 1984]. It is thus reasonable to consider that the
water originally permeated from the alluvial fans spread into the pervious layers of the plan
area, forming a relatively shallow water table which encouraged people to undertake
groundwater extraction. From a more detailed investigation of the subsoil composition,
obtained by the logging of a deep borehole retrieved in the valley (Fig.2.b), a recurrent
stratification of relatively thin layers of coarse and fine grained soils is seen, meaning that
these two soil types are mutually penetrating and cannot be clearly distinguished on the
map (the border of the shaded area traced in Fig.1.a, represents only the limit of the alluvial
fan portion outcropping at the ground level).
Starting from the RER and ENI-AGIP [1998] study, the analysis over the Bologna area has
been further developed [Darini, 2007]. In fact, for each aquifer group, the study reports
contour maps respectively of the bottom depth and of the cumulated thickness of coarse
grained deposits (considering these latter as the more pervious and thus useful for water
exploitation).
1388
G. Darini et al./ Land subsidence induced by groundwater extraction: the case of Bologna
These contour maps have been digitalised and interpolated by means of a geostatistical
analysis, over an area of 15x15 km2 around Bologna (Figs.3.a and b), with the aim of
calculating the cumulated thicknesses of fine grained soil deposits as differences between
total and coarse grained soil thickness (Fig.3.c). The results of this analysis for the topmost
aquifer group (A), which has been considered, due to its upper position, as the main
responsible for the observed subsidence, show that the maximum cumulated thickness of
fine grained soils occurs at the boundary of the two alluvial fans of the Reno and Savena
rivers.
S-SO
50
deep (m)
N-NE
0
-50
A
(b)
-150
C
100
B
-250
impervious limits
sand
limit A - B
200
gravel
(a)
coarse grained
silt-clay
missing data
fine grained
300
Figure 2. Litho-stratigraphical representation of the Bologna subsoil obtained from a cross
section (a) traced along the Reno river [modified from Regione Emilia-Romagna , 2007]
and from a deep borehole (b) whose plan position is shown in fig.1 [modified from
IDROSER, 1989].
0
3000m
N
0
3000m
Reno
Bologna
Savena
N
0
3000m%
Reno
(a)
N
Reno
Bologna
Savena
Bologna
(b)
Savena
(c)
0,50
0,40
deep borehole
shallow borehole
0,30
0,20
0,10
0,00
0,10
0,30
0,50
0,70
Liquid limit wL
Plasticity index (%)
Plastic index PI
Figure 3. Aquifer Group A: total thickness (a), cumulated coarse grained soil thickness (b),
cumulated fine grained soil thickness (c).
80
deep borehole
60
shallow borehole
40
20
0
0
20
40
60
Clay fraction (%)
Figure 4. Casagrande plasticity chart for fine grained soil.
The physical and mechanical characteristics of the subsoil in the whole area have been
investigated by collecting the available results of fields and laboratory tests performed at
1389
80
G. Darini et al./ Land subsidence induced by groundwater extraction: the case of Bologna
different locations and depths. From this analysis a randomly distributed grain size
composition of fine grained soils is seen over the considered area with a predominant
fraction of silt (ranging between 40 and 60%), a slightly lower content of clays (from 10 to
50 %) and a small percentage of sand (from 0 to 20 %). The overall homogeneity of this
soil can be also seen from the Casagrande plasticity chart, and the activity reported in
(Fig.4) by distinguishing with different dots the values obtained on samples taken at a depth
from the ground level between 50 and 300 m from those taken at more shallow depths. The
plot shows a similar scattering for both sets of data, with the random position of the points
on the diagram dictated by the different amount of clay.
Similar conclusions can also be retrieved for the mechanical characteristics of these
deposits. In fact, even though a scattering is generally observed on the different parameters,
the average values and coefficient of variation do not show significant spatial differences.
The average values and the standard deviations for the compressibility, swelling and
consolidation indexes, obtained from all the performed tests, are summarised in table 2.
One last comment for these deposits concerns their stress history, which has been evaluated
by means of the over consolidation ratios (OCR), estimated by oedometer tests. These
values are equal to about 6 near the ground level and gradually decrease to 1 at about 20 m
depth, showing that the fine grained deposit can be thus assumed as globally normal
consolidated, apart from their shallow portion affected by water table fluctuations.
Table 2. Compressibility, swelling and consolidation coefficients of fine grained soils.
Average
St.Dev.
λ
0,120
0,036
κ
0,030
0,015
cv (cm2/s)
6,3E-03
3.69E-02
Concerning the coarse grained soils, several pumping tests [RER and ENI-AGIP, 1998]
gave values of the Darcy’s coefficient ranging between 10-3 and 10-5 m/s without showing
any clear spatial distribution. Simplifying assumptions will be introduced concerning this
aspect for the analysis developed in the next paragraph.
3.
GROUNDWATER SEEPAGE
The distribution of water heads in the subsoil of Bologna could be estimated only for the
period after 1976, i.e. when measurement of water level on about 150 different types of
wells was started [Regione Emilia Romagna, 2007]. A sample of piezometric heads contour
map obtained by interpolation of the average water level measured in 1985 for the aquifer
group A shows a strong water table depression within the alluvial fan of the Reno river. If
flow lines are traced orthogonally to the constant head curves, a clear convergence of water
is observed toward the zone where the most important pumping activity is concentrated.
Unfortunately, the available water head measurements do not allow to calculate the water
table drop induced by water pumping. Based on hystorical information from the XIX
century reporting groundwater outcrops near the ancient road named “via Emilia”, previous
analysis by Vassena [2003] estimate this head lowering by considering the water table
originally located at the ground surface. In the present study, this aspect has been tackled by
modelling the water flow regime with a numerical two dimensional finite-difference model
[Modflow + Groundwater Vistas, version 3, 2001]. This analysis has been conducted to the
upper aquifer group (A), from which most of the water is extracted, by assuming a perfectly
impermeable layer at its bottom. To this aim the area reported in figure 3, extending over
15X15 squared kilometres with side boundaries falling out of the influence region of the
most active wells [Kezdi e Marko, 1969], has been subdivided into a regularly distributed
square grid of 500 meters spacing. According with the previously recalled RER and ENIAGIP [1998] study the thickness on each vertical has been calculated as equal to the
difference between ground and bottom levels. Two numerical simulations have been
performed respectively for the two years 1985 and 2002, for which estimates of the
extracted water volumes are available (see tab.1). In particular, the water flow withdrawn
from each industrial well has been assigned by equally subdividing the total amount of
water extracted for industrial purpose, while direct estimations are available for the four
1390
G. Darini et al./ Land subsidence induced by groundwater extraction: the case of Bologna
civil wells located in the study area. The boundary conditions at the contour of the
considered area have been provided by assigning nil water flow on the Apennines and the
water head values interpolated from measurements on the valley and the alluvial fan. The
subsoil permeability for any plan position (x,y) has been computed by the following
relation:
K ( x, y ) = K * ⋅
S af ( x, y )
(1)
S t ( x, y )
(a)
Reno
N
alluvial fan contour
valori calcolati
civil wells
industrial
wells
Bologna
0
3000m
Savena
Modelled piezometric head (m a.s.l.)
where St and Saf represent respectively the total thickness of the aquifer group and the
cumulated thickness of the coarse grained soils evaluated in each position (x,y) (see Fig. 3.a
and b). K* is a reference permeability value, equal to 3.5*10-4 m/s (i.e. within the estimated
limits of coarse grained soils), found by a trial and error procedure in order to match the
measured water head. Considering the large simplification introduced in the model, the
comparison between water heads obtained from the calculation and from the interpolation
of measurements is generally satisfactory for both years 1985 and 2002 (Fig.5.b). This
seepage model has been then applied to observe the groundwater regime under different
conditions. In particular, if the industrial wells are virtually turned off in the analysis it is
readily observed that their effect on the position of the groundwater table is negligible. On
the contrary, the extraction for civil use is the most important responsible for the water head
drop observed in the central part of the alluvial fan of the Reno river. Finally nil flow has
been assigned to all wells to recover the original undisturbed position of the water table (i.e.
free of well pumping) which is unknown.
-20
15
10
5
0
-15
-10
-5
0
5
10
15
20
-5
-10
-15
-20
2002
1985
Piezometric head from measures (m a.s.l.)
(c)
N
Reno
Bologna
Savena
(b)
20
alluvial fan
0
3000m
Figure 5. Water head in the Bologna area (a. contour map of water head from
measurements (1985); b. modelled vs measured water heads for 1985 and 2002; c. water
head reduction Δh (m) due to well pumping).
Once this position is established, the patterns of water head reduction due to any assigned
extraction activity can be obtained. A representative situation of the largest observed water
head drop in the area can be obtained by considering the extraction activity of 1985 and by
calculating the corresponding water head drop (Fig. 5.c).
4.
GROUND SURFACE SETTLEMENTS
The ground surface settlements have been monitored by different geometrical levelling
campaigns carried out by local authorities. A first levelling network consisting of 200
1391
G. Darini et al./ Land subsidence induced by groundwater extraction: the case of Bologna
benchmarks positioned primarily along the “via Emilia” was installed between 1950 and
1980 from the Management District of the Reno River Basin. These points were partly
incorporated in a more extended and dense net of 500 benchmarks by the Municipality of
Bologna which promoted four extensive measurement campaigns respectively, in 1983,
1987, 1992 and 1999. The settlements recorded on one particular benchmark common to
the two networks are reported in fig.1.b. In order to calculate the settlements distribution all
over the study area in a period covering the subsidence phenomenon, interpolation of
levelling measures has been performed by means of geostatistical analysis. By this
operation different contour maps could be drawn for different selected periods. Two
examples of settlement contour maps respectively for the two periods 1972-1997 and 19831999 are reported in Fig.6.a and b. These maps show a typical characteristic of
geostatistical interpolation. In fact, compared to the 1983-1999 map, which is based on a
larger number of homogeneously distributes measures, the 1972-1997 map is less accurate,
as also confirmed by the numerical tests performed on such interpolation. However,
independently of the observation period which obviously influences the amount of
observed settlement, both maps show the typical subsidence pattern of the Bologna’s area,
with larger settlements occurring around the two alluvial fans.
N
Reno
(a)
(b)
Bologna
Bologna
0
3000m
N
Reno
Savena
0
3000m
Savena
w72-97/Sat
0,03
(a)
0,025
0,02
0,015
0,01
0,005
y = 0,0003 x
0
0
20
40
60
80
100
Δh (m)
w83-99/Sat
Figure 6. Geometrical levelling over the area of Bologna (a. contour map of settlements
(m) in the period 1972-1997; b. same for 1983-1999).
0,01
0,009
0,008
0,007
0,006
0,005
0,004
0,003
0,002
0,001
0
(b)
y = 0,0001 x
0
20
40
60
80
100
Δh (m)
Figure 7. Settlement per unit fine grained soil thickness versus water head reduction (a.
period 1972-1997; b. period 1983-1999).
Such observation suggests to relate the ground surface settlements (w) (Fig. 6.a and b) at
the different positions to the corresponding cumulated thickness of fine grained soils (Sat)
(Fig. 3.c). The ratio between these two quantities, calculated on the same grid points
previously adopted for the calculation of water head reduction, is expressed in Figs.7 as a
function of the water head drop Δh (Fig. 5.c). From both plots, which refer respectively to
two different periods of observation (Fig.7.a to 1972-1997; Fig.7.b to 1983-1999), a clear
increasing trend is observed between these two quantities. The larger scattering of points on
the former plot (±50% around the average line) compared to the second (±20% around the
average line) can be partly considered as an effect of the different accuracy in the
interpolation of settlements for the two periods. However, by comparing the average trend
on these two plots, it is seen that the rate of settlement occurred in the period 1972-1983
has been almost four times larger than after 1983.
1392
G. Darini et al./ Land subsidence induced by groundwater extraction: the case of Bologna
5.
CONCLUSIONS
A quantitative back analysis has been conducted in order to study the ground subsidence
induced in the Bologna area by intensive water exploitation. Multi-temporal large scale
analyses have been performed combining into a Geographical Information System different
types of information and large amount of data regarding subsoil conditions, water levels
and measured settlements. Interpretation of the complex observed pattern of subsidence has
been provided by finding a close relation between settlements, cumulated thickness of fine
grained soils deposits and water head reductions. In particular, the analysis on these latter
performed by means of numerical modelling have revealed the predominant role of water
withdrawal from the two alluvial fans of Reno and Savena rivers, carried out for civil
purposes. As a more general comment, the large amount of data collected in the past
decades and the availability of information tools capable of quickly processing them on
large geographical scales, allowed to make profit of the past experiences on such coupled
hydro-mechanical phenomenon and to derive a lesson for future more balanced
managements of the groundwater source.
REFERENCES
Alessi, R., La subsidenza nel centro storico della città di Bologna. Il grado di dissesto dei
fabbricati nella zona di via Zamboni. Inarcos, n. 456, 1985.
Amorosi, A., Farina, M., Severi, P., Preti, D., Caporale, L. & Di Dio, G., Genetically
related alluvial deposits across active fault zones: an example of alluvial fan-terrace
correlation from the upper quaternari of the southern Po Basin, Italy, Sedimentary
Geology, 102, 275-295, 1996.
Bartolini, C., Caputo, R., & Pieri, M., Pliocene–Quaternary sedimentation in the Northern
Apennine Foredeep and related denudation, Geological Magazine, 133(3), 255−273,
1996.
Carminati, E., Martinelli, G., Subsidence rates in the Po Plain, northern Italy: the relative
impact of natural and anthropogenic causation, Engineering Geology, 66, 241-255, 2002.
Darini, G., Land subsidence due to groundwater withdrawal: the case of Bologna, Ph.D.
thesis, Università degli Studi di Cassino (Italy), 2007.
Elmi, C., Bergonzoni, A., Massa, T., Montaletti, V., Barattella, P.L., Ronchi, A., Il
territorio di pianura del Comune di Bologna: aspetti geologici e geotecnica, Giornale di
Geologia, 46(2), 127-152, 1984.
Farina, M., Simoni, M., Passuti, I., Il complesso idrogeologico superficiale nel contesto
della città di Bologna, Il geologo, 11, 2000.
Groundwater Vistas-Modflow, version 3, Environmental Simulations Inc., 2001.
IDROSER, Studio sul fenomeno della subsidenza nel territorio bolognese. Comune di
Bologna, 1989.
Matheron, G., The Theory of Regionalized Variables and Its Application – Spatial
Variabilities of Soil and Landforms. Fontainebleau, Les Cahiers du Centre de
Morphologie Mathematique 8, 1971.
Osservatorio Astronomico di Bologna, 2007, from http://www.bo.astro.it website.
Pieri, L., Russo, P., Situazione attuale delle ricerche sull’abbassamento del suolo nel
territorio bolognese. Inarcos, 456, 1985.
Regione Emilia Romagna and ENI-AGIP, Riserve idriche sotterranee della Regione EmiliaRomagna. S.EL.CA. (Firenze), 1998.
Regione Emilia Romagna, 2007, from http://www.regione.emilia-romagna.it website.
Regione Emilia Romagna – UnionCamere, 2007, from http://www.rer.camcom.it/datiecon
website.
USGS, Land subsidence in the United States, edited by Devin Galloway, David R. Jones,
S.E. Ingebritsen, 1999.
Vassena, C., Sviluppo e applicazione di modelli di flusso delle acque sotterranee nella
conoide alluvionale del fiume Reno, Ph.D. thesis, Università degli Studi di Milano,
2003.
1393
© Copyright 2026 Paperzz