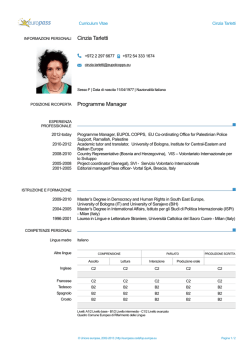
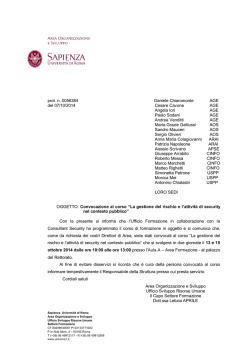
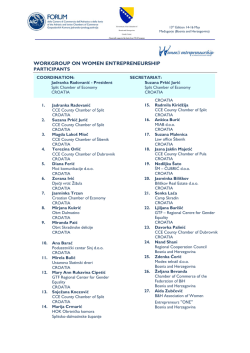
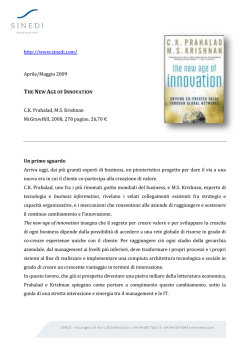
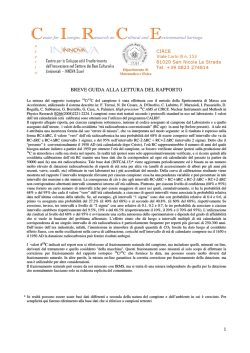
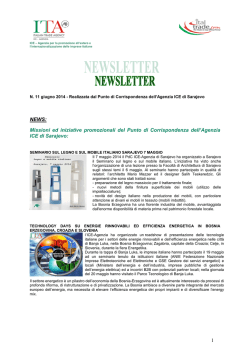
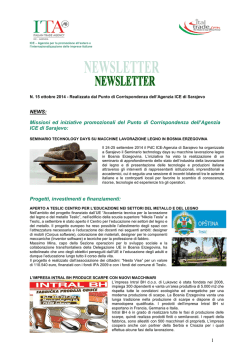
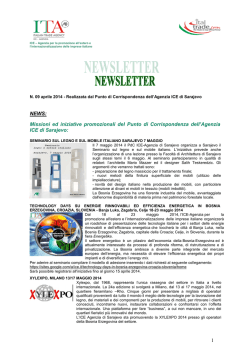
Postwar Mortality Trends in Bosnia and Herzegovina
Stefania Girone - Sara Grubanov-Bošković
1. Introductory notes
There is a very small number of researches that have as their object of
analysis the recent mortality trends in Bosnia and Herzegovina and the existing
ones mainly aim at estimating the number of war-related deaths (Mann, 1994;
Obermeyer et al, 2008; Zwiezchowski and Tabeau, 2010). Consequently, the
main features in the issue of mortality in postwar Bosnia and Herzegovina are
generally little known, especially in regard to the gaps between its two
coexisting entities: Federation of Bosnia and Herzegovina and Republika
Srpska. With an aim of filling, at least partially, this gap we intend to analyze
this phenomenon in order to provide, in spite of limited data availability, a
comprehensive picture – and foremost a comparative one – by constructing the
abridged life tables for the entire country and at least one of its two entities.
2. Research Subject, Quality of Statistical Data and Methodology
2.1. Area of Reference
The Dayton Agreements signed in November 1995, by marking the end of
the Jugoslav war, recognized for the first time the existence of two precisely
defined and distinct entities within Bosnia and Herzegovina:
a) Federation of Bosnia and Herzegovina (FBH), whose majority is
composed of Bosniacs (Muslims) and Croats;
b) Republika Srpska, with its Serbian majority.
In the light of this, the territorial references of our research will be:
a) The entire Former Jugoslavia, articulated on the basis of territorial
partition in force until 1991 (see Figure 1);
b) Bosnia and Herzegovina, on the ground of its current territorial division
(see Figure 2)1.
Faculty of Political Science, University of Catania (Italy) – [email protected]
Faculty of Political Science, University of Bari (Italy) – [email protected]
1
The territorial partition of the State comprises two entities, Federation of Bosnia and
Herzegovina and Republika Srpska, plus the Brčko District that was officially constituted in
2000 as an autonomous administrative unit under sovereignty of Bosnia and Herzegovina and
formally belonging to both of Bosnian entities.
1
Fig. 1 – Bosnia and Herzegovina within the area of Former Jugoslavia.
Fig. 2 – Territorial division of Bosnia and Herzegovina.
According to the 2010 mid-year estimates, the entire Bosnian population
amounts 3,846thousand units, out of which the majority (60.78%) living in the
2
FBH (see Table 1). In the period under observation, covering a time range
marked not only by war events but also by the beginning of the demographic
post-transitional stage, the total population recorded a considerable decrease
equal to 12.1% of the initial amount.
Tab. 1 – Territory under reference.
Area
Bosnia and Herzegovina
Federation Bosnia and Herzeg.
Republika Srpska
Brčko District
Area
(sqm)
51209,2
26110,5
24605,7
493
Population
Census
Estimates
(31-3-1991)
(30-6-2010)
a.v.
%
a.v.
%
4377033 100.00 3846372 100.00
2720074 62.14 2337660 60.78
1569332 35.85 1433038 37.26
87627
2.00
75674
1.97
Source: Agency for Statistics of Bosnia and Herzegovina, Federal Office of Statistics of
Federation Bosnia and Herzegovina, Republika Srpska Institute of Statistics, 2012.
Without any doubt, during the war operations (1992-1995) public health –
considered in the broad sense of the term as availability and/or quality of food,
water, fuel/energy, health services and personal security – was, in the reference
to large share of population, extremely precarious (Mann, 1994). Could have all
of that left lasting effects on the life expectancy of the Bosnian population that
might be traced even fifteen years after the war’s end?
2.2. Quality of Statistical Data
The major obstacles in analyzing, with a sufficient accuracy, the current
demographic assets of the country are related mainly to the difficulties of data
collection. These difficulties are determined by the fact that the last census in
Bosnia and Herzegovina was conducted in the distant 1991 and that since then
no other census was taken. Meanwhile, the war events have caused massive
population displacements and have altered the mortality levels2, which makes
clear that, at present, the ’91 census has more of a historic relevance and thus
cannot be used as a reference to a “normal” evolution of population.
2
As for that matter, it should be noted that some authors have estimated that the number of warrelated deaths in the period 1992-1995 reached 89,186 units (Cfr.: Zwiezchowski and Tabeau,
2010). While, on the basis of the UNHCR data, it has been estimated that the number of
refugees and IDPs reached 1,290 thousand units only in two years period 1993-1994 (Hovy,
2011).
3
Therefore obtaining data, largely estimates, that are fully reliable for a
population – composed of three major ethnic groups3 (Bosniacs, Croats and
Serbs) – which underwent a series of dramatic historical and political events
might have significant implications of statistical-demographic nature too. In
fact, the three different statistical institutions operating in the country – Agency
of Statistics of Bosnia and Herzegovina (at national level), Federal Office of
Statistics of the FBH and Republika Srpska Institute of Statistics – do not
publish life tables of any kind4 neither do provide the complete sex and age
structure estimates of these populations for the public use. Nevertheless,
following the preparations for the next census, to be held in 2013, we managed
to obtain from each statistical institute, in front of repeated specific requests,
complete official estimates on sex and age structure of populations living in
each one of the two entities (FBH and Republika Srpska) for 2009 and 2010. In
course of data elaboration, we have retained as appropriate to proceed with the
construction of abridged life tables (2009-10) for the entire country and – given
the low numbers of deaths distributed by sex and five-year age groups of
Republika Srpska – for the sole entity of FBH. This approach should still allow
us to formulate valuations on the general as well as specific mortality, both at
national level and at the level of its two distinct entities, since the demographic
characteristics of Republika Srpska are complementary to those of FBH and
obtainable, thus, as its “difference”.
2.3. Construction of Abridged Life Table
In constructing the life tables we proceeded, firstly, with computing agespecific death rates by means of:
,
[1]
where the meaning of symbols is evident. The respective age-specific death
rates have been reported in Table 2.
3
The Constitution of Bosnia and Herzegovina (set out in Annex IV of Dayton Agreement)
defines Bosniacs, Croats and Serbians (along with Others) as country’s constitutive peoples,
whereas the term Bosniac substitutes the usage of old “ethnical” term “Muslim”.
4
Officially, the Agency for Statistics of Bosnia and Herzegovina and the Federal Office of
Statistics of FBH, do not dispose of life tables and, hence, do not provide them for external use.
Nevertheless, it does not exclude the possibility that they do elaborate life tables for their
internal usage.
4
Tab. 2 – Age-specific death rates (in ‰), 2009-10.
Age
0-4
5-9
10-14
15-19
20-24
25-29
30-34
35-39
40-44
45-49
50-54
55-59
60-64
65-69
70-74
75-79
80-84
85+
Total
Bosnia and
Herzegovina
FBH
Male
Female
Male
Female
1.62
0.14
0.10
0.34
0.68
0.94
0.98
1.44
2.05
3.80
7.39
13.74
18.85
23.11
39.42
65.41
118.93
173.96
9.52
1.41
0.07
0.08
0.18
0.24
0.26
0.47
0.59
1.14
1.95
3.63
5.58
9.33
13.44
27.91
51.65
123.32
153.05
8.70
2.04
0.16
0.12
0.53
0.74
0.81
0.77
1.12
2.00
3.60
6.46
10.86
16.44
28.87
44.13
70.89
100.86
163.36
8.83
1.66
0.11
0.12
0.26
0.28
0.28
0.49
0.56
1.23
2.09
3.11
5.34
8.67
18.47
31.26
54.50
95.95
163.29
8.50
Source: Own elaboration of official data provided by Agency of Statistics of
Bosnia and Herzegovina and Federal Office of Statistics of Federation of Bosnia
and Herzegovina, 2012.
Once the crude death rates have been obtained, we computed respective
probabilities of dying by applying the well-known equation for converting the
values devised by Reed and Merrel5:
,
5
[2]
Cfr.: R. PRESSAT, 1961.
5
and, then, constructed abridged life tables (Tables 3-6) in which the values of
mean expectation of life were calculated by using the following expression:
[3]
Tab. 3 – Abridged life table, Bosnia and Herzegovina, 2009-10
Age
0
5
10
15
20
25
30
35
40
45
50
55
60
65
70
75
80
85+
lx
100,000
99,191
99,119
99,068
98,899
98,563
98,103
97,625
96,923
95,936
94,129
90,709
84,668
77,024
68,583
56,226
40,368
21,960
Male
qx, x+5
0.0081
0.0007
0.0005
0.0017
0.0034
0.0047
0.0049
0.0072
0.0102
0.0188
0.0363
0.0666
0.0903
0.1096
0.1802
0.2820
0.4560
1.0000
ex
73.35
68.93
63.98
59.01
54.11
49.29
44.50
39.71
34.98
30.31
25.85
21.73
18.10
14.65
11.14
8.04
5.22
lx
100,000
99,295
99,262
99,221
99,130
99,013
98,883
98,648
98,359
97,799
96,849
95,104
92,483
88,260
82,510
71,706
55,238
29,366
Female
qx, x+5
0.0070
0.0003
0.0004
0.0009
0.0012
0.0013
0.0024
0.0029
0.0057
0.0097
0.0180
0.0276
0.0457
0.0652
0.1309
0.2297
0.4684
1.0000
ex
77.56
73.09
68.11
63.14
58.20
53.26
48.33
43.44
38.56
33.76
29.07
24.56
20.18
16.03
11.97
8.40
5.16
Source: See Table 2.
6
Tab. 4 – Abridged life table, FBH, 2009-10.
Age
0
5
10
15
20
25
30
35
40
45
50
55
60
65
70
75
80
85+
lx
100,000
98,984
98,906
98,849
98,585
98,222
97,823
97,445
96,900
95,936
94,223
91,223
86,391
79,550
68,802
55,072
38,442
22,981
Male
qx, x+5
0.0102
0.0008
0.0006
0.0027
0.0037
0.0041
0.0039
0.0056
0.0099
0.0179
0.0318
0.0530
0.0792
0.1351
0.1996
0.3020
0.4022
1.0000
ex
73.42
69.14
64.20
59.23
54.38
49.58
44.77
39.93
35.14
30.47
25.98
21.75
17.83
14.15
10.97
8.08
5.49
lx
100,000
99,173
99,116
99,054
98,924
98,783
98,646
98,406
98,131
97,528
96,512
95,024
92,517
88,585
80,743
68,991
52,379
32,122
Female
qx, x+5
0.0083
0.0006
0.0006
0.0013
0.0014
0.0014
0.0024
0.0028
0.0061
0.0104
0.0154
0.0264
0.0425
0.0885
0.1455
0.2408
0.3867
1.0000
ex
77.23
72.86
67.90
62.94
58.02
53.10
48.17
43.28
38.39
33.61
28.94
24.35
19.95
15.72
12.01
8.62
5.57
Source: See Table 2.
7
Fig. 3 – – Survival and mean expectation of life functions, Bosnia and
Herzegovina, Source: See Tab. 2.
Fig. 4 – Survival and mean expectation of life functions, FBH.
Source: See Tab. 2.
8
3. Main Features of Recent Mortality Trends in Bosnia and Herzegovina
Within the discussion of results deriving from the picture given by the
constructed (abridged) life tables, we also made – by “completion” – ,where it
was possible, some considerations on Republika Srpska. All these efforts have
been done bearing in mind the idea of expanding the analysis of these topics in
near future by computing, for example, the cause-of-death life tables6.
3.1. Age Distribution of Mortality
According to the results contained in Tables 3-4, in the two-years period
2009/2010 the life expectancy at birth of male Bosnian population reached
73.35 years while the female one reached the age of 77.56 years, values that
largely correspond to the estimates released by the UN7 for 2010 (e0 equal to 73
for men and 78 for women). At the same time, the life expectancy at birth in
FBH is substantially equal to national values regarding men (e0 = 73.42) and
slightly lower for women (e0 = 77.23). Hence, by taking into account the above
mentioned differences, it is possible to formulate a hypothesis according to
which “by completion” the life expectancy at birth for men of Republika Srpska
should be slightly lower than the national value (for Serbs thus, the e0 should be
around 73.28 years) while, on other hand, for women it should result somewhat
higher (with e0, roughly, equal to 77.8).
Observing the values of both probabilities of dying and mean expectation of
life at young age groups (0-14 year) and using as basis of comparison the same
values for other developed countries (in our case the comparison will be made
with the recent Italian experience) reveals that there are still large differences in
terms of survival between, on one hand, the Western Europe in general and
Italy in particular and, on another, Bosnia and Herzegovina. In Italy, for
example, in 2009 the life expectancy at birth has reached 79.01 years for men
and 84.13 years for women8 resulting, thus, 5.66 years higher for males and
6.57 years higher for females in comparison to the life expectancy of the
Bosnian population. In particular, by comparing the values of probabilities of
dying at the 0-4 age group in Bosnia and Herzegovina (q0-4 = 8.09‰ for male
6
For what concerns the main characteristics of different types of cause-of-death life tables cfr.,
e g.: DI COMITE, Sulla mortalità per causa, “Studi di demografia”, Bari, 1969.
7
UNITED NATIONS, World Population Prospects: The 2010 Revision, New York, 2011
(http://esa.un.org/unpp/)
8
ISTAT, Istituto Nazionale di Statistica, 2011. (http://demo.istat.it/).
9
and 7.05‰ for female) with those reported in Italy (where q0-4 = 4.31‰ for
male and 3.66‰ for female), it could be assumed that, in the following years,
the further contraction of infant mortality will determine additional gains in
terms of life expectancy for the Bosnian population. If we focus, instead, on the
data related to the FBH it reveals the presence of higher infant mortality (q0-4 =
10.16‰ for male and 8.27‰ for female) in comparison to national values and,
as a consequence, the share of FBH survivors that reaches the following young
age-groups is lower than the portion of survivors of Bosnia and Herzegovina.
Moreover, in reference to adult age group (15-65 years) the results show that
men in Bosnia and Herzegovina enter this age group with a mean expectation of
life equal to 59.01 years and leave it with a life expectancy of 14.56 years. On
other side, women at the moment of entrance to the adult age claim a life
expectancy of 63.14 years and abandon this group with a mean expectation of
life equal to 16.03 years. The probabilities of dying for this large age group
suggest that the additional mortality reduction in age groups 45-64 for men and
50-64 for women would result in further gains in terms of life expectancy for
the population of Bosnia and Herzegovina On the contrary to the values
concerning young age groups, the FBH probabilities of dying in adult age
groups tend to appear lower than the those obtained at the national level.
Finally, regarding the old age groups (65+) the probabilities of dying and
respective mean expectations of life have been calculated only up to the 80
years of age, since the estimates on population’s sex and age structure do not
consent to quantify correctly the mortality levels at the extreme old age groups.
In developed countries, the mortality reduction at young and old age groups
has increased the number of individuals who arrive at more advanced ages. It
generated, as time passed by, the effect of progressive “rectangularization” of
the survival curve – a phenomenon that goes step by step with the increase of
the median age at death – and whose existence is clearly evident today both in
Bosnia and Herzegovina and FBH (see Figures 3 and 4). The age distribution of
deaths has, consequently, moved toward right becoming less variable. If we
focus, in particular, at the right side of the graph, i.e. on the old age groups, it
shows that 77.02% of men and 88.26% of women succeeded in reaching the
age of 65 years. However, the share of survivors at the age of 65 years in
Bosnia and Herzegovina appears to be lower than the respective values for Italy
where 87.40% of men and 89.47% of women reach the above defined age9.
9
Up to now, we considered the age of 65 years as the threshold-age for defining the “elderly
population”. To determine the share of “elderly population” a dynamic criterion can also be
applied, i.e. a criterion which is not based on static thresholds but on mobile ones, introducing
10
Worth mentioning is also the gap between Bosnia and Herzegovina and Italy in
terms of probabilities of dying: the risk of dying for the sixty-five years old
men in Bosnia and Herzegovina is 109.60‰, while for the Italian men it is
equal to 75.26‰. Under effect of high probabilities of dying the initial
contingent of Bosnian population is reduced in half at the age group 75-79 in
case of men and 80-84 in case of women, which represents a difference of 5
years in comparison to Italy. In the light of all the considerations made – and as
the same Tables 3-4 and Figures 3-4 suggest – the future increase of life
expectancy will derive from a progressive reduction of mortality levels in
reference to all age groups, both young and adult as much as at the old ages10.
To conclude, the regional differences, more or less marked, in terms of
mortality between FBH and the entire country could be, approximately,
summed up in the following manner: a) higher infant/juvenile mortality (0-14
years) in FBH; b) probabilities of dying in adult age-groups (15-64) that tend to
be lower in FBH; c) the probabilities of dying of old population systematically
higher for the FBH.
3.2. Gender Differences in Mortality
Although it would be very interesting to expand this study also on
determinants – both biological and socio-economic ones11 – of differential
mortality among genders, for the reasons of space, we will assign the last part
of our research to the analysis of the male supermortality phenomenon that
tends to characterize the Bosnian reality, as well as the reality of the rest of
Developed world.
The index most frequently used, for the purposes of revealing the existence
or less of gender differences in mortality, is the difference between the two life
expectancies at birth. Precisely, the difference between two life expectancies at
birth in Bosnia and Herzegovina is 4.20 years to disadvantage of men, while in
FBH the difference, corresponding to 3.82 years, is somewhat lower. In
thus the logic of “remaining life expectancy” of 10 years (Cfr.: RYDER, 1975). In the light of
this logic we computed, by interpolation, the age corresponding to 10 years of remaining life
expectancy which in Bosnia and Herzegovina is equal to 71.84 years of age for men and 72.76
for women, while in the FBH it corresponds to the age of 71.68 years for men and 72.96 for
women.
10
Clearly, this is also true for other mortality indicators such as the probable length of life (or
median length of life) and normal length of life (or the point of Lexis).
11
As for the determinants and paradoxes linked to the phenomenon of male supermortality cfr.,
e.g.: SCARDOVI (1961); VALLIN (2002).
11
addition, having in regard that the mortality varies greatly in relation to age and
sex, we retain necessary to analyze the differences also in terms of risks of
dying at different ages, and for that reason we proceeded with the construction
of Figure 512.
Fig. 5 – Male supermortality in relation to age.
Source: See Table 2.
Primary, Figure 5 shows the peak in male supermortality at the age group
25-29 in which the risk of dying for men is 3.5 times higher than in the case of
women. This data, however, should be considered having in mind that this age
group is generally characterized by low probabilities of dying for both sexes
and that mainly violent deaths (caused by car crashes and other accidents) –
which are leading causes of death for those aged 15 to 29 – are the one to make
the difference. Nevertheless, the most important information that emerges from
the above Figure is: a) the particularity of the curve’s trend; b) the fact that
12
The index generally adopted to analyze gender differentials in terms of the risk of dying is the
following:
[4]
,
in which the meaning of symbols is evident.
12
male supermortality is, by and large, more emphasized at the national level in
comparison to the sole FBH13.
4. Some Final Remarks
The construction of (abridged) life tables, not only for Bosnia and
Herzegovina but also for one of its two entities (FBH), has allowed us to draw
some conclusions on recent and most important features of mortality
phenomenon in the country of reference. Firstly, on the basis of our results the
life expectancy at birth has reached the age of 73.35 years for men and 77.56
years for women, recording thus an increase of 20.77 years for males and 22.79
for women in comparison to the values of 1952-195414. Moreover, the life
expectancy at birth for men in FBH generally corresponds to the values
obtained at national level, while it reveals to be slightly lower for the FBH
women. However, a thorough analysis concerning the distribution of
probabilities of dying and mean expectation of life has pointed out the existence
of gaps related to sex as well as to different age groups among two territories
under consideration. The overall analysis of recent manifestations of the
phenomenon in the reference area has reaffirmed the general concept according
to which not all age groups contribute in the same measure to increase the
values of life expectancy at birth.
To conclude, we wanted to assess the type of implications that mortality
reduction and its current assets might have had on the age structure of analyzed
populations. Considering that the fertility decline together with the mortality
contraction – that converted into a major longevity of populations – have been
the generator of the population aging process, we retained important to analyze
13
Regarding the mortality gaps between different ethnic groups (Croats, Muslims and Serbs)
cfr., e.g.: COURBAGE (1991). Considering as a very sensitive and difficult issue the definition of
the term “ethnic”, especially in the period following the Jugoslav dissolution, as well as the
problems deriving from the analysis of data classified under the category “ethnic”, we have
decided not to carry on with the research similar to one proposed by Courbage since we believe
that, given the current assets in the Bosnian country, the data might not correspond to the real
facts. Since, however, the postwar partition of Bosnia and Herzegovina was made considering
the presence of ethnic groups on the territory (see par. 2.1) one should have in mind that,
implicitly and with lots of precautions, some hypothesis concerning mortality gaps among
different ethnic groups might be formulated as well.
14
On the basis of life tables for 1952-1954, elaborated for Bosnia and Herzegovina by (then)
Institute of Statistics of Jugoslavia, the life expectancy at birth was 52.58 years for men and
54.77 years for women (cfr. Statistical Yearbook of Jugoslavia, Federal Institute of Statistics of
Jugoslavia, 1990).
13
this latter aspect as well. On the basis of life tables elaborated for this occasion
we computed the Aging index which represents the ratio between the mean
expectation of life at the threshold of old age (λ = 60 and/or λ = 65) and the life
expectancy at birth multiplied by the probabilities surviving at the age of λ, that
is:
.
[5]
From the results reported in Table 5 arises that the demographic aging
process – related to our life tables – has arrived at an advanced stage, by
reaching the share of 15.4% for men and 18.2% for women aged 65 years and
above in Bosnia and Herzegovina and presenting similar outcomes also in the
FBH. On the other side, the aging index appears to be higher by a little more
than 5.5 points if we apply the same logic in reference to the population aged
60 years and above.
Tab. 5 – Aging index of stationary populations related to life tables.
Age (λ)
Bosnia and Herzegovina
Male
60 years
65 years
20.89
15.38
Female
24.07
18.24
FBH
Male
20.98
15.33
Female
23.89
18.03
Source: See Table 2.
The picture, however, changes significantly when considering the real
populations (see Table 6) since:
a) Systematically the age index values are lower than those reported in
Table 5;
b) Gender gaps appear to be more pronounced, most likely due to different
incidence of past war events on mortality and, most probably, on
migratory phenomenon too.
14
Tab. 6 – Aging index of populations currently living in Bosnia and Herzegovina
and FBH.
Age (λ)
Bosnia and Herzegovina
(30-06-2010)
Male
Female
FBH
(31-12-2010)
Male
Female
60 years
17.89
21.72
15,83
20.03
65 years
13.30
16.80
10,78
14.41
Source: See Table 2.
This heterogeneity of these results underlines particularly two aspects: due to
further reduction of risk of dying – as well as due to existence of deficitary
fertility (i.e. in presence of total fertility rates) below the replacement level
(TFR = 2.10) – the population aging in the next years should increase
substantially. Moreover, in the following years the local demographic transition
processes should contribute to make less irregular sex and age structures of our
populations15.
In overall, we can retain that our research activity regarding the population
of Bosnia and Herzegovina is only at its beginnings and that we intend to
expand the study of these topics once the results of the next census, to be held
in 2013, are released which would allow us to carry out our analyses by using
more satisfying and complete quantifications for two entities composing this
country.
References
AGENCY FOR STATISTICS OF BOSNIA AND HERZEGOVINA (2006-2011)
Demografija, Agencija za statistiku Bosne i Hercegovine, Sarajevo.
BONIFAZI C. /a cura/ (2002), Popolazione, ambiente e conflitti nei Balcani
degli anni Novanta, F. Angeli, Milano.
15
Throughout our analyses, it has also been observed that at infant age groups the gender ratio
appears to be slightly higher in comparison to what are known to be its traditional values, a fact
that might suggest a presence in these populations of certain sex-selective abortion practices,
although they are not extremely widespread. Using data on live births it has been calculated that
the gender ratio at birth in Bosnia and Herzegovina was equal to 108.77 in 2009 and 106.21 in
2010, while in the FBH the ratio was 107.60 in 2009 and 106.84 in 2009.
15
BOŠNJOVIĆ I. (2007) The Population of Bosnia and Herzegovina in the Second
Half of the 20th Century, in PARANT A., SARDON J.P., Les mutations de la
décennie 1990 et l’avenir démographique des Balkans, Demobalk and INED.
COURBAGE Y. (1991) Surmortalité féminine chez les Musulmans en
Yougoslavie: Islam ou culture méditerranéenne?, “Population”, No. 2.
DI COMITE L. (1969) Sulla mortalità per causa, “Studi di demografia”, No 4.
FEDERAL INSTITUTE OF STATISTICS OF JUGOSLAVIA (1990) Statistički godišnjak,
Federalni Institut za statistiku Jugoslavije, Beograd.
FEDERAL OFFICE OF STATISTICS (2006-2011) Demografija, Federalni zavod za
statistiku Federacije Bosne i Hercegovine, Sarajevo.
GHOBARAH H.A. et al.STAT (2004) The Post-War Public Health Effeccts of
Civil Conflict, “Social Science & Medicine” No. 59.
GIRONE S., GRUBANOV -BOŠKOVIĆ S (2012) The Land of “South Slavs”.
Between Old and New Demographic Assets, “Cogito”, Vol. IV, No. 3.
HOVY B. (2011) Koliko ih je napustilo zemlju? Raseljavanje građana bivše
Jugoslavije, in PENEV G. (edt), Migracije, krize i ratni sukobi na Balkanu s
kraja 20. Veka, Demobalk, Beograd.
ISTAT (2011) Tavole di mortalità della popolazione italiana 2009, Istituto
Nazionale di Statistica, Roma.
MANN J. (1994) Bosnia: War Against Public Health, “Medicine & Global
Survival”, Vol. 1, No. 3.
KOTZAMANIS B., PARANT A. (2002) L’Europe balkanique: une Europe
différente et diverse, in DI COMITE L., PELLICANI M. C. (edts), Popolazione e
migrazioni nei Balcani, No. 23.
OBERMEYER Z., MURRAY C. J., L.,GAKIDOU E. (2008), Fifty Years of Violent
War Deaths from Vietnam to Bosnia: Analysis of Data from the World Health
Survey Programme, “British Medical Journal”, No. 336.
PRESSAT R. (1961), L’analyse démographique, Presses Universitaires de
France, INED, Paris.
16
RYDER N. (1975) Notes on Stationary Populations, “Population Index” Vol. 41,
No. 1.
REED L. J., MERRELL M. (1939) A Short Method for Constructing an Abridged
Life Table, “American Journal of Hygene”.
UNITED NATIONS (2011) World Population Prospects: The 2010 Revision, New
York (http://esa.un.org/unpp/)
SCARDOVI I. (1961) In tema di “supermortalità” maschile, “Statistica”, No. 3.
VALLIN J., BERLINGUER G. (2002), De la mortalité endogène aux limites de la
vie humaine, in CASELLI G., VALLIN J., WUNSCH G. (edts), Démographie:
analyse et synthèse. Les déterminants de la mortalité, INED, Paris.
VALLIN J. (2002), Mortalité, sexe et genre, in CASELLI G., VALLIN J.,
WUNSCH G. (edts), Démographie: analyse et synthèse. Les déterminants de la
mortalité, INED, Paris.
ZWIERZCHOWSKI J., TABEAU E., (2010), The 1992-95 War in Bosnia and
Herzegovina: Census-Based Multiple System Estimation of Causalities’
Undercount, Conference Paper “The Global Costs of Conflict”, Berlin.
17
© Copyright 2026 Paperzz