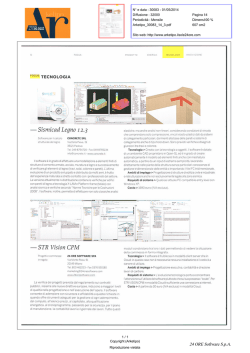
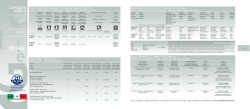
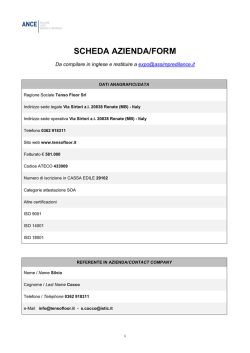
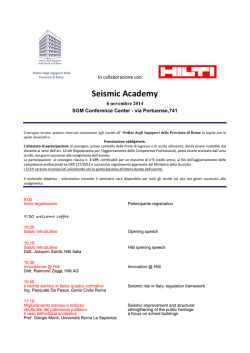
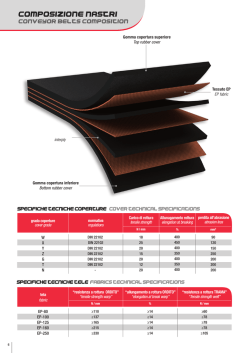
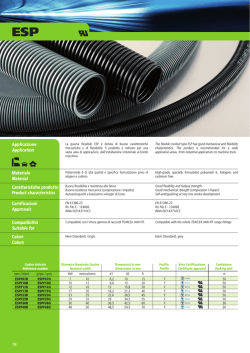
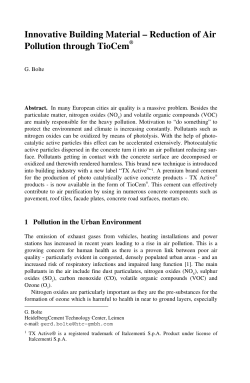
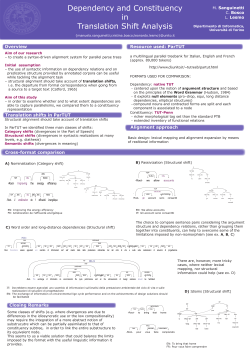
Proceedings of the Ninth Pacific Conference on Earthquake Engineering Building an Earthquake-Resilient Society 14-16 April, 2011, Auckland, New Zealand Paper ID139 Seismic assessment of the R/C buildings: the case study of Di.Coma.C Centre after the L’Aquila (Italy) 2009 seismic sequence F. C. Ponzo1, A. Mossucca1, A. Di Cesare1, D. Nigro1 1 Di.S.G.G., University of Basilicata, Potenza, Italy M. Dolce2, C. Moroni2 2 National Seismic Survey, Rome, Italy ABSTRACT: On the 6th of April 2009 a Mw = 6.3 earthquake occurred in the region of Abruzzo situated in central Italy having an epicenter very close to the centre of the city of L’Aquila. The event produced casualties and damage to buildings, lifelines and other infrastructures. The headquarters of the post-earthquake emergency management, directed by the command and control (Di.Coma.C) task force, was established temporarily in the training academy of the Guardia di Finanza (Finance Police). This complex of structures is located 3km from the epicenter of the earthquake in the suburb of Coppito. During the first two months following the event, all the buildings in the complex were subjected to an extensive Seismic Vulnerability evaluation. The academy complex is principally composed of r/c structural buildings with the addition of some steel and precast r/c structures .This fast seismic evaluation was performed in order to assess the structural safety level of all buildings and their suitability for hosting the emergency response coordination as well as special events such as the G8 summit which took place on the 8th of July 2009. All activities were carried out in coordination with the Italian civil defense department and RELUIS (a Network of Seismic Engineering Laboratories). Several operation units (UO) coming from different Italian universities participated in the structural assessment and the general outcomes of the vulnerability assessment performed by the University of Basilicata (UNIBAS) are reported in this paper. In particular, the results of: (i) the building damage assessment, (ii) in-situ diagnostic investigations on constitutive materials, (iii) dynamic identification tests and (iv) the evaluation of the residual resistance of the structure through a simplified procedure are detailed. 1 INTRODUCTION This study was aimed at assessing the real seismic vulnerability of the four main buildings forming the training academy of the Guardia di Finanza (Italian fiscal police) in the suburb of Coppito (AQ). The assessment was performed in terms of the estimation of the earthquake intensity that would lead to a certain condition of damage and/or collapse. This objective has been achieved through an approach which used a simplified calculation model, specifically developed for the assessment of the seismic vulnerability of existing buildings (Dolce et al. 2005c). On the basis of the building characteristics and through a preliminary analysis of the possible collapse mechanisms the algorithm identifies the most probable mechanism of collapse for the building under analysis. The level of reliability of the simplified method is related to the adequacy of model and to the completeness of the information concerning the geometry of structural elements, characteristics of the constituting materials and the arrangement of longitudinal and transversal reinforcement. A reliable assessment of the vulnerability for reinforced concrete buildings is, also, strictly connected to the evaluation of the mechanical characteristics of the constitutive materials, that can be particularly complex for concrete, due to the high variability of its resistance, depending on intrinsic factors such as the composition as well as the Paper Number 139 environmental and maturing conditions, and other factors attributable to the collection technique and reworking of the concrete sample and the test conditions in general (Barlet 1994). 2 METHODOLOGICAL APPROACH 2.1 Cognitive process of existing structures The knowledge of an existing structure is never complete and the level and accuracy of construction details obviously corresponds commensurate with the available project material, time and cost available for geometrical investigations and experimental tests carried out on the structural elements. In order to achieve a suitable level of knowledge regarding the structure, all the useful available data in order to define the original structural characteristics (geometry, materials) and their possible variations have been collected . Through the analysis of the acquired data 6 building types have been identified made up of a total of 24 independent bodies, all constructed from reinforced concrete. Each different type can be distinguished by its geometrical and structural characteristics and intended use. Figure 1 shows an overview training academy of the Guardia di Finanza plan with the locations of the four studied structural assemblies (indicated as A, B2, C1 and C2). The overall area of the buildings under assessment is approximately 65,000 sq. m. All the structural bodies are made up of in-situ cast beams and columns. C2-4 Type 4 Type 2 C1 C2 Type 3 1 2 3 1 2 3 4 5 6 4 5 6 1 2 3 4 5 6 7 8 9 Type 5 Type 6 C1-3 B2-9 B2 A-2 Type 1 A 1 2 3 Figure 1 – Location and plan view of the structural assembly of training academy of the Guardia di Finanza, L’Aquila, Italy 2.2 Planning of investigations and levels of knowledge The survey operational program was organised in order to allow the assessment of all buildings in a very short time period. The number of reinforced concrete beams and columns to be tested was fixed to the specific building type in order to exploit the similarities present in the structural form. The level of knowledge achieved, LC3 (Accurate knowledge), is the maximum considered by the current Italian code (Circular 2nd February 2009 n. 617/C.S.LL.PP.). The intent of the present study was to achieve this highest level of knowledge, although this requires more intensive work in the investigation of the structural materials. In fact, by carrying out a wider range of in situ tests it is possible not only to achieve the best assessment of the examined structures but also adopt lower safety coefficients and thus higher calculation resistances. This in turn reduces the extent and cost of the actions required for the improvement or seismic retrofit of structures, if needed. For the characterization of the mechanic properties of the concrete non-destructive (NDT) and destructive (DT) tests were carried out. The available tests for evaluating the concrete resistance range from completely non-destructive tests, where there is no damage to the concrete, through methods where the concrete surface is only slightly damaged, to partially destructive or destructive tests, where the surface has to be repaired after the test. 2 Nondestructive testing methods are noninvasive techniques to determine the integrity of a material, component or structure, or quantitatively measure some specific characteristic. Unlike the destructive tests, NDT can act without harming, stressing or destroying the test object. The necessary destruction of the test object usually makes destructive testing more costly, and these testing methods can also be inappropriate in many circumstances. Therefore the use of NDT plays a crucial role in ensuring a cost effective operation. The non-destructive methods used in this study are the surface hardness method coupled with the ultrasonic method which. As these methods are influenced in different and/or opposite ways by some fundamental parameters, their combined use allows outputs with minimal dispersion to be obtained. The Concrete Core Extraction and Compression method was used as a destructive technique to determine the compressive strength of the concrete. Several cores, as a proportion of 1 to 4 compared to non-destructive investigations, have been extracted from the existing structure members. Both the results from the destructive and non-destructive test were combined in order to estimate the in situ concrete strength using the SonReb method. The dynamic identification technique was also used to assess the modes and frequencies of vibration of the examined buildings and indirectly estimate and/or confirm the Young’s modulus of the concrete. Finally, the dynamic response of the numerical models used for structural analysis was also calibrated using these results. 2.3 Simplified method of structural assessment The numerical models used for the structural analysis are simplified models allowing a reliable assessment as a function of the knowledge concerning materials, executive details, fundamental periods and foundation soil type. The models, based on the VC procedure (Vulnerability of reinforced Concrete buildings by Dolce, 2005a), can take into account some factors which can affect the adequacy of the model, such as the irregularity of shape in plan (non-compact or non-symmetric plan), the irregularity of stiffness and/or resistance in plan, and the irregularity of resistance in elevation. Therefore, this kind of assessment allows a more accurate estimation of the vulnerability and risk, thus eliminating the need for using, for some structural aspects, qualitative assessments. In order to assess the column resistance in the event that the fragile shear failure surpasses ductile failure for combined compressive and bending stress, the formulation of Eurocode 2 was referred to. The behaviour of structures whose columns show fragile behaviour due to shear mechanisms (for example stubby columns in staircases, columns inserted into strip windows, etc.) is captured through the definition, in each direction, of an effective flexural length of each pillar which could be different - perhaps significantly - from the inter-storey height, in relation to the interactions with other structural and nonstructural elements (Dolce, 2005b). In the determination of the peak ground acceleration for which structural collapse is expected, a ductility coefficient which considers: 1) the ductile ability of the structure as a whole, 2) possible concentrations of demand due to irregularities, and 3) the column ductile capacity for each level was introduced as a function of the likely failure mode (i.e. ductile or fragile bending in relation to the member’s level of compression and shear). Figure 2 – Methodological approach. 3 3 DIAGNOSTICS AND STRUCTURAL MONITORING 3.1 Dynamic identification tests On 4 of the 24 buildings analysed, two dynamic identification test sessions were performed, both under environmental noise conditions, by following two different approaches: i) the first simplified by using a limited number of sensors located on the highest level and at the foot of the building (Ponzo 2010); ii) the second more complex, by putting on each level, including the structure basement, a series of three sensors. The experimental periods have been compared with the corresponding analytical values obtained from the numerical models for the simplified structural analysis based on the VC procedure. The results of this comparison, for the modal components translational X, Y and rotation Z are shown in Table 1 . Table 1. Experimental and analytical results: comparison of the fundamental periods of vibration X longitudinal Dir. ID building A B2 C1 C1 C2 C2 2 7 3 6 2 4 Y transversal Dir. RZ Rotation experimental analytical experimental analytical experimental analytical 0.32 0.17 0.17 0.18 0.17 0.10÷0.14 0.47÷0.66 0.22÷0.30 0.23÷0.32 0.19÷0.27 0.24÷0.33 0.35 0.18 0.19 0.19 0.19 0.52÷0.75 0.42÷0.58 0.22÷0.31 0.22÷0.30 0.17÷0.24 0.22÷0.31 0.30 0.16 0.15 0.16 0.14 - 3.2 Non-destructive tests on concrete The range of properties that can be assessed using non-destructive tests is significant and includes such fundamental parameters as density, elastic modulus as well as surface hardness, reinforcement location and depth of cover concrete. It is generally not advisable to use the single non-destructive tests to estimate the strength in situ of concrete. In some cases it is also possible to check the quality of workmanship and structural integrity through the ability to detect voids, cracking and delamination. After identifying the points of investigation the concrete finish is removed without damaging the concrete surface. The test surface was smoothed with a grinding stone and any residual finish was removed. Preliminary tests have been performed with covermeter according to the procedures described in the British Standard 188:204. With this technique it was possible to determine the presence and size of reinforcing bars, laps, transverse steel and depth and position of reinforcement set in concrete. The space between the transverse reinforcement was measured in the central zone of both the beams and columns and for a length of approximately one meter from the joint in both members (Figure 3a). Finally, the results are documented in a separate table. a) c) b) Figure 3 – Purpose of application: a) Covermeter test results; b) Schmidt rebound hammer test; c) Ultrasonic Pulse Velocity test i) direct transmission (T); ii) indirect transmission (S); iii) semi direct transmission (ST). 4 The identification of the position of the reinforcement bars was also used as a preliminary to the other tests, such as, Core Extraction, Ultrasonic Pulse Velocity and Schmidt rebound hammer. In addition the cover concrete was removed in some areas and the diameter and type of the reinforcement was measured directly. After position of the reinforcement bars a grid of points spaced 25mm center to center was drawn. These points were also placed minimum 25mm from the edge of the reinforced concrete member, surface defects and from the rebar first detected. The Schmidt rebound hammer test (Figure 3b) was performed on these points. This test is principally a surface hardness tester and is carried out according to UNI EN 12504-2. The system works on the principle that the rebound of an elastic mass depends on the hardness of the surface against which the mass impinges. There is little apparent theoretical relationship between the strength of concrete and the rebound number of the hammer. However, within limits, experimental correlations were established between strength properties and the rebound number, however all of this cannot be generalized and should be calibrated for each type of existing concrete, for example using the results of compression tests. In the case study of Di.Coma.C. Centre, the results of the hammer tests, taken as a rebound average, Ir, was used individually to assess the homogeneity of the concrete, and in combination with the ultrasonic propagation velocity and results of destructive tests to estimate the strength of concrete at the points of non-destructive investigation. The ultrasonic test was carried out in compliance with UNI EN 12504-4 and was aimed at determining the propagation speed of a mechanical vibration pulse in concrete. Through measuring the pulse crossing time and the distance between the two probes, the apparent propagation speed can be calculated, however, this value can differ from the real value when the elastic waves undergo deviations from the path identified by the conjunction line between the two probes. When anomalies in the measured values are found in the same point of survey, several measurement bases are made (RILEM 1972). The three test procedures used in the present work are shown in Figure 3c. The factors that affect the ultrasonic test the most are linked to the concrete composition, environmental conditions and test conditions. During the surveys, the experimental results of non-destructive tests were used to create a statistical distribution of the measured sizes, by implying that the stochastic field which described them was homogeneous. Such an assumption was considered to be reasonable since, by analysing the project records and referring to the works construction steps, it was noticed that during construction, no events leading to a systematic change of the concrete quality occurred. Thus, by assuming that the results of an area statistically and qualitatively belonging to the same population of concrete, were able to progressively optimize - and in real time - the survey program by reducing the number of non-destructive tests to a total of 211. When interpreting the test results, special attention is needed regarding the presence of possible anomalies which can negatively influence the experimental assessment of the in situ concrete mechanical characteristics. Such anomalies are generally characterized through an evident correlation of the experimental datum with either a physical parameter of reference (usually compressive strength) or with respect to the trend shown by the data acquired in the same context of structural homogeneity. These anomalies usually arise from improper execution of the test or from the fact that the test was carried out in non-ideal conditions (Mossucca 2010). Table 2 shows the statistical indicators related to non-destructive surveys carried out on the four blocks studied. The variation coefficient CV of the populations of non-destructive measurements is always lower than 15%. Table 2. Summary of statistical parameters - NDT ID Average SD CV Prc 5% Prc 95% A Ir 35.9 4.9 13.6% 28.1 43.7 B2 Vm,T Ir 4002 36.2 223 2.7 5.6% 7.5% 3646 31.9 4358 40.6 Vm,T 4382 132 3.0% 4170 4594 C1 Ir 38.8 4.4 11.4% 31.7 45.9 Vm,T 4423 151 3.4% 4183 4668 C2 Ir 36.0 2.5 7.0% 32.0 40.1 Vm,T 4390 214 4.9% 4046 4732 All Ir 37.7 4.8 12.8% 30.0 45.4 Vm,T 4334 242 5.6% 3947 4720 where: Ir = rebound average; Vm,T = average ultrasonic velocity (direct transmission); SD = Standard deviation; CV= coefficient of variation; Prc % = percentile confidence interval. 5 This limiting value is usually seen as a threshold value above which a population of concrete is no longer considered as homogeneous (Pascale 2007). Furthermore, the CV value with reference to the mean ultrasonic speed Vm,T is always markedly lower than the that which of the rebound average Ir. In addition to expressing the variability of the population of measures, standard deviation was also used as a measure of confidence in the statistical conclusions. Superior and inferior margins of error or anomaly of the VmT and Ir parameters were assumed, respectively, to be equal to the rays of a 95 and 5 percent confidence interval. In this way normal random errors or variations in the measurements were distinguished from causal variation. 3.3 Destructive tests on concrete Although the compressive strength of concrete removed in situ can be altered by several factors, values measured in this way are certainly to most reliable possible. In the case study of the Di.Coma.C Centre, compressive strength testing was performed on 39 specimens derived from the same number concrete core extractions. The core drill bits are composed of hollow cylinder (diameter equal to 100mm) with square teeth along the bottom edge and an enclosed top that attaches to a threaded stud located on the drill core. Due to the large size of core drill bits, it is necessary to secure the core drill to the concrete which is being drilled. While operating the core drill, water is applied to the core drill bit with a pump attached to the core drill. Using a masonry saw, the core is trimmed to the correct test length, which varies upon the standard being adopted. Immediately after extraction the core concrete was tested for carbonation. Carbonation of the concrete occurs when carbon dioxide in the atmosphere and in the presence of moisture, reacts with hydrated cement minerals to produce carbonates, e.g. calcium carbonate. The carbonation process is also called depassivation. Carbonation penetrates below the exposed surface of concrete extremely slowly. The significance of carbonation is that the usual protection of the reinforcing steel generally present in the concrete due to the alkaline conditions caused by the hydrated cement paste is neutralized. Thus, if the entirety of the concrete covering the reinforcing steel is carbonated, corrosion of the steel will occur if moisture and oxygen can reach the steel. Depth of the carbonated layer measured on the surfaces of hardened concrete and for the structural systems A, B2, C1 and C2 the level of carbonation was equal to 10÷30mm, 0÷15mm, 0÷0mm, 0÷7mm respectively. Following trimming, the ends of the core were either ground perfectly flat, or capped with a material to produce a smooth bearing surface. After the prescribed curing had taken place, the specimen was then compressed to failure noting the maximum load achieved. 4 ESTIMATION OF COMPRESSIVE STRENGTH CONCRETE 4.1 Reassessment of the compressive strength Core testing is the most direct method to determine the compressive strength of concrete in a structure. A total of 39 cores were obtained to evaluate the structural capacity of structural systems based on the actual in-place concrete strength. The process of obtaining core specimens and interpreting the strength test results is often confounded by various factors that affect either the in-place strength of the concrete or the measured strength of the test specimen. The scatter in the strength test data, which is unavoidable given the inherent randomness of the in-place concrete strengths and the additional uncertainty attributed to the preparation and testing of the specimen, may further complicate compliance and evaluation decisions. In this paper the reassessment of concrete's strength was done using the A.C.I. 214.4R-03 guidelines which summarize current practices for obtaining cores and interpreting core compressive strength test results. Factors that affect the in-place concrete strength are reviewed so locations for sampling can be selected that are consistent with the objectives of the investigation. The expression (1) is used to calculate the compressive cylinder strength of the concrete (fc). Strength correction factors are presented for converting the measured strength of non-standard core-test specimens to the strength of equivalent specimens with standard diameters, length-todiameter ratios, and moisture conditioning. fc = Fl/d · Fdia · Fmc · Fd · fcore (1) 6 where: fc = compressive cylinder strength of concrete revaluated; fcore = compressive strength of cylindrical concrete specimens; Fl/d = factor that considers the influence of the size of the specimen, depending on the strength fcore and the moisture conditioning; Fdia = factor depending on the diameter of the specimen; Fmc = depending to the specimens' moisture; Fd = function of the disturbance to the sample during drilling. The expressions of the remedial factors are available in the A.C.I. 214.4R-03 guidelines. The compressive strength of the cubic concrete specimens (Rc) is determined by the resistance (fc) through the usual relationship: Rc = fc/0.83 (2) 4.2 The Sonreb Method The Sonreb method is the principal non-destructive combined method used for quality control and strength estimation of in situ concrete. The combination of Schmidt Rebound Hammer with Ultrasonic Pulse Velocity results increased the accuracy of the estimation of the in situ compressive strength of the concrete (Braga 1992). The general law of the Sonreb method is described by the following expression: Rc SonReb = a ·Ir b ·Vm,T c [MPa, m/sec] (3) where Ir = rebound average; Vm,T = average ultrasonic velocity (direct transmission); a,b and c = constants calculated by the Least Squares Method applied to the expression (3). Obviously, the reliability of these formulas is affected by the choice of the coefficients a,b and c which depend on the type of in situ concrete, the size and type of aggregate, cement used in the making of the conglomerate, the water-cement ratio, compression strength, the age of manufacture and other factors that depend on the state of preservation and exposure of the structure. Thus, for each complex A, B2, C1, and C2 an experimental calibration of the coefficients a, b and c was made. This was performed using a set of values Rc, Ir and Vm,T, following which the concrete strength of the elements investigated with only non-destructive testing was estimated. Tab. 3 and Figure 4 shows, the mean and characteristic values as well as the relative frequency histograms of concrete's strength populations for complex A, B2, C1, C2 (N= number of samples). 35 35 % 30 N=41 35 % 30 25 N=90 25 A 20 35 % 30 N=42 25 B2 20 C1 20 15 15 10 10 10 10 5 5 5 MPa 10 20 30 40 50 60 20 5 MPa 30 40 50 0 10 60 C2 20 15 0 10 N=38 25 15 MPa % 30 20 MPa 30 40 50 60 0 10 20 30 40 50 Figure 4 – Histograms of relative frequencies of concrete's strength populations. Table 3. Summary of statistical parameters of populations of data Rc and RcSonreb ID A B2 C1 C2 Mean Max Min SD CV Prc 5% Prc 95% (MPa) 30.30 41.00 39.10 37.44 (MPa) 38.0 58.3 53.7 43.3 (MPa) 23.1 28.4 32.3 31.4 (MPa) 3.9 6.9 3.9 2.8 (%) 12.8% 17.1% 9.6% 7.4% (MPa) 24.1 29.5 34.0 33.0 (MPa) 36.5 51.7 46.3 41.9 7 60 5 ASSESSMENT OF VULNERABILITY AND SEISMIC RISK 5.1 Qualitative/Quantitative analysis : Conclusions Using this simplified methodology, which assumed a single storey collapse mechanism based on a strong beams–weak columns behavior two different levels of structural condition (damage limit state and collapse) were considered. Table 4 shows the synthesis values of quantitative and quantitative analysis carried out. The parameters used to indicate the seismic collapse risk u, and the damage limit state e, were expressed as a ratio between the ground acceleration would achieve a certain limit state and the corresponding projected acceleration. The calculated values u and e resulted close to or greater than unity thus providing an acceptable level of safety according to the Italian Code. The calculation method used was considered sufficient considering the buildings do not present significant irregularities. In the definition of the material resistance a resistance factor of 1 was adopted (for an accurate level of knowledge LC3). Referring to Table 3 it is evident that only in the case of complex A did the cubic compressive strength present a characteristic value lower than the design value (Rck 30 MPa). By exploiting the typical characteristics of the buildings the methodology used for assessing the seismic vulnerability has allowed to optimize in situ test results, accuracy well as and computational complexity, processing time and cost of the whole operation. Table 4. Summary of quantitative/qualitative analysis ID Building u e Overall structural quality A B2 C1 C1 C2 C2 2 2 3 6 2 4 0.82 1.06 1.20 1.10 0.90 1.10 0.72 0.94 0.98 1.01 0.97 1.01 acceptable acceptable acceptable acceptable acceptable acceptable Suitable model / available information acceptable acceptable acceptable acceptable acceptable acceptable Non-structural vulnerability Medium Low Medium Low Medium Low 6 REFERENCES A.C.I. 214.4R 2003. Guide for Obtaining Cores and Interpreting Compressive Strength Results. Barlet, F.M. & MacGregor, J. 1994. Effect of Core Diameter on Concrete Core Strengths. ACI Materials Journal, V. 91, No. 5, September-October 1994. Braga, F., Dolce, M., Masi, A., Nigro, D. 1992. Valutazione delle caratteristiche meccaniche dei calcestruzzi di bassa resistenza mediante prove non distruttive. L’Industria Italiana del Cemento, 3, pp. 201-208. Dolce, M. & Moroni, C., 2005a. La valutazione della vulnerabilità e del rischio sismico degli edifici pubblici mediante le procedure VC (vulnerabilità c.a.) e VM (vulnerabilità muratura). Atti del Dipartimento di Strutture, Geotecnica, Geologia applicata all’ingegneria, 2005a. Dolce, M., Liberatore, D., Masi, A., Moroni, C., Ponzo, F., Di Cesare, A., Mossucca, A. 2005b. Applicazione delle procedure VC e VM agli edifici scolastici della provincia di potenza per le valutazioni di vulnerabilità e rischio sismico. Atti del Dipartimento di Strutture, Geotecnica, Geologia applicata all’ingegneria, 2005c. Dolce M., Moroni, C., Cardone, D., 2005c. Validazione su prove sperimentali della procedura VC per le valutazioni di vulnerabilità e rischio sismico di singoli edifici in c.a., Atti del Dipartimento di Strutture, Geotecnica, Geologia applicata all’ingegneria, 2005b. Mossucca, A., Ponzo, F., Nigro, D. 2010. Analisi degli aspetti critici per la valutazione sperimentale delle caratteristiche meccaniche del calcestruzzo. Convegno strategie di sviluppo sostenibili per le costruzioni in Cina, in Europa ed in Italia – Roma. Pascale, G. 2007. Advanced Courses of Non-destructive testing for the diagnosis of civil structures. Ponzo, F., Ditommaso, R., Auletta, G., Mossucca, A. 2010. A fast method for a structural health monitoring of Italian reinforced concrete strategic buildings. Bulletin of Earthquake Engineering. DOI: 10.1007/s10518010-9194-6. Volume 8, Number 6, Pages 1421-1434. RILEM Reccomendation NDT 1, Testing of Concrete by the Ultrasonic Pulse Method, Paris, December 1972. 8
© Copyright 2026 Paperzz