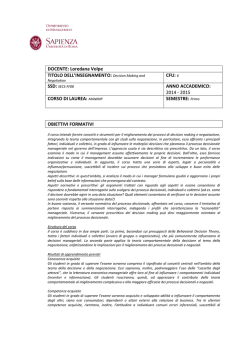
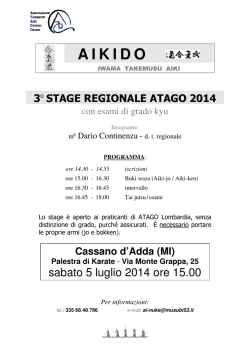
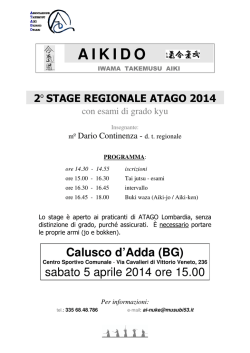
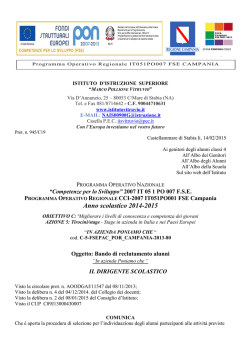
Discussion Papers in Economics
No. 2000/62
No. 1999/22
Dynamics of Output Growth, Consumption and Physical Capital
Do People
(Want
to) Plan? Growth
in Two-Sector
Models
of Endogenous
by
by
John Hey
Farhad
Nili
Department of Economics and Related Studies
University of York
Heslington
York, YO10 5DD
Do People (Want to) Plan?
John D. Hey
Università di Bari
University of York
Abstract
Central to many theoretical accounts of the process by which (rational) people tackle dynamic decision
problems is the concept of a plan: a set of conditional decisions as to what would be decided under certain conditions
(imposed by Nature). The notion of a plan is clearly central to theories of dynamic decision making in which backward
induction and the Principle of Optimality are invoked. To many theorists, the adoption and subsequent implementation
of a plan are almost axioms of rational behaviour. These theorists ask two questions: how can dynamic decisions be
taken in the absence of a plan; why would anyone want to change the plan once it is embarked upon.
Experimental economists have begun to explore the implications of these notions. For example, work by Robin
Cubitt and his associates has investigated whether the way a dynamic decision problem is formulated and presented to
the subjects has any effect on the decisions taken by the subjects; if the subjects have a plan, and implement it in the
sense discussed above, there should be no effect. Cubitt and his associates find some effect. With Massimo Paradiso I
have investigated whether subjects have preferences over different formulations and presentations, for example,
whether subjects prefer to be forced to pre-commit themselves (to a plan) or whether they prefer the flexibility of not
being pre-committed. Of course, if subjects have a plan in the sense discussed above they should be indifferent between
all such alternative formulations (of the same choice problem). However, we find they are not.
Of course, subjects could behave the same yet have differing preferences; they could, conceivably also have
identical preferences but behave differently, but neither of these types of experiments casts direct light on the key
question as to whether subjects have plans and implement them. This is the purpose of the new experiments reported in
this paper.
These experiments were difficult to design because of the difficulty of observing correctly whether a plan
exists in the subject’s mind, and particularly because of the difficulty of getting the subject to honestly reveal the
existence and nature of a plan. The problem is simple: if the subject is not going to be forced to follow the announced
plan, what incentive is there for reporting it honestly? And if the subject is forced to follow the announced plan, then the
dynamic choice problem has been transformed into a static (pre-commitment) choice problem - and the very thing that
we want to examine has been transformed away.
We have an experimental design which overcomes these problems. The paper reports on the results of an
experiment carried out by ESSE (Economia Sperimentale al Sud d’Europa) in Bari.
Mailing address:
John D. Hey
Department of Economic,
University of York,
YORK YO1 5DD,
e-mail: [email protected] or [email protected]
We wish to thank the European Community under its TMR Programme Savings and Pensions
(TMR Network Contract number ERB FMR XCT 96 0016 (“Structural Analysis of Househld
Savings and Wealth Positions over the Life Cycle”)) for financing the experiment reported in this
paper and for financing the experiment reported in Paradiso and Hey (1999).
Do People (Want to) Plan?
John D. Hey
Università di Bari
University of York
1. Introduction
Central to effectively all economic theories of rational dynamic decision making is the
concept of a plan. Yet this is a remarkably slippery concept. The purpose of the experiment
reported in this paper is to try and get some empirical grip on this concept.
Let me begin at the beginning. First I define what I mean by a dynamic decision problem.
Second I describe the various economic approaches to modelling (rational) behaviour in such
decision problems. Third I describe my experiments.
By a dynamic decision problem I mean a sequence of moves by the decision maker and by
Nature. For simplicity, I assume that the decision maker and Nature take turns – that is, each move
by the decision maker is followed by a move by Nature and each move by Nature is followed by a
move by the decision maker. I further assume that there is an eventual end-point to the decision
process – at which point the decision maker gets some payoff. If we think of the moves at each
stage being finite in number, then we can envisage the decision problem as a tree with the final
branches of the tree leading to some payoff to the decision maker. I assume that it is a decision
problem under risk that we are considering, so that the moves by Nature are non-strategic and can
be described in probabilistic terms. The decision maker is assumed to know all the moves that he or
she and Nature can make, knows the probabilities associated with each move by Nature, and knows
the complete set of final payoffs. To avoid unecessary complications, I assume that there are no
intermediate payoffs, though if there were this would not change the nature of the problem that we
are considering here. I call nodes at which the decision maker moves choice nodes and those at
which Nature moves chance nodes.
2
Let me now turn to economic theory. All popular theories1 of dynamic decision making in
economics are essentially built on a theory of static decision making, but they also involve some
concept of how dynamic decision problems are processed by (rational) individuals. There are two
main approaches. The first – which I shall call the strategy approach – involves the decision maker
converting the original dynamic choice problem into a static strategy choice problem. A strategy is
a set of conditional decisions, conditional on the various possible moves by Nature. In a large tree,
with many chance and choice nodes, the number of possible strategies may be very large and the
description of each of them extremely complicated, but it is assumed that the decision maker can
make all the necessary calculations. Each strategy then defines a set of moves by the decision maker
to each possible move by Nature: if Nature does such-and-such then the strategy implies a particular
response by the decision maker. The decision maker’s problem is now reduced to that of choosing
the best strategy out of the set of all possible strategies.
A strategy effectively involves the removal of the choice nodes from the tree, but we
are still left with a tree. At this point it is normally assumed that the tree is reduced in some way –
the most obvious way being that of using the reduction of compound lotteries axiom. This then
means that each strategy implies a single-stage gamble over a set of final payoffs. The decision
maker is able to calculate the probabilities associated with each final payoff – so each strategy is
effectively a single-stage gamble over final payoffs with known probabilities. In this way the
dynamic choice problem is reduced to a (single-stage) static choice problem under risk. We can
now invoke some appropriate theory of static decision making under risk to determine the optimal
strategy - using the decision maker’s preference function relevant to static decision problems under
risk. This could be Expected Utility theory or one of the many alternatives currently popular in the
literature2.
1
See, for example, Cubitt (1996), Hammond (1988a and 1988b), Kreps and Porteus (1978 and 1979), Machina (1984
and 1985), McLennen (1990) and Segal (1990).
2
A partial description of these can be found in Hey (1997).
3
The second theoretical approach to the processing of dynamic decision problems – the
backward induction
approach - is that using backward induction, or alternatively Bellman’s
Principle of Optimality. Here the decision maker works backwards, starting at the set of final choice
nodes and deciding, for each of the final choice nodes, using whatever static theory of decision
making is appropriate for the decision maker, which is the best decision at that node. The suboptimal decisions are then cut out of the tree and the tree reduced accordingly. The decision maker
continues to work backwards, now moving to the set of penultimate choice nodes, reducing the
subsequent branches of the tree (which are now determined only by chance nodes) to a single set of
branches (again using the reduction of compound lotteries procedure) and then again using the
appropriate static preference function to determine the best decision at each of the penultimate
choice nodes. The decision maker continues to work in this fashion until he or she works backwards
to the first choice node. By this time, the decision maker has determined the optimal decision at
each choice node in the tree. The decisions can then be implemented – with the decision maker
invoking the previously determined optimal decisions conditional on whatever Nature has chosen to
do.
These two approaches to processing a dynamic decision problem may appear quite different.
Indeed one might suspect that they might lead to different decisions ex post (that is, in the light of
moves by Nature). It is here where Expected Utility theory plays its trump card: only with it as the
decision maker’s static preference functional do these two approaches lead to the same ex post
decisions in all decision problems3. This effectively is the consequence of the Expected Utility
static decision rule being linear in the probabilities (and by the use of the reduction of compound
lotteries axiom to reduce a compound lottery to a single-stage lottery). Other static preference
functions almost certainly imply different ex post decisions4.
However, common to both approaches is the concept of a plan: the decision maker plans in
advance the moves that he or she will make at each choice node. There then seems to be no reason
3
In general, though there will be specific exceptions to this general rule.
4
why the decision maker should not implement that plan. Indeed if the individual forsees in advance
that he or she might do something different from that planned, then that should be anticipated ex
ante and the appropriate implications built in to the decisions planned. In a sense that is what
Ulysess did – he anticipated that he might be lured by the Sirens and so had himself tied to the mast
so that he could not change the plan that he had prepared. Not to anticipate such possible changes
implies an inconsistency on the part of the decision maker. Indeed, the adoption of a plan, and hence
the adoption of a time-consistent approach to the decision problem, seems to be a normatively
reasonable assumption of dynamic rationality. So much so that it is taken by most theorists as a
behavioural norm5. But whether it is a description of actual behaviour is less clear. Indeed the
available evidence, at least peripherally, suggests that it is not a correct description. Unfortunately
the evidence that we have is indirect. What we need is direct evidence. That is the purpose of the
experiments reported in this paper. I describe them in the third section, after I have discussed the
peripheral, indirect, evidence in the next section.
2. Existing Empirical Evidence
The two key references are Cubitt et al (1998) and Paradiso and Hey (1999). I describe these
in turn.
Cubitt et al (1998) look at the problem in a direction quite distinct from that outlined above,
indeed almost opposed to that. Their purpose is to try and shed light on the apparent violation of the
Independence Axiom of (static) Expected Utility theory through a story of dynamic decision
making. I personally feel that this violates the very spirit of (static) Expected Utility theory since I
regard this as being simply and solely a theory of static decision making. For my present purposes
however, this is irrelevant, the point being that Cubitt et al presented (different) subjects with
decision problems which looked the same from the perspective of Expected Utility theory but may
apppear different from the perspective of other theories. They used 5 different decision problems,
4
See, for an example, and for an illustration of the importance of the difference, see Segal (1990).
5
each one presented to a different set of subjects. In each problem the subjects were faced with a
choice of two decisions, A and B in what follows. Cubitt et al argued that if Expected Utility theory
was correct (though this argument requires the extension of static Expected Utility theory to a
dynamic context in one of the ways described in section 1) then the proportion of subjects choosing
A in each of the five decision problems should be the same. In fact they found, when carrying out
pairwise comparisons between these proportions, that for just two of the problems were the
proportions significantly different. These are the two problems that are of most interest to me. I
describe them below, in the form of trees.
Consider T1 as pictured below. In this and the subsequent figures the boxes are
choice nodes and the circles are chance nodes. The probabilities associated with the moves by
Nature are denoted by p and q and the final outcomes by x1, x2 and x3. The decision to move Up at
the choice node is Choice A and the decision to move Down is Choice B.
p
T1 :
q
X1
1-q
X3
X2
1-p
X3
In T1 the decision to move Up or Down is taken after Nature has moved at the first chance node.
Consider now T2 as pictured below. The notation should be explained. The box at which the
decision was taken in T1 is now drawn as dashed and there is now a new choice node at the
beginning of the tree. However, there are no moves to be made at that point – but what I mean by
this is that the decision maker must decide, at the beginning of the tree, before Nature has made its
first move, whether he or she will move Up (Choice A) or Down (Choice B) if Nature moves up at
the first chance node and the decision maker finds himself or herself at the dashed box. So the
difference between T1 and T2 is that the decision maker must pre-commit himself or herself as to
what they will do it they reach the dashed box. In Cubitt et al’s experiment they did not give the
5
For example, see McLennen (1990) and Machina (1989).
6
subjects the chance to change their decisions if they did reach the dashed box: pre-commitment did
indeed mean pre-commitment.
p
T2 :
q
X1
1-q
X3
X2
1-p
X3
In Cubitt et al’s experiment, one set of subjects was given T1 and a different set was given
T2. Subjects were randomly assigned to the two problems – 201 to problem T1 (of which just 45
survived the first move by Nature and reached the choice node) and 51 to problem T2. Interestingly,
the proportions choosing Up differed significantly: 0.289 in problem T1 (out of 45 subjects) and
0.569 in problem T2 (out of 51 subjects)6.
Why was this? Why should subjects behave differently when they have to pre-commit?
There seems no rational explanation – though suggestions have been made – since the decision
problems are identical when considered through either of the approaches to dynamic decision
making discussed in section 1. It may be the case that subjects are aware (like Ulysses) that they are
dynamically inconsisent and will do something later that they would otherwise regret. It could also
conceivably be the case that subjects find T2 too difficult to appraise and end up choosing at
random. But this seems unlikely since the decision problem seems extremely simple – almost
transparent7. Indeed this suggestion seems implausible when taken in conjuction with the result that
the proportion choosing Up (Choice A) in decision problem T3 described below was 0.667 (out of
32 subjects) and not significantly different from the proportion choosing Up (Choice A) on problem
T2 above. It should be noted that T3 is simply T2 expressed as a decision problem with the choice
6
Cubitt et al’s experiment included another 3 problems which do not concern us here, but it is relevant to note that it
was the difference in behaviour between T1 and T2 which was the only major significant difference in behaviour. This
led Cubitt et al to conclude that their “main finding is a violation of the principle which we call timing independence”
(p 1378).
7
node genuinely at the beginning of the tree. Yet T3 looks much more complicated than either T1 or
T2 .
q
X1
p
1-q
1-p
X3
X3
T3 :
p
X2
1-p
X3
In a different, but closely related, experiment (Paradiso and Hey, 1999), subjects were also
presented with 5 decision problems – the same 5 problems that Cubitt et al used. However, instead
of asking subjects which Choice (A or B) they preferred, we asked them to value the five decision
problems. We auctioned them off using an English clock auction. We then compared the valuations
for the five different trees. Interestingly we found that the only significant difference was that
between the valuation of T1 above and T2 above. (The average willingness to pay for the two
problems over all subjects and all treatments were £5.19 and £2.80 respectively.) Subjects were
willing to pay significant amounts of money for not having to pre-commit.
Again one might ask why, and again the same suggestions might be proffered, though the
two approaches to dynamic decision making discussed in section 1 imply that the valuations ought
to be identical. Again one could argue that the problem T2 is more complicated and that subjects
were unwilling to make the necessary computations in advance (when there was a chance of 1-p
that the calculation would prove to be wasted) but again there is the counter argument that decision
problem T3 looks even more complicated.
An alternative story takes us back to the concept of a plan. Perhaps subjects do not have a
plan or do not want to have a plan. Perhaps instead of looking at the problem as a whole (either by
working out strategies or by using backward induction) they prefer to work forwards through a
7
Indeed some have argued that the decision problems both here and in our experiments are too simple to shed light on
the true nature of dynamic decision making.
8
problem. Indeed, in talking to human beings, as distinct from economists, one is struck by the fact
that people do not naturally think in terms of strategies or backward induction – these are unnatural
concepts introduced and used by economists. People think of time as flowing forwards and their
natural instinct is to solve a problem by working forwards.
To an economist this is particularly important: most of our theories are built around the idea
that people plan, that they have strategies or use backward induction. If people do not plan, many of
our theories, while normatively sound perhaps, will have little descriptive content8. To shed light on
this I designed the experiment reported in the next section.
3. A New Experiment
The problem with trying to design an experiment which looks for evidence whether people
have a plan is simple: if the subject is not going to be forced to follow the announced plan, what
incentive is there for reporting it honestly? And if the subject is forced to follow the announced
plan, then the dynamic choice problem has been transformed into a static (pre-commitment) choice
problem - and the very thing that we want to examine has been transformed away. A ‘plan’, almost
by definition, is not something concrete. Indeed, if we think of the way that the word is used in
everyday speech, a plan is considered as an intention not a commitment. It is something that people
intend to implement. Yet at the same time there is the feeling that one is not committed to it – and
that the plan may be revised in the future. This is where everyday language and the economists’ use
of the word come into conflict – yet to the economist there is no reason, in the context of the
decision problems considered above, why the plan should ever be revised.
Such considerations led to the design of this experiment. I did not want to force the subjects
to commit themselves to the plan, while at the same time I wanted an incentive-compatible way of
observing the plan, if indeed it did exist. Accordingly I asked the subjects at the beginning of
decision problem T1 to say what Choice they would make if they got to the choice node, that is if
8
Further evidence for this can be found in the experimental results of Carbone and Hey (1999).
9
Nature played Up at the first chance node. I then asked them, if they did get to the choice node,
whether they wanted to implement the Choice that they had previously expressed. To give them an
incentive to state their intentions honestly, the subjects were told, right at the beginning of the
experiment, that they could change their Choice later, but that there would be a cost c of doing so.
The cost c was stated in advance. There were two treatments, each with a different cost c.
The null hypothesis can clearly be stated: if subjects do have a plan and they do intend to
implement it, then they will not change their Choice – it would clearly be irrational for them to do
so. The strategy of choosing and then changing their Choice is clearly dominated by the strategy of
choosing the same Choice and not changing the Choice. So a straightforward test of either of the
two approaches to dynamic decision making discussed above is that of observing whether any
subjects change their Choice.
The alternative hypothesis (or hypotheses) is not so easily stated. A weak alternative is that
some subjects may change their Choice and that the number of such subjects depends on the cost of
changing the choice: the higher the cost the smaller the number of subjects changing. But there is an
additional complication: the existence (and magnitude) of the cost of changing the choice may
influence the nature of the Choice in the first instance. Those subjects, for example, who fear that
they might be influenced to change from the safe Choice (Down) to the risky Choice (Up) after they
have survived the first move my Nature (fearing that they should not chance their luck too far) may
be more likely to choose the risky Choice in the first instance the higher is the cost of changing their
Choice. Contrariwise, those who anticipate feeling ‘lucky’ after Nature has played Up at the first
chance node, might be more willing to lock themselves into the safe Choice when the cost of
changing their Choice is higher. To an economist, of course, all such considerations are completely
irrational. It is therefore difficult to formulate in a sensible fashion an appropriate alternative
hypothesis.
The experiment was implemented at the University of Bari under the auspices of ESSE
(Economia Sperimentale al Sud d’Europa). A total of 172 subjects participated, 85 in Treatment 1
10
(c = £1000, all amounts are in Italian lira, £1 = £2800 Italian lire approximately) and 87 in
Treatment 2 (c = £5000). Two separate sessions were held, with the subjects being briefed verbally
with the instructions reproduced at the end of this paper. They were all given a sheet of paper, ‘Fase
1’ (that is, Stage 1) as also reproduced at the end of this paper. They filled in their personal details,
given time to consider their Choice, and then called forward individually for the first move by
Nature (which was implemented by the manual drawing of a numbered disk from a bag of 90 such
disks9). Those that passed to the second stage (‘Fase 2’) went to a separate room where they were
given the sheet of paper labelled ‘Fase 2’ (also reproduced at the end of these instructions), asked to
fill in their personal details again and then given time to (re-)consider their choice before being
called forward for the playing out of the second move by Nature, which was again implemented
manually. The decision problem implemented was precisely that of T1 with the following values for
the relevant parameters:
p = 20/90
q = 70/90
x1 = £45000
x2 = £25000
x3 = £0
These parameters were chosen to make the decision problem as close as possible to those used by
Cubitt et al and by Paradiso and Hey, though in this experiment the risky Choice (Up) was slightly
more attractive than in the earlier experiments10. At the second stage, the choice was between the
risky Choice (70 chances out of 90 to get £45000 and 20 chances out of 90 to get £0) and the safe
Choice (£25000 for sure),
Of the 85 subjects in Treatment 1, 20 passed to the second stage; of the 87 subjects in
Treatment 2, 23 passed to the second stage. On Treatment 1, a total of 14 A choices were
implemented and 6 B choices; on Treatment 2, a total of 17 A choices were implemented and 6 B
choices. The resulting moves by Nature led to a total of £1,489,000 being paid out.
The key result can quickly be stated – just one subject changed his or her mind, and this
person in Treatment 1 (the low cost treatment) and the change was from the safe prospect at the first
9
The reason for their being 90 such disks is that there exists an Italian board game, Tombola, which uses gettoni
numbered from 1 to 90.
11
stage to the risky prospect at the second stage. One could conclude that the evidence is not
inconsistent with the null hypothesis that subjects do have a plan and do implement it. However it is
also consistent with the alternative hypothesis that subjects do not (want to) plan but are forced to
do by a cost of changing their Choice that is ‘too high’.
There is, however, an additional finding which remains to be explained. Consider the table
below.
£1000
Treatment
Not passed to
Stage 2
Passed to Stage
2
Totals
A choices
B choices
No choice11
Totals
34
24
7
65
14/15
6/5
0
20
48/4912
30/2913
7
85
£5000
Treatment
Not passed to
Stage 2
Passed to Stage
2
Totals
A choices
B choices
No choice
Totals
42
19
3
64
17
6
0
23
59
25
3
87
It is clear from this that there is a difference between the proportions choosing A (or B) in the two
treatments: 0.6154 (48/78) in Treatment 1 and 0.7024 (59/84) in Treatment 2 (At Stage 2 the
respective proportions are 0.6282 and 0.7024.) The appropriate t-statistic is 1.17, which is not
statistically significant at customary significance levels, largely as a consequence of the small
sample size14. However from an economic point of view this difference could be considered
significant: more people seem to choose the risky option when the cost of changing the Choice is
10
I had been warned that southern Italians were highly risk-averse. Also that they were highly conservative – but on this
see later.
11
The number of subjects who did not express a choice.
12
The first number is the number of A choices at Stage 1, the second number the number of A choices at Stage 2.
13
The first number is the number of B choices at Stage 1, the second number the number of B choices at Stage 2.
12
higher. Does this imply that people are more willing to go for a risky choice when they know they
will be locked into it?
4. Alternative Designs
Other, possibly better, designs were considered. These may be implemented in due course,
though all have their difficulties. One possibility it to use deception, though I am unhappy about
doing so; moreover it is not a technique that one can use more than a limited number of times, and it
also creates problems for future experiments with a subject pool that has direct or indirect
experience of being deceived in the past. This technique would involve an experimental design in
which subjects were told at Stage 1 that they had to commit to a Choice at Stage 2 if they passed to
it. Then, at Stage 2, they would be told that, in fact, they could change their Choice if they so
wished. In this way we could avoid imposing a cost of changing the Choice. However, the
technique would only work as long as the subjects genuinely believed, at Stage 1, that their Choice
made at that point would actually be implemented if they passed to Stage 2. Any feedback from one
cohort of subjects to the next would destroy the effectiveness of this procedure. Moreover, any
doubt in the subjects’ minds about whether or not their Choice would actually be implemented
would also pollute the procedure – effectively creating in the subjects’ mind an uncontrolled
subjective probability that their Choice would be implemented.
There are two elements here: the uncontrolled nature of the probability and the probability
itself. The latter is not really a problem (for reasons I discuss below) but the former is. These
considerations suggest an alternative design: in which there is a controlled objective probability that
the Choice made at Stage 1 will actually be implemented at Stage 2. Again we could probably
dispense with the cost of changing the Choice. So in this design we would tell the subjects, when
making their Choice at Stage 1 that there would be some probability π that this Choice would
actually be implemented if the subject passed to Stage 2. The problem with this is that it inserts an
14
For the female subjects the difference is slightly more pronounced – the t-statistic here is 1.32 – though again not
13
extra move by Nature into the decision tree and hence changes the nature of the decision problem.
Once again the null hypothesis can easily be stated: if subjects do have a plan and they do intend to
implement it, then they will not change their Choice if they are allowed to do so – once again it
being clearly irrational for them to do so. The strategy of choosing and then changing their Choice
if they are allowed to do so is clearly dominated by the strategy of choosing the same Choice and
not changing the Choice, because if they want to change their Choice but are not allowed to do so
they are worse off than if they had expressed their true Choice in the first instance. So, once again,
a straightforward test of either of the two approaches to dynamic decision making discussed above
is that of observing whether any subjects change their Choice.
Again an alternative hypothesis is not so easily stated as it requires an alternative theory of
dynamic decision making – one that at the present we do not have. Once again, a weak alternative is
that some subjects may change their Choice and that the number of such subjects depends on the
probability of being allowed to change the Choice at Stage 2: the lower the probability the smaller
the number of subjects changing. But again there are two effect operating here: the lower the
probability of being allowed to change the Choice the more likely it is that subjects will indicate
their ‘true’ Choice in Stage 1, and the lower the probability the fewer the number of subjects who
will ex post change their Choice.
These two effects operate in this experiment: the cost of changing the Choice may (if the
null hypothesis is not true) affect both the number of subjects choosing A at Stage 1 and the number
of subjects changing the Choice at Stage 2. Again the overall impact is not clear without a clearly
stated alternative hypothesis. If this alternative hypothesis included considerations of the cost
incurred by subjects in processing the decision problem, then it might imply that the higher the cost
of changing the Choice, the more careful the subjects would be at Stage 1, and hence the fewer the
number of subjects changing their Choice at Stage 2. Indeed if one invoked an error-based theory of
decision making (where the magnitude of the error was dependent on the costs of making errors and
significant at customary levels.
14
on the costs of being careful) then one could begin to approach an alternative hypothesis. Such an
alternative would, however, still implicitly assume that subjects planned their strategy – now even
more carefully (taking into account the costs of thinking) than in the theories sketched in section 1.
Some might regard this as a move in the wrong direction.
5. Conclusions
It is difficult to know what conclusions should be drawn from these results of the
experiments reported in this paper. From the point of view of an experimentalist interested in
acquiring new evidence concerning the ‘irrationality’ of subjects, the results might be considered
disappointing. From the point of view of an economic theorist interested in acquiring evidence
concerning the attractiveness of Expected Utility theory as an appropriate (normative and)
descriptive tool, these results are reassuring: subjects do appear to have a plan and they do appear to
implement it. True, we have the slight suggestion that the magnitude of the cost of changing the
Choice might actually influence the Choice itself. This damaging to Expected Utility theory (and
indeed to other theories of rational dynamic decision making) but at this stage the evidence is not
sufficiently strong to cause serious alarm.
Yet at the same time, we are left with unresolved problems concerning the interpretation of
the results from the earlier experiments discussed in this paper. Why do subjects seem to behave
differently if they have to pre-commit (Cubitt et al)? Why do subjects seem to wish to avoid precommitment (Paradiso and Hey)? What this experiment seems to say is that the answers to these
questions do not lie in the fact that subjects do not (want to) plan – they must lie elsewhere.
15
References
Carbone, E. and Hey, J.D. (1999), “A Test of the Principle of Optimality”, EXEC Discussion
Paper.
Cubitt, R.P. (1996), “Rational Dynamic Choice and Expected Utility Theory”, Oxford Economic
Papers, vol. 48, pp. 1-19.
Cubitt, R.P., Starmer, C. and Sugden R. (1998), “Dynamic Choice and the Common Ratio Effect:
An Experimental Investigation”, Economic Journal, vol. 108, pp. 1362-80.
Epstein, L.G. (1980), “Decision Making and the Temporal Resolution of Uncertainty”.
International Economic Review, vol. 21, pp. 269-83.
Hammond, P.J. (1988a), “Consequentialist Foundations for Expected Utility”, Theory and
Decision, vol. 25, pp. 25-78.
Hammond, P.J. (1988b), “Consequentialism and the Independence Axiom”, in B. Munier (ed.),
Risk, Decision and Rationality. Dordrecht: Reidel, 503-16.
Hey J D (1997), "Experiments and the Economics of Individual Decision Making under Risk and
Uncertainty" in Kreps D.M. and Wallis K.F. (eds), Advances in Economics and Econometrics:
Theory and Applications, vol 1, pp 173-205, Cambridge University Press, 1997.
Kreps, D.M. and Porteus, E.L. (1978), “Temporal Resolution of Uncertainty and Dynamic Choice
Theory”, Econometrica, vol. 46, pp.185-200.
Kreps, D.M. and Porteus, E.L. (1979), “Temporal Von Neumann-Morgenstern and Induced
Preferences”, Journal of Economic Theory, vol. 20, pp. 81-109.
Machina, M.J. (1984), “Temporal Risk and the Nature of Induced Preferences”, Journal of
Economic Theory, vol. 33, pp. 199-231.
Machina, M.J. (1989), “Dynamic Consistency and Non-Expected Utility Models of Choice Under
Uncertainty”, Journal of Economic Literature, vol. 27, pp. 1622-68.
McClennen, E.F. (1990). Rationality and Dynamic Choice: Foundational Explorations. Cambridge:
Cambridge University Press.
Paradiso, M. and Hey, J.D. (1999), “Dynamic Choice and Timing Independence: an Experimental
Investigation”, EXEC Discussion Paper.Segal, U. (1990), “Two-Stage Lotteries Without the
Independence Axiom”, Econometrica, vol. 58, pp. 349-77.
Segal, U. (1990), “Two-Stage Lotteries Without the Independence Axiom”, Econometrica, vol. 58,
pp. 349-77.
16
Experimental Instructions Read Aloud to Subjects
Followed by Forms given to Subjects : all received Fase 1 (Stage 1) and those who passed
to Fase 2 (stage 2) were given the Fase 2 form.
Buongiorno. Sono John Hey. I miei colleghi sono Ernesto Somma ed Andrea Morone.
Siamo economisti del Dipartimento di Scienze Economiche presso la Facoltà di Economia
dell’Università di Bari. Stiamo facendo una ricerca sulle scelte individuali. Questa ricerca è
finanziata dalla Commissione Europea per un programma TMR (che vuol dire ‘Training and
Mobility of Researchers’) in cui l’Università di York è uno delle 10 università partecipanti.
Vorremmo che tutti partecipino a questo esperimento. Prima, vorrei spiegare
l’esperimento. Dopo, se non volete partecipare, potete uscire.
L’esperimento durerà circa 30 minuti.
Se partecipate, potete ricevere dei soldi forniti dalla Commissione Europea. La somma
che riceverete dipenderà in parte dalla fortuna ed in parte dalle vostre scelte nel problema che
vi proporremo.
Questi problemi non sono un esame: non ci sono risposte giuste o sbagliate. La sola
risposta giusta è quella che voi decidete di dare. Noi siamo interessati ad osservare le vostre
scelte, e per questo vi pagheremo.
La somma massima che potete ricevere è £45000, ma potreste anche ricevere niente.
Non potete perdere dei soldi a meno che decidiate di perderli.
Se avete già partecipato a questo esperimento, non potete partecipare ancora una volta.
Non ha importanza se voi avete partecipato ad un esperimento diverso organizzato per ESSE
(Economia Sperimentale al Sud d’Europa) in qualche altro luogo. Ma non potete partecipare
due volte a questo esperimento.
Prima di pagarvi, verificheremo i vostri nomi con un elenco delle persone che hanno
già partecipato. Avrete bisogno del vostro libretto dello studente. Se non avete tale libretto,
non potete partecipare.
Se non avete il vostro libretto; se avete già partecipato in questo esperimento; o non
volete partecipare; per favore uscite adesso.
Grazie per la vostra partecipazione a questo esperimento. Prima dell’inizio, vorrei
spiegare le regole dell’esperimento.
Per favore, non parlate fino alla fine dell’esperimento se non per fare domande. Se
volete fare una domanda, alzate la mano Chiunque parli sarà invitato ad uscire dall’Aula.
Non guardate agli altri partecipanti durante l’esperimento.
In fronte a voi c'è un foglio. C’è un foglio per ogni persona. Non sono identici. Non
guardate al foglio degli altri partecipanti, e non mostrate il vostro foglio a nessuno. Per favore,
non fate niente, fino a quando non abbia finito di spiegare che cosa dovete fare.
17
Il foglio ha tre parti. Nella prima parte dovete scrivere i vostri dettagli personali.
Chiediamo il vostro nome, il vostro corso di laurea, il vostro anno di iscrizione, la vostra età,
il vostro sesso, la vostra città o paese, il vostro numero di matricola, e se avete un lavoro o
siete discoccupati. Queste informazioni ci servono per poter effettuare gli eventuali
pagamenti e saranno tenute riservate. I risultati della nostra ricerca che saranno pubblicati non
identificheranno alcun individuo o la sua scelta. Non daremo queste informazioni ad altre
persone.
La terza parte, in fondo al foglio, è una ricevuta. Dovete riempire questa ricevuta
prima di lasciare l’aula dell’esperimento.
La seconda parte, nel centro del foglio, è la descrizione di un problema di scelta che
spiegherò tra poco. Ma prima, per favore, scrivete i dettagli personali nella prima parte del
foglio, e poi leggete il problema di scelta scritto sotto. Non fate o scrivete più niente fino a
quando io vi darò il permesso.
Ogni foglio descrive un problema di scelta in cui il risultato dipende in parte dalla
fortuna ed in parte dalla vostra scelta. La fortuna è determinata nel modo seguente: i miei
colleghi hanno in mano un sacco in cui ci sono 90 gettoni numerati, numerati fra 1 e 90.
Se volete, potete verificare alla fine dell’esperimento che ci sono veramente 90 gettoni
numerati fra 1 e 90 in ogni sacco. Quando è necessario, un assistente prenderà a caso un
gettone dal suo sacco. Il vostro foglio descrive le circostanze in cui questo succederà, ed
anche come il risultato dipende dal numero del gettone preso. Ogni volta che un gettone è
preso dal sacco, quel gettone sarà rimesso a posto nel sacco stesso. Quindi, ogni gettone ha la
stessa possibilità di essere estratto indipendentemente dal fatto che sia stato estratto o meno.
Ci sono due fasi nell'esperimento. Nella fase 1 dovrete scegliere una tra le due opzioni
A e B descritte sul foglio. Questa è la prima decisione che dovrete prendere. Allora, leggete il
vostro foglio con cura e decidere se scegliere l’opzione A o B, nel caso in cui raggiungiate la
Fase 2. Indicate la vostra scelta sul foglio.
Dopo aver scelto, indicate che siete pronti ed aspettate l'istruzione di andare da uno
degli assistenti che estrarrà un gettone dalla borsa. Se il numero estratto è compreso tra 1 e 70
non passerete alla Fase 2 e dovrete abbandonare l’esperimento. In questo caso non riceverete
alcun pagamento, firmerete la ricevuta e lascerete l’aula. Se il numero estratto è compreso tra
71 e 90, passerete alla Fase 2. A questo punto dovrete recarvi presso l’Aula Magna dove un
assistente vi fornirà un altro foglio nel quale sono descritte le due opzioni A e B. All’inizio
della Fase 2 vi chiederemo se intendete confermare la scelta fatta nella Fase 1 o meno. Se
intendete modificare la vostra scelta sosterrete un costo. Dopo avere deciso, indicate che siete
pronti ed aspettare l'istruzione di andare dall'assistente. Se avete scelto l’opzione A
l’assistente estrarrà un gettone dal sacco e la vincita sarà determinata a seconda del numero
estratto come spiegato sul foglio. Se all’inizio della Fase 2 avete cambiato la vostra scelta
dovrete sottrarre la somma del costo di cambiare decisione dalla vincita. Firmerete la ricevuta
e lascerete l’aula. Se avete scelto l’opzione B riceverete la somma indicata (meno il costo di
cambiare decisione che abbiate cambiato la vostra scelta all’inizio della Fase 2). Firmerete la
ricevuta e lascerete l’aula.
Ci sono domande?
18
Vorrei ringraziarvi per la vostra partecipazione a questo esperimento. Ricordatevi che
non potete parlare fino alla fine dell’esperimento, salvo con me o con uno dei miei assistenti.
Se parlerete, dovrete lasciare l’esperimento.
Adesso potete cominciare.
Note: the following forms are for Treatment 1 in which the cost of changing the decision
is £1000; there were other forms for Treatment 2 (in which the cost of changing the
decision was £5000) the only difference being the cost of changing the decisio
19
ESSE
Economia Sperimentale al Sud d’Europa
______________________________________________________________________________
FASE 1
______________________________________________________________________________
COGNOME E NOME:
CORSO DI LAUREA:
ANNO DI ISCRIZIONE:
ETÀ:
CITTA'/PAESE:
SESSO:
HAI LAVORO?/SEI DISOCCUPATO?
NUMERO DI MATRICOLA:
______________________________________________________________________________
In ogni sacco ci sono 90 gettoni numerati, numerati fra 1 e 90. Ogni volta che un gettone è estratto
dal sacco, quel gettone sarà rimesso a posto nello stesso sacco.
Un assistente prenderà a caso un gettone da un sacco. Se il numero sul gettone è compreso tra 1 e
70, non passerai alla Fase 2. Se il numero sul gettone è fra 71 e 90, passerai alla Fase 2, in cui avrai
una scelta fra:
Opzione A:
Un assistente prenderà a caso un gettone da un sacco. Se il numero sul gettone è fra
1 e 20, non riceverai nulla. Se il numero sul gettone è fra 21 e 90, riceverai £45000.
Opzione B:
Riceverai £25000.
DEVI SCEGLIERE ADESSO QUALE TRA LE OPZIONI A E B PREFERISCI SE PASSERAI
ALLA FASE 2.
SE PASSERAI ALLA FASE 2, AVRAI L’OPPORTUNITÀ DI CAMBIARE LA TUA
DECISIONE, MA IL COSTO DI CAMBIARE DECISIONE SARÀ £1000.
PENSA CON CURA ALLA TUA DECISIONE. QUANDO SEI PRONTO, INDICA L’OPZIONE
CHE PREFERISCI. RESTA SEDUTO ED ASPETTA UN'ASSISTENTE.
______________________________________________________________________________
Ricevuta (Se non passi alla Fase 2.)
Ho partecipato volontariamente a questo esperimento e non ho ricevuto alcun pagamento.
Firma............................................................
Data.............................................................
ESSE
Economia Sperimentale al Sud d’Europa
______________________________________________________________________________
FASE 2
___________________________________________________________________________
COGNOME E NOME:
CORSO DI LAUREA:
ANNO DI ISCRIZIONE:
ETÀ:
CITTA'/PAESE:
SESSO:
HAI LAVORO?/SEI DISOCCUPATO?
NUMERO DI MATRICOLA:
______________________________________________________________________________
In ogni sacco ci sono 90 gettoni numerati, numerati fra 1 e 90. Ogni volta che un gettone è estratto
dal sacco, quel gettone sarà rimesso a posto nello stesso sacco.
Scegli tra le opzioni A e B:
Opzione A:
Un assistente prenderà a caso un gettone da un sacco Se il numero sul gettone è fra 1
e 20, non riceverai nulla. Se il numero sul gettone è fra 21 e 90, riceverai £45000.
Opzione B:
Riceverai £25000.
PENSA CON CURA ALLA TUA DECISIONE.
SE LA TUA DECISIONE IN QUESTA FASE E’ DIVERSA RISPETTO ALLA TUA
DECISIONE NELLA FASE 1, UN COSTO DI £1000 SARÀ DEDOTTO ALLA VINCITA. SE
QUESTA VINCITA È £0, QUINDI TU DEVI PAGARE A NOI £1000.
QUANDO SEI PRONTO, INDICA LA TUA DECISIONE E ASPETTA L'ASSISTENTE.
L’ASSISTENTE PROCEDERA’ ALL’ESTRAZIONE DEL NUMERO E/O AL PAGAMENTO.
______________________________________________________________________________
Ricevuta (Deve essere compilato prima di lasciare l’aula.)
Ho partecipato volontariamente a questo esperimento.
Ho ricevuto £45000/ £44000/ £25000/ £24000/ £0 // Ho pagato £1000.
Firma..........................................................
2
Data................................................................
Appendix table
Numbers of those who answered A on first stage
£1000 treatment
£5000 treatment
male
29
32
female
19
27
total
48
59
Both treatments
61
51
107
Numbers of those who answered B on first stage
£1000 treatment
£5000 treatment
male
11
9
female
19
16
total
30
25
Both treatments
20
28
55
Proportions of those who answered A on first stage
£1000 treatment
£5000 treatment
male
0.7250
0.7805
female
0.5000
0.6279
total
0.6154
0.7024
Both treatments
0.7531
0.6456
0.6605
Proportions of those who answered B on first stage
male
female
total
£1000 treatment 0.2750
0.5000
0.3846
£5000 treatment 0.2195
0.3721
0.2976
Both treatments
3
0.2469
0.3544
0.3395
© Copyright 2026 Paperzz