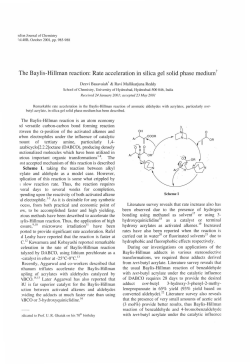
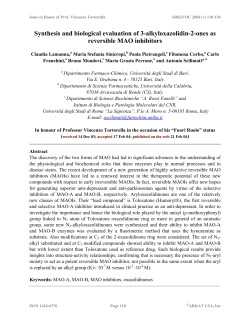
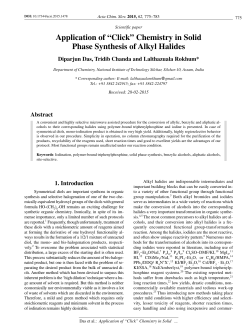
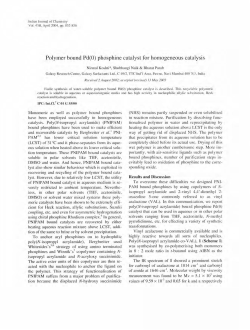
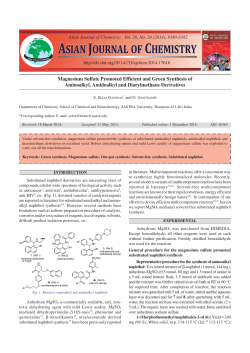
Supporting Information for: Conversion of Fe-NH2 to Fe-N2 with release of NH3 John S. Anderson, Marc-Etienne Moret, and Jonas C. Peters Figure 1. 1H NMR Spectrum of (TPB)FeMe (1) Figure 2. 1H NMR Spectrum of [(TPB)Fe][BArF4] (2) Figure 3. 1H NMR Spectrum of [(TPB)Fe(N2H4)][BArF4] (3) Figure 4. 1H NMR Spectrum of [(TPB)Fe(NH3)][BArF4] (4) Figure 5. 1H NMR Spectrum of (TPB)FeNH2 (5) Figure 6. 1H NMR Spectrum of (TPB)FeOH (6) Figure 7. 10 K EPR Spectrum of (TPB)FeMe (1) Figure 8. 10 K EPR Spectrum of [(TPB)Fe][BArF4] (2) Figure 9. 10 K EPR Spectrum of [(TPB)Fe(N2H4)][BArF4] (3) Figure 10. 10 K EPR Spectrum of [(TPB)Fe(NH3)][BArF4] (4) Figure 11. 10 K EPR Spectrum of (TPB)FeNH2 (5) Figure 12. 10 K EPR Spectrum of (TPB)FeOH (6) Figure 13. UV-Vis Spectrum of (TPB)FeMe (1) Figure 14. UV-Vis Spectrum of [(TPB)Fe][BArF4] (2) Figure 15. UV-Vis Spectrum of [(TPB)Fe(N2H4)][BArF4] (3) Figure 16. UV-Vis Spectrum of [(TPB)Fe(NH3)][BArF4] (4) Figure 17. UV-Vis Spectrum of (TPB)FeNH2 (5) Figure 18. UV-Vis Spectrum of (TPB)FeOH (6) Figure 19. Titration of THF into an ethereal solution of 2 Figure 20. NMR traces of the monitored decomposition of 3 to 4 Figure 21. Kinetic plots of the monitored decomposition of 3 to 4 S1 Figure 22. Geometries of [(TPB)Fe]+ and [(Me2PhP)3Fe]+ optimized at the B3LYP/6-31G(d) level Figure 23. MO and spin density diagram of [(TPB)Fe]+ optimized at the B3LYP/6-31G(d) level Figure 24. MO diagram offering a tentative explanation for the T-shaped distortion of 2 Figure 25. Variable Temperature Magnetic data for 2-5 Table 1. Product quantification for the decomposition of 3 to 4 Table 2. Crystal data and structure refinement for (TPB)FeMe (1) Table 3. Crystal data and structure refinement for [(TPB)Fe][BArF4] (2) Table 4. Crystal data and structure refinement for [(TPB)Fe(N2H4)][BArF4] (3) Table 5. Crystal data and structure refinement for [(TPB)Fe(NH3)][BArF4] (4) Table 6. Crystal data and structure refinement for (TPB)FeNH2 (5) Table 7. Crystal data and structure refinement for (TPB)FeOH (6) Figure 26. Crystal Structure for (TPB)FeOH (6) S2 General Considerations Unless otherwise noted, all compounds were prepared by literature procedures or purchased from commercial sources. All manipulations were carried out under a dinitrogen atmosphere by utilizing standard glovebox or schlenk techniques. Solvents were dried and deoxygenated by an argon sparge followed by passage through an activated alumina column purchased from S.G. Waters Company. All non-halogenated solvents were tested with a standard sodium-benzophenone ketyl solution to ensure the absence of oxygen and water. NMR NMR measurements were obtained on Varian 300, 400, or 500 MHz spectrometers. Deuterated solvents for these measurements were obtained from Cambridge Isotope Laboratories and were dried and degassed prior to use. All 1H spectra were referenced to residual solvent peaks and all 31P spectra were referenced to an external H3PO4 standard. EPR EPR X-band spectra were obtained on a Bruker EMX spectrometer with the aid of Bruker Win-EPR software suite version 3.0. The spectrometer was equipped with a rectangular cavity which operated in the TE102 mode. Temperature control was achieved with the use of an Oxford continuous-flow helium cryostat (temperature range 3.6 – 300 K). All spectra were recorded at 9.37 GHz with a microwave power of 20 mW, a modulation amplitude of 4 G, and a modulation frequency of 100 kHz. X-Ray Crystallography Data was obtained at low temperatures on a Siemens or Bruker Platform three-circle diffractometer coupled to a Bruker-AXS Smart Apex CCD detector with graphitemonochromated Mo Kα radiation (λ = 0.71073), performing φ-and ω-scans. Data for complex 4 was collected on with synchrotron radiation at the Stanford Synchrotron Radiation Laboratory (SSRL) beam line 12-2 at 17 keV using a single phi axis and recorded on a Dectris Pilatus 6M. The images were processed using XDS1 and further workup of the data was analogous to the other datasets. All structures were solved by standard direct or Patterson methods and refined against F2 using the SHELX program package.2,3,4 All atoms, with the exception of hydrogens, have been anisotropically refined. The hydrogen atoms bonded to atoms of interest, namely N or O, have been located in the difference map and refined semi-freely. All other hydrogen atoms were included via a standard riding model. In the structure of complex 1 a minor component of (TPB)FeCl was found in the difference map and modeled as disorder. Additional disorder of the BArF4 counterion was found in complex 4. This disorder was modeled as a rotational disorder of the CF3 groups on one of the phenyl rings, but some of the resulting F ellipsoids still display significantly prolate shapes. We 1 W. Kabsch, J. Appl. Cryst. 1993, 26, 795. Sheldrick, G. G. M. M. Acta Acta Cryst. Cryst. 1990, 1990, A46, A46, 467. 467. Sheldrick, 3 Sheldrick, G. M. Acta Cryst. 2004, A64, 112. 4 Müller, P. Crystallography Reviews 2009, 15, 57. 2 2 S3 feel that the shape of these ellipsoids accurately describes the actual electron density due to the rotational disorder. Magnetic Measurements. Data was obtained using a Quantum Designs SQUID magnetometer running MPMSR2 software (Magnetic Property Measurement System Revision 2) at a field strength of 50000 G. Complexes were massed and then suspended in eicosane wax. Samples were then inserted into the magnetometer in plastic straws sealed under nitrogen with gelatin capsules. Loaded samples were centered within the magnetometer using the DC centering scan at 35 K. Data were acquired at 20-30 K (one data point every 2 K), and 30-300 K (one data point every 10 K). The magnetic susceptibility was adjusted for diamagnetic contributions using the constitutive corrections of Pascal's constants as well as a diamagnetic correction for the eicosane and capsule. Data workup, including simulations, was performed in the JulX software package.5 Complex 5 displayed a lower than expected magnetic moment. NMR analysis of the sample indicated the presence of ~15% 12-crown-4, present as a result of the protocol for generation of the complex, where it is used to aid for removal of NaBArF4. Accounting for this impurity leads to a magnetic moment consistent with the other samples. Computational Methods Geometry optimizations were performed using the Gaussian03 package.6 The B3LYP exchange-correlation functional was employed with a 6-31G(d) basis set. The GDIIS algorithm was used. A full frequency calculation was performed on each structure to establish true minima. A model for the initial geometry of complex 2 used the crystallographically determined coordinates as a starting point for subsequent minimization. Atoms were then stripped away from this structure to reveal a Fe(PMe2Ph)3+ as the starting point to determine the theoretical structure of Fe(PMe2Ph)3+ by another minimization. Structural models and orbital/spin density pictures were generated from Gaussview 03. 5 http://ewww.mpi-muelheim.mpg.de/bac/logins/bill/julX_en.php Gaussian 03, Revision E.01, M. J. Frisch, G. W. Trucks, H. B. Schlegel, G. E. Scuseria, M. A. Robb, J. R. Cheeseman, J. A. Montgomery, Jr., T. Vreven, K. N. Kudin, J. C. Burant, J. M. Millam, S. S. Iyengar, J. Tomasi, V. Barone, B. Mennucci, M. Cossi, G. Scalmani, N. Rega, G. A. Petersson, H. Nakatsuji, M. Hada, M. Ehara, K. Toyota, R. Fukuda, J. Hasegawa, M. Ishida, T. Nakajima, Y. Honda, O. Kitao, H. Nakai, M. Klene, X. Li, J. E. Knox, H. P. Hratchian, J. B. Cross, V. Bakken, C. Adamo, J. Jaramillo, R. Gomperts, R. E. Stratmann, O. Yazyev, A. J. Austin, R. Cammi, C. Pomelli, J. W. Ochterski, P. Y. Ayala, K. Morokuma, G. A. Voth, P. Salvador, J. J. Dannenberg, V. G. Zakrzewski, S. Dapprich, A. D. Daniels, M. C. Strain, O. Farkas, D. K. Malick, A. D. Rabuck, K. Raghavachari, J. B. Foresman, J. V. Ortiz, Q. Cui, A. G. Baboul, S. Clifford, J. Cioslowski, B. B. Stefanov, G. Liu, A. Liashenko, P. Piskorz, I. Komaromi, R. L. Martin, D. J. Fox, T. Keith, M. A. Al-Laham, C. Y. Peng, A. Nanayakkara, M. Challacombe, P. M. W. Gill, B. Johnson, W. Chen, M. W. Wong, C. Gonzalez, and J. A. Pople, Gaussian, Inc., Wallingford CT, 2004. 6 S4 Synthesis of (TPB)FeMe , 1 (TPB)FeBr (0.400 g, 0.55 mmol) was dissolved in 15 mL of ether and cooled to -35° C. To this stirred solution was added a 1.6 M solution of MeLi in ether (0.620 mL, 0.99 mmol). After addition the solution was allowed to warm to room temperature and was stirred for an additional hour over which time the solution changed in color from a dark brown to a deep orange red. After this time, volatiles were removed and the remaining solids were extracted with 3 mL of benzene three times. Lyophilization of benzene resulted in a dark orange powder which was washed with 5 mL of cold pentane to yield (TPB)FeMe (0.352 g, 97%). X-ray quality crystals were grown from slow evaporation of a concentrated pentane solution of 1. 1H NMR (C6D6, δ): 74.48 (br s), 33.25 (s), 22.52 (s), 9.31 (br s), 5.73 (s), 2.65 (s), -2.33 (br s), -2.80 (s), 7.49 (br s), -16.33 (s). UV-Vis (THF) λmax, nm (ε, M-1 cm-1): 840 (120). Anal. Calc. for C37H57BFeP3: C 67.19; H 8.69. Found: C 67.26; H 8.59. Solution magnetic moment (C6D6): 3.9 µB . Synthesis of [(TPB)Fe][BArF4] 2 A dark orange solution of 1 (0.037 g, 0.06 mmol) in 5 mL of Et2O was cooled to -35° C. Once cooled, the solution was stirred while a similarly cooled solution of HBArF4·2 Et2O7 in 5 mL of Et2O was added dropwise over 5 min. After the addition, the solution was stirred at room temperature for an additional hour before being concentrated down to 1 mL. This solution was layered with 1 mL of pentane and cooled to -35° C for 2 days upon which time dark orange crystals of [(TPB)Fe][BArF4] had formed (0.082 g, 97%). 1H NMR (C6D6/THF-d8, δ): 32.15 (br s), 25.78 (s), 23.99 (br s), 8.93 (br s), 8.27 (s, BArF4), 4.55 (br s), 1.84 (br s), -1.24 (br s), -28.05 (s). UV-Vis (Et2O) λmax, nm (ε, M-1 cm-1): 475 (1700), 765 (800). Anal. Calc. for C68H66B2F24FeP3: C 54.10; H 4.41. Found: C 53.93; H 4.53. Synthesis of [(TPB)Fe(N2H4)][BArF4], 3 2 (0.356 g, 0.24 mmol) was dissolved in 10 mL in Et2O and stirred. To this was added N2H4 (0.076 mL, 2.36 mmol) in one portion. Upon addition, the solution lightened slightly in color to a brown-orange. The solution was allowed to stir for 15 min before the solution was concentrated to 5 mL and layered with 5 mL of pentane. After 2 days at -35° C, dark orange crystals of [(TPB)Fe(N2H4)][BArF4] had formed (0.324 g, 89%). 1H NMR (C6D6/THF- d8, δ): 53.72 (br s), 28.26 (s), 25.32 (s), 20.18 (br s), 8.28 (s, BArF4) 7.67 (s, BArF4), 8.14 (br s), 7.96 (br s), 3.00 (br s), 2.67 (br s), 0.30 (br s), -26.06 (s). UV-Vis (THF) λmax, nm (ε, M-1 cm-1): 800 (140). Anal. Calc. for C68H70B2F24FeN2P3: C 52.98; H 4.58; N 1.82. Found: C 53.03; H 4.63; N 1.70. Solution magnetic moment (THF-d8): 3.46 µB. Synthesis of [(TPB)Fe(NH3)][BArF4], 4 7 Brookhart, M.; Grant, B.; Volpe, A. F. Organometallics 1992, 11, 3920-3922. S5 A solution of 3 (0.308 g, 0.20 mmol) in 10 mL of 1:6 THF:Benzene was rapidly stirred at RT for 12 h. After this time, the volatiles were removed in vacuo and the residue was taken up in Et2O, filtered, and layered with pentane before being cooled to -35°. After 2 days, dark orange-red crystals of [(TPB)Fe(NH3)][BArF4] had formed (0.264 g, 87%). 1H NMR (C6D6/THF-d8, δ): 68.22 (br s), 28.55 (s), 24.28 (s), 17.81 (br s), 8.34 (s, BArF4), 7.68 (s, BArF4), 5.74 (br s), 3.53 (s), 2.15 (br s), 1.22 (br s), -25.48 (s). UV-Vis (THF) λmax, nm (ε, M-1 cm-1): 871 (50). IR (KBr, cm-1): 3381 (ν[NH]) Anal. Calc. for C68H69B2F24FeNP3: C 54.24; H 4.55; N 0.92. Found: C 53.47; H 4.72; N 0.94. Solution magnetic moment (THF- d8): 3.63 µB. Synthesis of (TPB)FeNH2, 5 A solution of 2 (0.300 g, 0.20 mmol) in 5 mL of Et2O was stirred over powdered NaNH2 (0.077 g, 1.99 mmol) for 1.5 h at room temperature. Over this time, the solution darkened from orange to a dark brown. Volatiles were removed and the remaining residue was extracted with 40 mL of pentane to yield a pale orange solution. To this solution was added 12crown-4 (0.070 g, 0.40 mmol) to aid in the removal of NaBArF4, and solids began to precipitate. The solution was allowed to stand for 1 h before filtration. Removal of solvent for 3 h at 70° C resulted in (TPB)FeNH2 as a dark orange powder (0.060 g, 0.09 mmol, 46%). Crystals suitable for X-ray diffraction were grown from slow evaporation of a concentrated ethereal solution. Due to the presence of a small amount of 12-crown-4 that had similar solubility properties to the product, satisfactory combustion analysis was not obtained for 5. 1H NMR (C6D6, δ): 91.12 (br s), 38.21 (s), 25.42 (s), 4.12 (br s), 1.55 (br s), 0.21 (br s), -3.04 (br s), -5.93 (br s), -20.19(s). UV-Vis (THF) λmax, nm (ε, M-1 cm-1): 700 (90), 930 (80). Solution magnetic moment (C6D6): 4.05 µB. We also wish to note that trace amounts (<3%) of the neutral complex (TPB)Fe(N2) are typically detected by NMR spectroscopy in preparations of 5. (TPB)Fe(N2) and 5 also have similar solubility properties. Synthesis of (TPB)FeOH, 6 2 (0.80 g, 0.05 mmol) was dissolved in 5 mL of Et2O and stirred over NaOH (0.063 g, 1.6 mmol) at room temperature for 2 h during which the color of the solution darkened to a deep brown. Volatiles were removed from the solution and the resulting solids were extracted with pentane to yield Synthesis of (TPB)FeOH (0.027, 77%) as a brown powder. Crystals suitable for X-Ray diffraction were grown by a slow evaporation of a concentrated Et2O solution. 1H NMR (C6D6, δ): 89.55 (br s), 39.07 (s), 24.70 (s), 6.71 (s), 4.08 (s), 1.55 (br s), -0.52 (br s), -6.00 (br s), -21.02 (s). UV-Vis (THF) λmax, nm (ε, M-1 cm-1): 870 (230), 700 (218). Anal. Calc. for C36H55BFeOP3: C 65.18; H 8.36; N 0. Found: C 65.15; H 8.28; N none found. Solution magnetic moment (C6D6): 4.12 µB. Protonation of 5 A 20 mL scintillation vial was charged with 5 (0.005 g, 0.007 mmol) and HBArF4·2Et2O (0.008 g, 0.007 mmol) and cooled to -35° C. 2 mL of similarly cooled Et2O was added to the S6 mixture and the color of the solution lightened rapidly. The solution was allowed to warm to room temperature over 30 minutes before volatiles were removed to yield 4 (0.010 g, 0.006 mmol, 91%). The identity of the product was determined via 1H NMR which was identical to that observed for 4. Reduction of 4 A 20 mL scintillation vial was charged with 4 (0.025 g, 0.016 mmol) and KC8 (0.0024 g, 0.018 mmol). 2 mL of Et2O were added and the resulting dark suspension was allowed to stir for 2 h at RT. After this time, the solution was filtered and volatiles were removed to yield (TPB)Fe(N2) as a brown solid. The identity of the product was determined via 1H NMR which was identical to the previously reported values for (TPB)Fe(N2). Monitored Conversion of 3 to 4 3 (0.020 g, 0.013 mmol) was dissolved in a 6:1 mixture of C6D6:THF-d8. The resulting solution was transferred to an NMR tube equipped with a capillary containing a solution of (TPB)FeBr in a 6:1 mixture of C6D6:THF-d8 as an internal standard. This NMR tube was sealed with a J-Young valve and was placed into a 500 MHz spectrometer which had been preheated to 60° C. The reaction was monitored via single scans every minute for 4 hours during which time complete and clean conversion from 3 to 4 was observed. After the reaction was complete, an aliquot of the headspace was analyzed by GC for the presence of H2. After this, volatiles were vacuum transferred onto a solution of HCl in THF. After this, volatiles were removed and the resulting solids were diluted with water to appropriate volumes to test for the presence of NH3 via the indophenol test,8 or N2H4 with p-dimethylaminobenzaldehyde.9 The relative amounts of products are compiled in Table 1 of this document. 8 9 Weatherburn, M.W. Anal. Chem. 1967, 39, 971-974. Watt, G. W.; Chrisp, J. D. Anal. Chem. 1952, 24, 2006-2008. S7 Figure 1. 1H NMR Spectrum of (TPB)FeMe in C6D6 (1) Figure 2. 1H NMR Spectrum of [(TPB)Fe][BArF4] in a 6:1 mixture of C6D6:THF-d8 (2) S8 Figure 3. 1H NMR Spectrum of [(TPB)Fe(N2H4)][BArF4] in a 6:1 mixture of C6D6:THF-d8 (3) Figure 4. 1H NMR Spectrum of [(TPB)Fe(NH3)][BArF4] in a 6:1 mixture of C6D6:THF-d8 (4) S9 Figure 5. 1H NMR Spectrum of (TPB)FeNH2 in C6D6 (5) Figure 6. 1H NMR Spectrum of (TPB)FeOH in C6D6 (6) S10 Figure 7. 8 K EPR Spectrum of (TPB)FeMe in Toluene (1) 0 1000 2000 3000 4000 5000 6000 Field Strength (gauss) Figure 8. 10 K EPR Spectrum of [(TPB)Fe][BArF4] in 2:1 Toluene:Et2O (2) 0 1000 2000 3000 4000 Field Strength (gaus) S11 5000 6000 Figure 9. 10 K EPR Spectrum of [(TPB)Fe(N2H4)][BArF4] in 2-MeTHF (3) 0 1000 2000 3000 4000 Field Strength (gauss) Figure 10. 10 K EPR Spectrum of [(TPB)Fe(NH3)][BArF4] in 2-MeTHF (4) 0 1000 2000 3000 Field Strength (gauss) S12 4000 Figure 11. 10 K EPR Spectrum of (TPB)FeNH2 in 2-MeTHF (5) 0 1000 2000 3000 4000 5000 6000 7000 8000 Field Strength (gauss) Figure 12. 10 K EPR Spectrum of (TPB)FeOH in Toluene (6) 0 1000 2000 3000 4000 Field Strength (gauss) S13 5000 6000 Figure 13. UV-Vis Spectrum of (TPB)FeMe in THF (1) 2000 1800 ε (M-1 cm-1) 1600 1400 1200 1000 800 600 400 200 0 450 550 650 750 850 950 λ (nm) Figure 14. UV-Vis Spectrum of [(TPB)Fe][BArF4] in Et2O (2) 10000 9000 ε (M-1 cm-1) 8000 7000 6000 5000 4000 3000 2000 1000 0 300 400 500 600 700 λ (nm) S14 800 900 1000 Figure 15. UV-vis Spectrum of [(TPB)Fe(N2H4)][BArF4] in THF (3) 2000 1800 ε (M-1 cm-1) 1600 1400 1200 1000 800 600 400 200 0 400 500 600 700 800 900 1000 900 1000 λ (nm) Figure 16. UV-vis Spectrum of [(TPB)Fe(NH3)][BArF4] in THF (4) 2000 1800 ε (M-1 cm-1) 1600 1400 1200 1000 800 600 400 200 0 400 500 600 700 λ (nm) S15 800 Figure 17. UV-vis Spectrum of (TPB)FeNH2 in THF (5) 1000 900 ε (M-1 cm-1) 800 700 600 500 400 300 200 100 0 400 500 600 700 800 900 1000 800 900 1000 λ (nm) Figure 18. UV-Vis Spectrum of (TPB)FeOH in THF (6) 1000 900 ε (M-1 cm-1) 800 700 600 500 400 300 200 100 0 400 500 600 700 λ (nm) S16 Figure 19. Titration of THF into a 4 mL ethereal solution of 2 1 0.9 0.0 mL added THF Absorbance 0.8 0.1 mL added THF 0.7 0.2 mL added THF 0.6 0.3 mL added THF 0.5 0.4 0.3 0.2 0.1 0 375 475 575 675 λ (nm) 775 875 975 Figure 20. NMR traces of the monitored decomposition of 3 to 4 Integral Standard of (TPB)FeBr [(TPB)Fe(NH3)] [BArF244] [(TPB)Fe(N2H4)] [BArF244] Conditions: 0.037 M, C6D6/THF-‐d8, 60 °C, Total time = 4h. Only 2nd hour is shown. S17 Figure 21. Kinetic plots of the monitored decomposition of 3 to 4 [(TPB)Fe(N2H4)] [BArF244] 40 60 80 100 120 140 160 180 200 220 240 [(TPB)Fe(NH3)] [BArF244] 260 40 60 80 t (minutes) 100 120 140 160 180 200 220 240 260 t (minutes) 1 1H NMR Kinetic traces obtained fromfrom H NMR integration. The red guides the eye. Kinetic traces obtained integration. Thelines red may linesserve may as serve as to guides to the No eye.appreciably Note thatreaction no reaction was over observed during the first occurred the first 60 minutes of 60 theminutes reaction.of the reaction and this data is not shown. Figure 22. Geometries of [(TPB)Fe]+ and [(Me2PhP)3Fe]+ optimized at the B3LYP/6-31G(d) level P3 P3 Fe P1 Fe P2 P1 P2 B S18 Selected bond distances [Å] and angles [°]: [(TPB)Fe]+: Fe–P1 2.426, Fe–P2 2.481, Fe–P3 2.460, Fe–B 2.189, P1–Fe–P2 137.5, P1–Fe–P3 109.1, P2–Fe–P3 113.2; [(Me2PhP)3Fe]+: Fe–P1 2.359, Fe–P2 2.328, Fe–P3 2.350, P1–Fe–P2 134.8, P1–Fe–P3 113.1, P2–Fe–P3 111.7. S19 Optimized coordinates [Å] for [(TPB)Fe]+: Fe P P P C C H H H C C H H H C C C H C C H C H C H C H C H C H B C H H H C H C H C H C H C 0.00415000 -2.16349100 2.39121900 -0.31345400 2.09021700 4.02952400 3.98567100 3.19104000 4.95767100 -2.51735800 -2.75787900 -2.24972100 -2.90111300 -3.74621500 0.96713000 0.68267900 -3.77585900 -4.53614800 -1.50541500 -1.85207300 -1.11562400 0.63534800 0.57728600 1.88147700 2.40769300 0.69310600 -0.16599700 4.03129200 4.06604600 1.38189800 1.54195100 0.03447200 5.27977700 6.17024200 5.38965200 5.28761200 1.72157800 2.12008100 1.05459100 0.95646000 2.77223500 3.66239200 -4.07155000 -5.04800100 -3.10700900 -0.16241600 -1.24719000 -0.83777200 2.27645200 -1.73435800 1.02631900 0.45071500 1.72365500 1.60939200 -0.85749000 2.84164700 3.20855200 1.76680700 3.31410800 -1.34366200 1.41376900 -1.11913600 -1.64204200 -0.21277600 0.20954700 0.74145000 3.23145700 4.28918000 2.83955400 2.94283300 -2.13340400 -1.88793000 0.10104900 0.72216800 1.59489600 0.73989400 -0.03107800 -0.79677000 -0.16055800 -1.41148800 -1.45308000 3.94568000 4.91463800 3.79624400 4.65573100 -2.14130600 -2.68641700 -0.72325700 -0.93619400 -0.04189100 -0.77675900 -0.66738800 -0.74771500 -0.74537300 0.82972400 0.64266200 1.57275400 0.64140500 0.65520800 1.09566800 0.59302900 1.49066600 0.71127400 0.55282800 1.61726000 1.69824000 1.66212900 1.09100300 1.85301900 3.15263700 3.74897600 -2.06275600 -1.78194000 3.29296500 4.23815900 2.75608400 3.37259400 -0.58072200 -1.48419000 2.90786900 3.56048800 1.40854000 -0.55921200 -0.49330400 -1.45674600 0.31716600 2.45737900 2.74408600 1.24157800 0.58420600 -2.05044100 -1.71685100 2.96514500 3.39051300 3.70690700 S20 H C H C H C H H H C H C H H H C H C H C H H H C C H H H C H H H C H C H H H C H H C H H H C -3.32936500 2.87573600 3.71142600 -1.96911100 -2.51737400 1.62859900 0.71343900 1.40294400 1.89809900 1.49436100 1.25256900 2.11687300 2.24202800 2.62947700 2.61717700 -2.49731300 -3.54555800 2.59216700 3.21486600 -1.61976400 -1.85554000 -1.78498100 -0.55428900 0.53094900 -1.86943800 -2.87736400 -1.42999600 -1.29175300 -2.95949200 -2.81329100 -2.00927500 -3.68632300 -3.47778300 -3.55367100 -2.34128800 -1.32591600 -3.03896300 -2.53763200 -0.04759800 -1.09647000 -0.00706500 3.08823800 3.31866300 3.94741000 2.22923900 -4.87834200 0.29181200 -2.83838200 -3.14386600 3.20280400 2.81757600 -3.14880400 -2.65749200 -3.66587600 -3.90564800 -3.21131000 -3.77768600 2.84858500 1.80944900 2.97816400 3.48566700 -3.09116600 -3.21968300 -3.56984800 -4.41610400 -3.87498400 -4.94310500 -3.56065100 -3.75363600 2.55057600 4.73224900 5.16043800 5.06125000 5.16729800 -0.11225400 -1.04459900 0.43395300 0.48853300 -0.36144900 0.61070400 -3.61958100 -3.46834000 -3.15266000 -4.69785800 3.05060900 3.36299400 2.00371300 -1.45897600 -2.21769600 -0.78399700 -0.88166100 -0.99390800 4.71691400 1.19803000 0.57548300 -0.67407900 -1.54509900 -2.20719100 -2.56047300 -1.27050000 -2.95299300 3.13086000 4.02619200 -2.14500700 -2.46700100 -1.18858400 -2.88385400 -0.81402900 -0.51323400 2.34988300 2.62556400 0.17378600 0.10319500 1.20749500 -0.04648600 0.86165400 -0.80367000 -0.75057800 -1.74899100 0.01900400 -3.13193300 -3.68700100 -3.13573300 -3.69112200 -1.70257400 -1.20046300 -2.24860700 -2.62965700 -2.94927700 -2.26329900 -3.43027100 -3.42897900 -3.75748600 -3.39314100 -4.14966000 -3.33422400 -3.75845100 -1.73157800 S21 H H H H -5.54599600 -4.87513300 -5.32164500 0.47189800 -0.36236200 -1.98675200 -1.07767600 3.64859800 -2.32962300 -2.19255400 -0.73669900 -4.18772700 Optimized coordinates [Å] for [(Me2PhP)3Fe]+: Fe P P P C C C C C H C C H C H C H C H C H C H C H C H C H C H C H C 0.15864700 -0.96396300 -0.45971000 2.48332300 -2.26951200 -1.24228800 -2.79182200 4.03948300 -0.64552100 -0.02266300 -2.04536400 -2.25786700 -2.89062600 3.22714900 4.32141000 4.38348500 4.81234400 -4.17301300 -4.56274900 0.31804700 1.38960600 4.58567000 5.17639900 3.63159400 3.47437400 3.08377800 2.50486800 -0.21389600 -0.63896300 -0.85737200 -0.39598100 -1.66358000 -1.83040700 -3.16079100 -0.18495700 1.83613500 -2.22271000 -0.04211700 -2.22907300 2.66879600 -2.06800000 -1.45884400 3.89539800 4.41711100 2.02460300 2.60533100 2.10308200 -1.29680000 -1.26188800 -0.67980900 -0.82007700 -2.01522100 -1.90088900 -2.68760000 -2.83560300 -1.63819900 -2.52519600 0.46273300 1.21562800 0.64390800 1.54243900 -3.73662900 -4.62100300 4.47065600 5.42490200 3.82933600 4.28140300 -2.32427200 -0.99760500 -1.46879900 -0.05600500 -1.31271800 0.27519800 0.14383800 1.56749900 0.61288100 0.47185600 -0.24807900 1.10222300 2.35188400 3.07801800 -2.44619800 -2.43248400 2.87994900 3.86773800 1.77110700 2.77861400 1.54990900 1.38660000 1.88602900 2.09670500 2.59776700 3.36480600 1.32807100 1.12392600 -1.09026300 -0.60524200 1.72657200 1.96403800 2.66729400 3.64050500 -0.80796000 S22 H C H C H C H C H C C H H H H H H H H H H H H H H H H -2.78261000 3.28247400 2.90698900 -5.04871600 -6.12191000 -2.66656800 -3.18590300 -4.53907500 -5.21468500 3.28537900 -0.23933400 0.77356200 2.88637400 2.89836600 3.02794700 4.37260400 0.85730500 -0.68525200 -0.11632500 0.20638200 -0.85392700 -0.18044400 -3.25191000 -2.59769400 -2.51936000 4.21949800 -2.13022700 -2.44971700 1.51522500 1.75077900 -2.11906600 -2.08279500 1.64342000 2.60610400 -2.27482500 -2.36443900 -0.31297600 3.11974200 3.37847300 -1.08677000 -2.30593900 2.34344400 1.42000600 -3.89883800 -3.61298900 -3.60480000 -1.87762100 4.02578200 2.70383300 0.95080000 1.23085800 1.07248800 -2.21267100 -1.99363600 -1.82004800 -1.91488900 -2.91604500 0.69010800 0.85179800 -2.16885400 -2.21168900 -0.60131300 -1.44718900 0.31747500 -2.57722600 -2.25945300 -3.46523900 -2.18218500 -1.24739500 -1.95477900 -1.24746400 -2.06920800 1.96078100 2.27591300 -2.60403500 -3.58796700 -1.55774000 -3.18107000 0.87329200 -0.14752200 2.42490400 Mulliken atomic spin densities for 2 1 Fe 3.253912 2 P -0.027171 3 P -0.010617 4 P -0.015937 5 C -0.004907 6 C 0.000171 7 H 0.000020 S23 8 H 0.000301 9 H 0.000144 10 C -0.002614 11 C 0.000097 12 H -0.000011 13 H 0.000408 14 H -0.000066 15 C 0.031834 16 C 0.029533 17 C 0.003234 18 H -0.000001 19 C 0.031179 20 C -0.010984 21 H 0.000534 22 C 0.001306 23 H 0.000886 24 C 0.002732 25 H -0.000716 26 C -0.010913 27 H 0.000375 28 C -0.001689 29 H 0.000232 30 C -0.010241 31 H 0.000537 32 B -0.267025 33 C -0.000540 34 H -0.000389 S24 35 H 0.000017 36 H 0.000034 37 C -0.004817 38 H 0.000268 39 C 0.002585 40 H 0.000043 41 C 0.007248 42 H -0.000019 43 C -0.006843 44 H 0.000321 45 C 0.003235 46 H -0.000697 47 C 0.005544 48 H -0.000087 49 C -0.001772 50 H 0.000308 51 C 0.002233 52 H -0.001672 53 H -0.000551 54 H 0.000270 55 C 0.006515 56 H -0.000827 57 C -0.000211 58 H 0.000126 59 H 0.000133 60 H -0.000055 61 C 0.009143 S25 62 H 0.000978 63 C -0.007547 64 H 0.000405 65 C -0.000028 66 H 0.000024 67 H -0.000020 68 H -0.001178 69 C -0.002002 70 C 0.000981 71 H 0.000333 72 H -0.000026 73 H -0.000056 74 C 0.001914 75 H -0.000172 76 H -0.000830 77 H 0.000312 78 C -0.004719 79 H 0.000585 80 C -0.000384 81 H -0.000422 82 H -0.000009 83 H -0.000029 84 C 0.000389 85 H -0.000118 86 H -0.000747 87 C -0.000078 88 H 0.000160 S26 89 H 0.000030 90 H -0.000011 91 C -0.001228 92 H -0.000593 93 H 0.000076 94 H 0.000043 95 H -0.000115 Sum of Mulliken spin densities = 3.00000 S27 Figure 23. MO and spin density diagram of [(TPB)Fe]+ 2 optimized at the B3LYP/6-31G(d) level S28 Figure 24. MO diagram offering a tentative explanation for the T-shaped distortion of 2 x2-y2 T-shaped trigonal planar z z xy, x2-y2 yz P P P xz, yz P P xz xy z2 z2 Highest doubly occupied d orbital: P P P dxz P P P dxy strong pi-backdonation to all three phosphine ligands S29 P Figure 25. Variable Temperature Magnetic data for 2-5 2 3 4 5 4.4 4.2 µeff(µB) 4.0 3.8 3.6 3.4 3.2 3.0 0 50 100 150 200 250 300 T(K) Data corrected for ~15% diamagnetic impurity of 12-crown-4, verified by 1H NMR integration, in 5 2 3 4 5 4.4 4.2 µeff(µB) 4.0 3.8 3.6 3.4 3.2 3.0 0 50 100 150 T(K) S30 200 250 300 Simulation Parameters Compound [TPBiPrFe][BArF4] [TPBiPrFe(N2H4)][BArF4] [TPBiPrFe(NH3)][BArF4] (TPBiPr)Fe(NH2) S 3/2 3/2 3/2 3/2 S31 g 2.009 2.031 2.044 2.000 D (cm-1) 13.933 19.937 12.162 11.348 Table 1. Product quantification for the decomposition of 3 to 4 Run Equiv H2 Equiv N2H4 Equiv NH3 1 0.01 None det. 0.09 2 0.009 None det. 0.12 3 None det. None det. 0.14 S32 Table 2. Crystal data and structure refinement for (TPB)FeMe (1) Identification code jsa200m Empirical formula C37 H57 B Cl Fe P3 Formula weight 696.85 Temperature 293(2) K Wavelength 0.71073 Å Crystal system Triclinic Space group P-1 Unit cell dimensions a = 10.9554(3) Å α= 91.4010(10)°. b = 11.5075(3) Å β= 95.4060(10)°. c = 15.9312(4) Å γ = 117.8130(10)°. Volume 1763.16(8) Å3 Z 2 Density (calculated) 1.313 Mg/m3 Absorption coefficient 0.665 mm-1 F(000) 744 Crystal size .456 x .304 x .209 mm3 Theta range for data collection 1.29 to 27.10°. Index ranges -14<=h<=14, -14<=k<=14, -20<=l<=20 Reflections collected 36496 Independent reflections 7758 [R(int) = 0.0311] Completeness to theta = 27.10° 99.8 % Refinement method Full-matrix least-squares on F2 Data / restraints / parameters 7758 / 338 / 402 Goodness-of-fit on F2 1.086 Final R indices [I>2sigma(I)] R1 = 0.0321, wR2 = 0.0813 R indices (all data) R1 = 0.0371, wR2 = 0.0860 Largest diff. peak and hole 0.890 and -0.305 e.Å-3 S33 Table 3. Crystal data and structure refinement for [(TPB)Fe][BArF4] (2) Identification code mem130 Empirical formula C68 H66 B2 F24 Fe N0 P3 Si0 Formula weight 1509.59 Temperature 100(2) K Wavelength 0.71073 Å Crystal system Orthorhombic Space group Pbca Unit cell dimensions a = 26.4056(9) Å α= 90°. b = 19.7833(7) Å β= 90°. c = 26.4402(9) Å γ = 90°. Volume 13812.1(8) Å3 Z 8 Density (calculated) 1.452 Mg/m3 Absorption coefficient 0.393 mm-1 F(000) 6168 Crystal size 0.32 x 0.30 x 0.26 mm3 Theta range for data collection 1.85 to 33.73°. Index ranges -35<=h<=41, -30<=k<=30, -41<=l<=41 Reflections collected 379408 Independent reflections 27590 [R(int) = 0.0500] Completeness to theta = 33.73° 100.0 % Absorption correction Semi-empirical from equivalents Max. and min. transmission 0.9046 and 0.8844 Refinement method Full-matrix least-squares on F2 Data / restraints / parameters 27590 / 18 / 951 Goodness-of-fit on F2 1.062 Final R indices [I>2sigma(I)] R1 = 0.0496, wR2 = 0.1239 R indices (all data) R1 = 0.0744, wR2 = 0.1400 Largest diff. peak and hole 0.740 and -0.532 e.Å-3 S34 Table 4. Crystal data and structure refinement for [(TPB)Fe(N2H4)][BArF4] (3) Identification code jsa19_0m Empirical formula C78 H68 B2 F24 Fe N2 P3 Formula weight 1659.72 Temperature 296(2) K Wavelength 0.71073 Å Crystal system Orthorhombic Space group Pbca Unit cell dimensions a = 20.0031(7) Å α= 90°. b = 25.7862(8) Å β= 90°. c = 26.6970(8) Å γ = 90°. Volume 13770.4(8) Å3 Z 8 Density (calculated) 1.601 Mg/m3 Absorption coefficient 0.404 mm-1 F(000) 6776 Crystal size 0.46 x 0.26 x 0.15 mm3 Theta range for data collection 2.00 to 32.59°. Index ranges -30<=h<=30, -39<=k<=39, -40<=l<=40 Reflections collected 347031 Independent reflections 25087 [R(int) = 0.0696] Completeness to theta = 32.59° 99.9 % Max. and min. transmission 0.9419 and 0.8361 Refinement method Full-matrix least-squares on F2 Data / restraints / parameters 25087 / 971 / 981 Goodness-of-fit on F2 0.937 Final R indices [I>2sigma(I)] R1 = 0.0531, wR2 = 0.1373 R indices (all data) R1 = 0.0872, wR2 = 0.1681 Largest diff. peak and hole 1.295 and -0.755 e.Å-3 S35 Table 5. Crystal data and structure refinement for [(TPB)Fe(NH3)][BArF4] (4) Identification code xds_ascii Empirical formula C68 H80 B4 F24 Fe N2 O2 P3 Formula weight 1605.34 Temperature 293(2) K Wavelength 0.71073 Å Crystal system Orthorhombic Space group Pbca Unit cell dimensions a = 19.846(4) Å α= 90°. b = 25.821(5) Å β= 90°. c = 26.862(5) Å γ = 90°. Volume 13765(5) Å3 Z 8 Density (calculated) 1.549 Mg/m3 Absorption coefficient 0.402 mm-1 F(000) 6600 Crystal size .25 x .15 x .15 mm3 Theta range for data collection 1.50 to 25.18°. Index ranges -23<=h<=23, -30<=k<=30, -32<=l<=32 Reflections collected 155016 Independent reflections 12232 [R(int) = 0.0175] Completeness to theta = 25.18° 99.0 % Refinement method Full-matrix least-squares on F2 Data / restraints / parameters 12232 / 972 / 961 Goodness-of-fit on F2 1.041 Final R indices [I>2sigma(I)] R1 = 0.0606, wR2 = 0.1680 R indices (all data) R1 = 0.0620, wR2 = 0.1692 Largest diff. peak and hole 1.741 and -1.346 e.Å-3 S36 Table 6. Crystal data and structure refinement for (TPB)FeNH2 (5) Identification code jsa23_0m Empirical formula C36 H56 B Fe N P3 Formula weight 662.39 Temperature 100(2) K Wavelength 0.71073 Å Crystal system Triclinic Space group P-1 Unit cell dimensions a = 10.9229(9) Å α= 77.268(7)°. b = 11.2493(13) Å β= 84.862(5)°. c = 16.5084(15) Å γ = 61.117(4)°. Volume 1732.1(3) Å3 Z 2 Density (calculated) 1.483 Mg/m3 Absorption coefficient 0.615 mm-1 F(000) 812 Crystal size 0.23 x 0.15 x 0.15 mm3 Theta range for data collection 2.11 to 28.28°. Index ranges -14<=h<=14, -14<=k<=14, -22<=l<=22 Reflections collected 52847 Independent reflections 8561 [R(int) = 0.0706] Completeness to theta = 28.28° 99.7 % Max. and min. transmission 0.9134 and 0.8715 Refinement method Full-matrix least-squares on F2 Data / restraints / parameters 8561 / 2 / 397 Goodness-of-fit on F2 1.120 Final R indices [I>2sigma(I)] R1 = 0.0545, wR2 = 0.1236 R indices (all data) R1 = 0.0810, wR2 = 0.1324 Largest diff. peak and hole 1.541 and -0.646 e.Å-3 S37 Table 7. Crystal data and structure refinement for (TPB)FeOH (6) Identification code jsa21_0m Empirical formula C36 H56 B Fe N O P3 Formula weight 678.39 Temperature 100(2) K Wavelength 0.71073 Å Crystal system Triclinic Space group P-1 Unit cell dimensions a = 10.9554(4) Å α= 77.466(2)°. b = 11.3311(4) Å β= 78.105(2)°. c = 16.6454(7) Å γ = 61.338(2)°. Volume 1757.30(12) Å3 Z 2 Density (calculated) 1.282 Mg/m3 Absorption coefficient 0.595 mm-1 F(000) 726 Crystal size 10.00 x 0.29 x 0.17 mm3 Theta range for data collection 2.07 to 37.78°. Index ranges -18<=h<=17, -19<=k<=19, -28<=l<=28 Reflections collected 142106 Independent reflections 18846 [R(int) = 0.0433] Completeness to theta = 37.78° 100.0 % Max. and min. transmission 0.9056 and 0.0661 Refinement method Full-matrix least-squares on F2 Data / restraints / parameters 18846 / 1 / 382 Goodness-of-fit on F2 1.024 Final R indices [I>2sigma(I)] R1 = 0.0316, wR2 = 0.0745 R indices (all data) R1 = 0.0477, wR2 = 0.0810 Largest diff. peak and hole 0.810 and -0.493 e.Å-3 S38 Figure 26. Crystal Structure for (TPB)FeOH (6) Note that hydrogens have been omitted for clarity. S39
© Copyright 2026 Paperzz