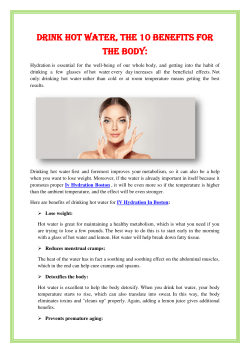
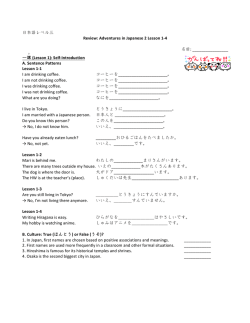
Review Exam 1 (Part 2) 1/ Forty-four percent of college students have engaged in binge drinking. a. If two college students are randomly selected, what is the probability that have engaged in binge drinking? Notice that: if A, B, C, and D are independent, P(A and B and C and D ) = P(A)*P(B)*P(C)*P(D) Because two college students are independent selected, the probability of student 1 is 44% and the probability of student 2 is also 44%. P(Student 1) = 44% P(Student 2) = 44% P(Student 1 and Student 2) = P(Student 1) * P(Student 2) = .44*.44= .1936 b. If five college students are randomly selected, what is the probability that have engaged in binge drinking? P(Student 1) = 44% P(Student 2) = 44% P(Student 3) = 44% P(Student 4) = 44% P(Student 5) = 44% P(Student 1 and Student 2 and Student 3 and Student 4 and Student 5) = P(Student 1) * P(Student 2)* P(Student 3) * P(Student 4) * P(Student 5) = .44*.44 *.44*.44*.44 = .445= 0.01649 c. If two college students are randomly selected, what is the probability that at least one of the five has engaged in binge drinking? P(at least 1 of five has engaged in binge drinking) = 1 – P(none of five has engaged in binge drinking) P(engaged) = 0.44 ----- P(not engaged) = .56 P(student 1 not engaged) = P(student 2 not engaged) = P(student 3 not engaged) = P(student 4 not engaged) = P(student 5 not engaged) = .56 P(all of five has engaged in binge drinking) = P(student 1 not engaged)* P(student 2 not engaged)* P(student 3 not engaged)* P(student 4 not engaged)* P(student 5 not engaged) = .565= .0550732 P(at least 1 of five engaged in binge drinking) = 1 – 0.0550732 = 0.94493 d. If two college students are randomly selected, what is the probability that at least one of the five has not engaged in binge drinking? e. P(at least 1 of five has not engaged in binge drinking) = 1 – P(all of five has engaged in binge drinking) f. P(engaged) = 0.44 g. P(student 1 engaged) = P(student 2 engaged) = P(student 3 engaged) = P(student 4 engaged) = P(student 5 engaged) = .44 h. P(one of five has engaged in binge drinking) = P(student 1 not engaged)* P(student 2 not engaged)* P(student 3 not engaged)* P(student 4 not engaged)* P(student 5 not engaged) = .445= .01649 i. P(at least 1 of five engaged in binge drinking) = 1 – 0.01649 = 0.983508 2/ 45.4 percentage of college students are male. The researcher founds that 12% of college student like to go shopping. What is the probability that students are male or going to shopping? P( Male) = 45.4% P(Shopping) = 12% Male and Shopping are independent P(Male and Shopping) = P(Male) * P(Shopping) = .454 * .12 = 0.05448 or 5.45% P(Male or Female) = P(Male) + P(Shopping) – P(Male and Shopping) = 45.4% + 12% - 5.45% = 51.95% or .5195 3/ You arrive randomly between 1:30 and 1:45. a. What is the probability that you will arrive before 1:35? Base = 1:45 – 1: 30 = 15 mins Y Height = 1 / (15 mins) P(X>1:35) = (1:45 – 1:35)/15 = 10/15 1:30 1:35 1:45 x b. What is the probability that you arrive after 1:40? Base = 1:45 – 1: 30 = 15 mins Height = 1 / (15 mins) P(X<1:40) = (1:40 – 1:30)/15 = 10/15 Y 1:30 1:40 1:45 x 4/ You arrive randomly between 2:00 and 2:30. What is the probability that you arrive between 2:15 and 2:20? (more than 2:15 or less than 2:20) Base = 2:30 – 2:00 = 30 mins Height = 1 / (30 mins) P(2:15 <X<2:20) = (2:20 – 2:15)/30 = 5/30 Y 2:00 2:15 2:20 2:30 x 5/ A survey of 200 adults in the US found that 76% regularly wear seatbelts while driving. 76% is a. Parameter b. Statistic because using the sample data 6/ The table shows that the favorite pizza topping for a sample of students. One of these students is selected at random. Male Female Total Cheese Pepperoni Sausage Total 8 5 2 15 4 9 2 3 5 10 9 24 a. Find the probability the student is female or prefers sausage P(female and sausage) = 3/24, P(female) = 9/24 and P(sausage) = 5/24 P(female or sausage) = P(female) + P(sausage) – P(female and sausage) = 9/24 + 5/24 – 3/24 = 11/24 b. What is the probability the student is female and Male? Because male and female are mutually exclusive (male and female are in the gender variable), P(female and male) = 0 c. What is the probability the student is female or male? P(female or male) = P(female) + P(male) – P(female and male) = 9/24 + 15/24 – 0 = 24/24 d. What is the probability the student is male and Cheese? 8/24 e. What is the probability the student is male or cheese? (15+10-8)/24 = 17/24 f. What is the probability that a randomly selected student who was male preferred pepperoni? P(pepperoni/ male) = P(pepperoni and male) / P(male) = (5/24) / (15/24) = 5/15 Or P(pepperoni/ male) = n(pepperoni and male) / n(male) = 5/15 Note: 1/ A descriptive value for a population is called a parameter and a descriptive value for a sample is called a statistic 2/ Qualitative – data are measurements that each fail into one of several categories (hair color, ethnic groups and other attributes of the population) 3/ Quantitative – data are observations that are measured on the numerical scale (distance traveled to college, number of children in a family, etc) 4/ Discrete Variables consist of indivisible categories (countable) such as a class size. Continuous variables (uncountable) are infinitely divisible into whatever units a researcher may choose (ex: time can be measured to the nearest minute, second, half second… or height or weight) 5/ Relative frequency = (frequency) / (sum of all frequencies) 6/ P(A or B) = P(A) + P(B) – P(A and B) additional rule is applied for or case 7/ If A and B are mutually exclusive, then P(A and B) = 0. As a result, P(A or B) = P(A) + P(B) 8/ If A and B are independent, the P(A and B) = P(A) * P(B) ………… P(A or B) = P(A) + P(B) – P(A) * P(B) 9/ P(A/B) = P(A and B)/ P(B) multiplication rule ….. As a result, 10/ Linear Regression model: . Use Lab 5 (Understand how to use the correlation coefficient formula) . How to find the predicted y that is given the value of x from using the least square formula 11/ Descriptive data . Mean, median, mode, variance and standard deviation . Understand how to calculate the standard deviation . If you have TL-30XS MultiView calculator, ask me how to use it to calculate the mean and standard deviation Instruction for TL-30XS: Click Data … input the raw data in the column L1 … Click 2nd and data … choose 1-var stats … Select L1 for data and one for FRQ…. Select Calc ….
© Copyright 2026 Paperzz