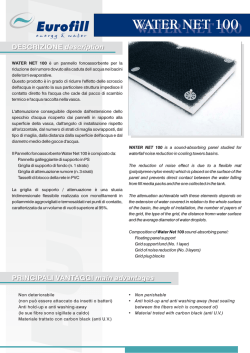
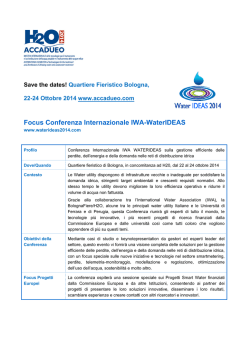
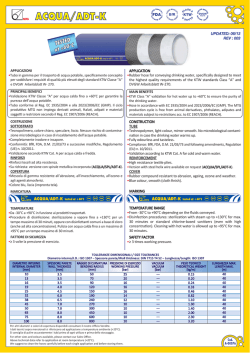
GNGTS 2014 Sessione 3.2 4D Monitoring of sea water intrusion by Electrical Resistivity Tomography: case study in the coastal alluvial plain of the Volturno River, Italy D. Tarallo, V. Di Fiore, G. Cavuoto, N. Pelosi, M. Punzo, L. Giordano, E. Marsella IAMC - CNR, Institute for Coastal Marine Environment, National Research Council, Naples, Italy Introduction. A common problem of coastal aquifers is saltwater intrusion, induced by the flow of seawater into freshwater aquifers due to the groundwater development near the coast. Several factors affect the ingression of sea water. Among these, the most important are the coastal subsidence, the lowering of the sea level, coastal erosion and excessive pumping of groundwater������������������������������������������������������������������������������ . In ���������������������������������������������������������������������������� fact, where the groundwater is pumped from coastal aquifers, the induced gradients may cause the migration of salt water from the sea to the well, making the freshwater unusable; being the fresh water less dense than salt water, it floats on top. According to the Integrated Coastal Zone Management (ICZM) of the European Commission, coastal areas are of great environmental, economic, social and cultural relevance. Therefore, the implementation of suitable monitoring and protection actions is fundamental for their preservation and for assuring the future use of this resource. Such actions have to be based on an ecosystem perspective for preserving coastal environment integrity and functioning and for planning sustainable resource management of both the marine and terrestrial components. Planning and management of natural resources through a dynamic process has to set, as its objective, the promotion of economic and social welfare of coastal zones. Unfortunately coastal plains are often contaminated by sea water intrusion, and the vulnerability to salinization is probably the most common and diffused problem in an aquifer. The boundary between salt water and fresh water is not distinct; the dispersion and transition zone, or salt-water interface are brackish with salt water and fresh water mixing. Under normal conditions fresh water flows from inland aquifers and recharge areas to coastal discharge areas to the sea. In general, groundwater flows from areas with higher groundwater levels (hydraulic head) to areas with lower groundwater levels. This natural movement of fresh water towards the sea prevents salt water from entering freshwater coastal aquifers (Barlow, 2003). 201 001-258 volume 3 201 24-10-2014 16:47:00 GNGTS 2014 Sessione 3.2 Sea water intrusion in the water table can cause significant worsening in vegetation status. A likely related soil salinization would cause detrimental environmental and socioeconomic impacts. Hence, monitoring the sea water intrusion represents a priority for the safeguard of coastal areas. Identify changes in the freshwater-saltwater interface position can be a useful element for the rationalization of water resources and to guide the choice of use of these areas. Among the geophysical method applied for the location and movement of saltwater intrusion, best results were obtained by electrical methods (Al-Sayed and AlQuady, 2007; Chitea et al., 2011). Many hydrological processes can be expected to provide significant contrasts in resistivity, consequently, Electrical Resistivity Tomography (ERT) has been adopted as a Fig. 1 – Location of the study area. Red lines are the 3D tool for new research within the hydrology ERT grid. field. Previous workers have demonstrated the ability of ERT to visualize hydrological structure within laboratory cores (Binley et al., 1996a, 1996b), monitor fluid or contaminant migration at the field scale (Daily et al., 1992, 1995; Schima et al., 1993), and to ascertain the efficiency of new contaminant remediation processes (Daily and Ramirez, 1995; LaBrecque et al., 1996). This paper outlines the results of a 3D ERT experiment obtained in the coastal alluvial plain of the Volturno river to assess changes in the freshwater-brine interface. The main aim was to investigate spatial and temporal variations of groundwater salinity. Acquisitions have been carried out in the months of May and October 2013 and in May 2014. This acquisition has allowed to obtain a monitoring 4D salt wedge in a “volume” specific subsurface. Geological and hydrogeological setting. The investigated area is located in the northern sector of the Campania Plain, near to the mouth of Volturno river (Fig. 1). It is the main river in southern Italy: it crosses Molise and Campania regions, for a total length of 175 km with a watershed of 545 km2. The Volturno is characterized by minimum flow in summer and overflow in autumn and spring. The area is characterized by a sub-horizontal morphology with main level similar to the sea level. The geomorphology of the Campania Plain corresponds to a structural depression which is formed during the Lower Pleistocene. Until to 130.000 years ago the plain of the Volturno was regulated by a phenomenon of subsidence (Cinque and Romano, 2001) and fell in a marine environment. Afterwards, the area was affect by pyroclastic fall-out and flow from Campi Flegrei and Roccamonfina (Ortolani and Aprile, 1978, 1985). In general, the stratigraphic sequence of the area is characterized by continental deposits (Romano et al., 1994; Corniello et al., 2010), a surface layer of silt and clay, an underlying sand layer and a basal layer characterized by clayey peat and reworked pyroclastics. River-borne sediments discharged in the sea in the past caused the river mouth to prograde. However, in the last 150 years, the latter has progressively retreated due to the dams built along the river and the extraction of gravel from the river bed (Biggiero et al., 1994). All these sediments have a lenticular pattern that determines a groundwater flow in layered aquifers. This determines, in conditions of excessive pumping and for a greater thickness of the sedimentary body that houses the sweet aquifer, a mixture of fresh water with the salt water. In 202 001-258 volume 3 202 24-10-2014 16:47:03 GNGTS 2014 Sessione 3.2 addition, the rising salt water also occurs along the bed of the river Volturno as the bottom of the river is located at the mouth, about 3.5 m below the sea level (Corniello et al., 2010). Geophysical methods and data processing. The Electrical Resistivity Tomography (ERT) consists of the experimental determination of the apparent resistivity ρ of a given material, by joint measurements of electric current intensity and voltage introduced into the subsoil through separate couples of electrodes, driven in the ground surface. All natural rocks can conduct electricity when subjected to an electric field. The measure with which the rocks are crossed through the current depends on the type of resistivity that they present. The resistivity parameter is influenced by: texture and porosity, degree of cementation, the temperature of the rock, clay content, water content and its temperature and salinity. Furthermore, under equal lithological conditions, there are some geological processes that cause an immediate variation of resistivity because they change the porosity. In general, many of these processes lead to a reduction of the resistivity as: clay alteration, dissolution, billing rock, saltwater intrusion. The instrumentation used for the measurement of the resistivity consists of two parts: one for the measurement of the current intensity I injected into the ground through the electrodes A and B and one for the measurement of the potential difference ΔV between the electrodes M and N. In the experimental surveys reported hereafter, the ERT data have been gathered through electrodes of length equal to 40 cm. The electrodes were then connected through multichannel cables, adopting the WennerSchlumberger array configuration. This type of arrangement is hybrid between the Wenner and Schlumberger arrays (Pazdirek and Blaha, 1996): during the acquisition, the wiring is continuously changed so that the spacing a between the ‘potential electrodes’ remains constant, while that between the ‘current electrodes’ increases as a multiple n of a. The value of n, in this case is given by the ratio between the distance of the electrodes A-M (or N-B) and the spacing between the electrodes of potential M-N. For this array the distribution of the measurements is comparable with the Wenner array, but the horizontal coverage is better. The choice of such arrangement was due to the necessity to study areas in which both lateral and vertical variations of resistivity are present. The resulting horizontal distribution of the underground data points in the pseudo-section, in fact, is comparable with that typical of the Wenner array, but their vertical resolution is better. Moreover, this type of array is a fair compromise between the device Wenner and the dipole-dipole. The intensity of the signal is smaller than the Wenner but is higher than the dipole-dipole axial. At constant distance between the current electrodes, the depth of investigation that can be achieved with the device Wenner-Schlumberger is 10% higher than the Wenner device. The geoelectric measurements of resistivity were executed with the georesistivimeter “SYSCAL Pro” of Iris Instrument. Within the chosen area for 4D monitoring of the salt wedge, geometrically similar to a rectangle of about 4600 square meters (length 115m and width 40 m), the geoelectric surveys performed by acquiring 9 geoelectric profiles. These profiles are arranged parallel to each other and with a spacing of 5 m and the multi-electrode resistivity measurements used 24 electrodes, for a total of 216 electrodes. Data acquired have been processed using 3D inversion technique performed with ERTlabplus software. Data inversion started from a discretized model of the investigated area, constructed starting from average apparent resistivities on measured pseudosection. The inversion procedure uses a smoothness-constrained least-squares routine implemented into Occam’s optimization algorithm (La Brecque et al., 1996b), which allows determining iteratively a 3D resistivity model for the subsoil. Result and discussion. The results of the inversion procedure are three high resolution ERT 3D models in different periods, more specifically in May and October 2013 and in May 2014. These acquisitions have allowed to obtain a 4D monitoring of saline intrusion in a specific subsurface “volume”. Resistivity data processing within that volume has therefore defined the electrical characteristics and geometry of the subsurface going to spatially delimit the intrusion 203 001-258 volume 3 203 24-10-2014 16:47:03 GNGTS 2014 Fig. 2 – 3D ERT tomography models determined for different periods: a) May 2013; b) October 2013; c) May 2014. Sessione 3.2 Fig. 3 – 3D resistivity contour plot referred to salt water (resistivity 4-15 Ωm): a) May 2013; b) October 2013; c) May 2014. of salt water and the relationship with the sweet water. 3D models obtained by the inversion also showed seasonal variation (in time) of these relationships. Analyzing the three models (Fig. 2) it is possible to notice variations of resistivity very small (a) 4,36-31,2 Ωm; b) 4,66 – 30,36 Ωm; c) 7,45 – 32,7 Ωm).The low resistivity zone (Fig. 3), located in the lower and side part of the models, is interpreted as salt water related to marine intrusion. The middle sector of the models presents resistivity values compatible with the fresh aquifer. In detail, it is possible to observe changes between the volumes of brackish water and fresh-water during the spring and autumn seasons. In particular, the results highlight lower resistivity values in autumn (October 2013) in the shallow sector, ascribed to an increase of salt intrusion. This phenomenon is attributed to a lower contribution of fresh water in the aquifer of the plain due to the reduction of rainfalls during the summer season. The comparison, instead, with the two resistivity models acquired in May 2013 and 2014 showed no significant changes. The results of this study have led to a reconstruction of a three-dimensional model of the water bodies in the areas of flat in order to understand the extent of the phenomenon of saltwater intrusion in time and space, resulting in qualitative and quantitative analysis of the volume of water used. This analysis shows that the shallow fresh-water should not be used because the pumping could determine greater intrusion of sea water, not allowing the accumulation of fresh water necessary in the natural suction of native species of plants. This monitoring program, supported by a careful management of resources, would prevent the worsening of the intrusion of the wedge with a difficult chance to return to the initial equilibrium conditions. Acknowledgements. The authors wish to thank Dr. Paolo Bonasoni, Scientific Responsible of I-AMICA project (High technology infrastructure for Integrated Climatic-Environmental monitoring), PON a3_00363. In addition, the authors wish to thank Paolo Scotto di Vettimo, Michele Iavarone, Dr. Rodolfo Baculo and Dr. Ivan Granata, for their help during data acquisition. References Al-Sayed E.A., El-Quady G.; 2007: Evaluation of sea water intrusion using the electrical resistivity and transient electromagnetic survey: case study at Fan of Wadi Feiran, Sinai; Egypt. EGM 2007 International Workshop, Italy. Barlow P.M.; 2003: Groundwater in fresh water-salt water environments along the Atlantic seaboard. Circular 1262 USGS. 204 001-258 volume 3 204 24-10-2014 16:47:12 GNGTS 2014 Sessione 3.2 Biggiero V., Fiorentino M., Pianese D.; 1994: Analisi dell’evoluzione d’alveo del tronco vallivo del fiume Volturno. Atti del Meeting Annuale UU.OO. MURST 40% “Processi Fluviali: osservazioni analisi e controllo”, Padova 10/1992. Binley A., Henry Poulte S., Shaw B.; 1996a: Examination of solute transport in an undisturbed soil column using electrical resistance tomography. Water Resources Research, v.32, pp. 763-769. Binley A., Shaw B., Henry Poulte S.; 1996b: Flow pathways in porous media: elettrical resistance tomography and dye staining image verification. Measurement Science Technology, v.7, pp. 384-390. Chitea F., Georgescu P., Ioane D.; 2011: Geophysical detection of marine intrusion in black sea coastal areas (Romania) using VES and ERT data. Geo-Eco-Marina 17/2011, pp. 95-102. Cinque A., Romano P.; 2001: Evoluzione geomorfologica e caratterizzazione oro-idrografica della Regione. In: L’ambiente geologico della Campania, a cura di A. Vallario, CUEN, pp. 59-90 Corniello A., Ducci D., Trifuoggi M., Rotella M. and Ruggieri G.; 2010: Hydrogeology and hydrogeochemistry of the plain between Mt. Massico and river Volturno (Campania region, Italy). Italian ��������������������������������������� Journal of Engineering Geology and Enviroment, 1, pp. 51-64, doi: 10.4408/IJEGE.2010-01.O-04. Daily W., Ramirez A., LaBrecque D., Nitao J.; 1992: Electrical resistivity tomography of vadose water movement. Water Resources Research, v.28, pp. 1429-1442. Daily W. and Ramirez A.; 1995: Electrical resistance tomography during in-situ trichloroethylene remediation at the Savannah River site. Journal of Applied Geophysics, v. 33, pp. 239-249. Daily W., Ramirez A., LaBrecque D. and Barber W.; 1995: Electrical resistance tomography experiments at the Oregon Graduate Istitute. Journal of Applied Geophysics, v. 33, pp. 227-237. LaBrecque D. J., Ramirez A., Binley A. and Schima S. A.; 1996a: ERT monitoring of environmental remediation processes. Measurement Science Technology, v.7, pp. 375-383. LaBrecque D. J., Miletto M., Daily W., Ramirez A, Owen E.; 1996b: The effects of noise on Occam’s inversion of resistivity tomography data. Geophysics, v.59, pp. 1839-1848. Ortolani F., Aprile A.; 1978: Nuovi dati sulla struttura della Piana Campana a sud est del fiume Volturno. Boll. Soc. Geol. It., 97, 591-608. Ortolani F., Aprile A.; 1985: Principali caratteristiche stratigrafiche e strutturali dei depositi superficiali della Piana Campana. Boll. ����������������������������������� Soc. Geol. It., 104, 195-206. Pazdirek O., Blaha V.; 1996: Examples of resistivity imaging using ME-100 resistivity field acquisition system. In: EAGE 58th Conference and Technical Exhibition Extended Abstracts, Amsterdam, P050. Romano P., Santo A., Voltaggio M.; 1994: L’evoluzione morfologica della pianura del Fiume Volturno (Campania) durante il tardo Quaternario (Pleistocene medio-superiore/ Olocene). ������������������������������� Il Quaternario, 7(1), pp. 41-56 Schima S., LaBrecque D. J. and Miletto M.; 1993: Tracking fluid flow in the unsaturated zone using cross-borehole resistivity and IP. Proceedings of the Symposium on the Application of Geophysics to Engineering and Enviromental Problems 1993, San Diego, CA, pp. 527-543. 205 001-258 volume 3 205 24-10-2014 16:47:12
© Copyright 2026 Paperzz