The useof gasexchange characteristics
to optimize CAstorage andMApackaging
offruits andvegetables
HermanW. Peppelenbos
Promotor:
dr. ir. R. Rabbinge
Hoogleraar in de theoretische productie-ecologie
/Wo2?o1
HermanW. Peppelenbos
The useof gasexchange characteristics
to optimize CAstorage andMApackaging
offruitsandvegetables
Proefschrift
ter verkrijging vandegraadvan doctor,
opgezagvan de rector magnificus
van de Landbouwuniversiteit Wageningen,
dr. C.M.Karssen,
in het openbaar te verdedigen
opvrijdag 22 november 1996
des namiddags te een uur dertig indeAula.
\^-i)fi\2t
2/>S
CIP-DATA KONINKLIJKE BIBLIOTHEEK, DENHAAG
Peppelenbos, Herman W.
The use of gas exchange characteristics to optimize CA storage and MA packaging of fruits
and vegetables
Peppelenbos, Herman W. - [S.I.: s.n.].III.
Thesis Landbouwuniversiteit Wageningen. - With réf.With summary in Dutch.
ISBN 90-5485-606-8
Subject headings: model,fermentation, storage
c•
Cover:
Part of the equipment for the measurement of gas exchange and diffusion
Design:
resistance.
Jolijn van Engelenburg
The research carried out in this thesis was carried out at the Agrotechnological Research
Institute (ATO-DLO), part of the Ministry of Agriculture, Nature management and Fisheries of
the Netherlands. It was financially supported by the Ministry of Agriculture, Nature
management and Fisheries and the Dutch commodity board for fruits and vegetables.
Stellingen
1.
N
Hetgasuitwisselingsgedragvangroenteenfruitisgoedtesimuleren
met een beschrijving openzymniveau1'2.
Dit proefschrift.
1
2
Chevillotte, 1973, J. Theor. Biol., 39: 277-295.
Cameron et al., 1995, HortSci., 30:25-34.
2.
Aérobie en anaerobie zijn onbruikbare begrippen alsoxidatieve en
fermentatieve processen gelijktijdigvoorkomen.
Dit proefschrift.
3.
Detoename van desnelheidvanfermentatieve processen bij lage
zuurstofconcentraties kanzowelwordenbeschrevenmetbehulpvan
een afname van de zuurstofconcentratie als met behulp van een
afname van deATP produktie.
Dit proefschrift.
4.
HetAnaerobieCompensation Point1kannietwordengebruiktomde
optimale zuurstofconcentraties voor de bewaring van appels te
voorspellen.
Dit proefschrift.
1
5.
Het idee dat fermentatie pas begint beneden een bepaalde
zuurstofconcentratie1'2,ishetgevolgvandegebruiktetechniekenom
fermentatieve metabolietentemeten.
Dit proefschrift.
1
2
6.
Kader, 1989, Acta Hort., 258: 161-167.
Knee, 1991, in:Plant life under oxygendeprivation,M.B.Jackson, D.D. Daviesand
H. Lambers (eds.): 229-243.
Grote lijnen alleen bestaan voor een onderzoeker niet. Creatieve
gedachten komenjuistvoortuithetcombinerenvandetails,vaakuit
verschillende randgebieden1.
1
7.
Boersig et al., 1989,J. Am. Soc. Hort. Sei., 113:869-873.
R. Plasterk, Volkskrant 4-9-1993, p. 15 wetenschap.
Het knotten van wilgen heeft meer met bonsai dan met natuur te
maken.
8.
Hetplaatsenvankunstvoorwerpeninwoonwijkenomdeleefkwaliteit
te verhogen is omstreden. Om een verdere achteruitgang in de
waardering vanopenbare kunsttevoorkomen,moetvoor plaatsing
de bewoners niet alleen inspraak worden gegeven over het type
kunstobject, maar ook over dewenselijkheidervan.
9.
Als de uitvoering van een reorganisatie afhankelijk wordt van het
succes van de voorgaande reorganisatie, zal dit verschijnsel veel
aan aantrekkingskracht verliezen.
10. Door het grote aantal doe-het-zelf zaken in Nederland ontstaat de
indruk dat er maar weinig goede huizen zijn.
11. Omdat het veroorzaken van slachtoffers door middel van een
voertuig altijd veel milder wordt bestraft dan wanneer dit gebeurt
door middelvaneenwapen,wordt asociaalgedrag metvoertuigen
aangemoedigd.
12. Door detoenamevan intelligente literatuurzoeksystemen wordt het
tijdschrift waarin gepubliceerd wordt steeds onbelangrijker.
13. Doordetoenamevandehoeveelheidt.v. uitzendingen metvoetbal
en zogenaamde reality-t.v. wordt de kans groter dat ook een
combinatie van beide zal ontstaan,wat det.v. kijker zal verlossen
van voetbalcommentatoren.
Stellingenbehorendebijhetproefschriftgetiteld"Theuseofgasexchange
characteristics to optimize CA storage and MA packaging of fruits and
vegetables", door HermanW. Peppelenbos.
Wageningen,22 November 1996
Aan Jolijn, Gideon enLucas
Aan mijn ouders
Contents
1
2
3
4
5
6
7
8
9
10
11
Introduction.The influence of low oxygen and high carbon
dioxide concentrations on storedfruits andvegetables
Evaluation of four types of inhibition for modelling the influence
of carbon dioxide on oxygen consumption of fruits and
vegetables
Modelling oxidative andfermentative carbon dioxide production
of fruits andvegetables
The influence of carbon dioxide on gas exchange rates of
mungbean sprouts at aerobic and anaerobic conditions
A methodforthe simultaneous measurement of gas exchange
and diffusion resistance under under various gas conditions
Functioning of gas exchange models using external and
internal gas concentrations of three apple cultivars
Respiratory characteristics and calculated ATP production of
apple fruit in relation totolerance to low 0 2 concentrations
Alcoholic fermentation of applefruits at various oxygen
concentrations. Model prediction and actual measurements
General discussion.The role of gas exchange charateristics
and models in storing and packaging fruits andvegetables
Summary
Samenvatting
References
Publications
Nawoord
Curriculum vitae
9
23
37
53
65
75
87
103
117
131
137
143
153
155
157
1
Introduction.
The influence of low oxygen and high carbon dioxide
concentrations onstoredfruitsand vegetables
Freshfruitsandvegetablesareimportantelementsinthehumandiet.Theseharvested
plantproductsareamainsourceforcarbohydratesandproteins,andcontainessential
biomoleculessuchasvitamins.Theappreciation,however, offruitsandvegetables is
notonlybasedonthesefunctionalelements,butalsoonfeatures likefirmness,colour,
taste, aroma and appearance. Immediately after harvest changes in plant products
occurwhich can beattributedto maturation, ripening andsenescence (Watada et al.,
1984; Kader et al., 1989). Although a physiological distinction between ripening and
senescence has never been finally drawn, ripening hastens the onset of senescence
andthe probability ofcellinjuryandcelldeath(Brady, 1987).Fromaconsumers point
of view postharvest changes often negatively affect the mentioned quality attributes.
The rate at which fruits and vegetables lose quality is influenced by environmental
conditions, such as temperature, humidity and gas composition. Studies on these
factors have lead to ways that prolong the storage period and shelf-life of numerous
fruits and vegetables.
Early research
Storage techniques based on altered gas conditions have a long history. Ancient
chinesewritings reportthetransport offruits insealedclay potswithfresh leaves and
grassadded.Thisgeneratedalowoxygenandhighcarbondioxideatmospherewhich
retardedthe ripeningofthefruit (Floras, 1990;Jameson, 1995).Duringthetimeofthe
Roman Empire modified gas atmospheres were created by sealing underground pits
9
Chapter1
filled with grain, thereby protecting it from insects and rodents (Kays, 1991). In the
beginning of the nineteenth century Berard demonstrated that fruit placed in closed
containers did not ripen (Berard, 1819). Extensive research onthe useof altered gas
conditions started earlythis century, withthe work of Kiddand West (1923), Thomas
(1925) and Blackman (1928). Kidd and West's discovery of the climacteric and
Blackman's studies of respiration in apples established the basis of modern
postharvest physiology (Laties, 1995). Commercial storage under altered gas
conditions started in England in 1929, when apples were stored in 10% C0 2 and
ambient 0 2(Kays, 1991).
CA storage and MA packaging
Reduced 0 2 concentrations and increased C0 2 concentrations also proved to be
beneficial for other products than apples. Nowadays low 0 2 and high C0 2
concentrations areinvolved inseveraltechniques.Themostcommonly usedforfruits
and vegetables are Controlled Atmosphere storage (CA) and Modified Atmosphere
packaging(MA).'Controlled'referstoa(large)storageroomwithmonitoringandactive
adjustment of the gas composition. 'Modified', however, refers to a difference in gas
composition as compared with ambient air, without any active control of the gas
composition. The gas composition within the package is the result of a balance
between metabolic rates of the packed product and diffusion characteristics of the
package. At the moment 60to 70%ofthe Dutch apple harvest and40to 50%of the
pear harvest is stored in CA facilities. MA packages are increasingly used in
supermarkets for products such as broccoli, corn, and minimally processed endive,
spinach, vegetable mixes and salads.
Regardingthesuitability forCA-storage andMA-packaging largedifferences between
harvested plant products are found. There are products, like apples, where storage
under low0 2 conditionscan increasethestorageperiodbymonths.Alsoproductsare
known, like carrots (Weichmann, 1977),that do not respond positively to low 0 2 and
high C0 2 concentrations. In general altered gas conditions are regarded as positive
only within acertain range of concentrations, the socalled 'optimum concentrations'.
Muchresearchhasbeendirectedtowardthedetermination ofoptimum concentrations
(Kader, 1986),andatthe momentfor many productstheseconcentrations are known
(Stoll, 1975; Isenberg, 1979; Smock, 1979; Kader, 1993; Meheriuk, 1993; Saltveit,
1993). At the moment CA and MA are used for products such as apples, pears,
10
Introduction
bananas, kiwi, strawberries, currants, cabbage and broccoli (Kader et al., 1989).
Disorders
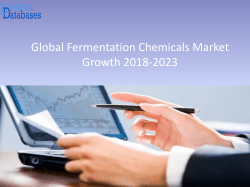
When plant products are stored at very low 0 2 or very high C0 2 concentrations,
increased fermentation rates are found together with disorders like necrotic and
discolouredtissues(Fig.1),andoffodoursandofftaste(Kaderetal., 1989).Disorders
in apples related to gas conditions are generally referred to as 'brown heart', in the
case of C0 2 injury, and 'low oxygen breakdown' in the case of 0 2 injury (Smock,
1977). Inpostharvest researchthegeneralideaisthatadirect relationexists between
fermentation and the occurrence of disorders. Thomas (1925) mentioned that as a
resultofacetaldehyde productionthesurfacesofapplesbecomebrown.Kader(1986)
statedthat the decarboxylation of pyruvate toform acetaldehyde, C0 2 and ultimately
ethanol, results in the development of off-flavours and tissue breakdown. 0 2
concentrationsareconsideredtobeoptimalwhenrespirationratesarereducedwithout
the development of fermentation (Kader, 1989; Banks et al., 1993). Nevertheless the
assumptionthatethanol istoxic undercertainconditions isstillnotgenerally accepted
(Pfister-Sieber and Brandie, 1994). Forcarrot cells PerataandAlpi(1991)foundthat
Figure 1.
DisordersfoundinBoskoopapplesstoredat 0.5%02 for6months(withkindpermission
ofDr.S.P.Schouten, ATO-DLO).
11
Chapter1
observed toxic effects of ethanol cannot be ascribed to ethanol per se but to
acetaldehyde. Unclear,however,iswhetheracetaldehydecannormallyaccumulatein
high enough quantities to cause damage.
From the beginning research on CA storage was focused on avoiding fermentation.
Throughouttheyearsseveralconceptswereusedtodescribefermentativemetabolism
infruitsandvegetables.ThefirstconceptwastheExtinction Point(EP),definedasthe
highest 0 2 concentration with no fermentative metabolites found (Blackman, 1928).
Very soon, however, ethanol was also found at normal 0 2 concentrations (Fidler,
1933),suggestingfermentative processestooccurinsituationswithsufficient oxygen.
ThiswasrecognizedbyBoersigetal.(1988),whoproposedtheAnaerobicCompensation Point (ACP),defined asthe0 2 concentration atwhichC0 2 production isminimal.
TheACPcanbeexplainedasthe0 2 concentrationwhereanincrease infermentative
C0 2 production compensates for the decrease in oxidative C0 2 production. This
impliesfermentationtooccurathigher0 2concentrationsthantheACP.Noexplanation
is known for fermentation being active at high 0 2 concentrations, and fermentative
metabolites found at these conditions are commonly referred to as 'background
concentrations' (Leshuk and Saltveit, 1991).
Optimal gas concentrations
Traditionally, lists of recommendedstorage conditions have beenevolved by national
research organizations by extensive laboratory research (Jameson, 1995). The
common experimental procedure is to store products under a range of 0 2 and C0 2
concentrations, and to monitor quality changes. The lower 0 2 limit for storedfruits is
accomplished empirically by lowering the storage 0 2 concentration until intolerable
damage occurred. Each commodity and new cultivar required a large investment in
time, equipment and materials (Wollin et al., 1985; Gran and Beaudry, 1993). By
repeating the trials year after year, it is possible to sense the importance of climatic
variation on product behaviour (Jameson, 1995).
Somecaution isneededwiththeapplicationofoptimalconcentrations.Forthevarious
apple cultivars, for instance, the advised optima differ per country (Meheriuk, 1993).
Growing conditions like climate and orchard factors influence crop growth and
contribute to these differences (Bramlage et al., 1980; Chen et al., 1986; Luton and
Holland, 1986). Although this is probably also the case for plant products other than
apples,this is never specified.
12
Introduction
Anotherimportantaspectofoptimalvaluesfortemperature,0 2andC0 2 concentrations
isthat they are often established separately, although interactions betweentemperature, 0 2 and C0 2 concentrations (and probably also humidity) are known.Optimal 0 2
concentrations are found to shift to a higher value when C0 2 concentrations are
increased (Thomas, 1925;Lougheed,1987;Kaderetal., 1989;Beaudry, 1993),when
products are more mature (Thomas and Fidler, 1933; Lidster et al., 1985; Boersig et
al., 1988;Kader, 1989),atahighertemperature (Thomas,1925;SaltveitandBallinger,
1983; Ke et al., 1991,Beaudry et al., 1992), or when products sensitive for chilling
injury are stored at lowtemperatures (Kader, 1986; Lougheed, 1987). For apples itis
foundthat the C0 2 limit at low 0 2 concentrations decreases when thetemperature is
decreased (Kidd and West, 1923).Also the effect of the relative humidity is often an
interactingfactor asacausefor, orinthesymptomexpression of, adisorder. Relative
humidity, however, is often not mentioned and frequently not (accurately) measured
(Lougheed, 1987).
The conclusion isthat it is very hardto advise an absolute value forthe optimum 0 2
and C0 2 concentrations orthe 0 2 and C0 2 limits for a product without knowledge of
other factors (Peppelenbos, 1995). In fact, despite a long history of CA and MA
research, the knowledge of the actual physiology behind the CA and MA effects
remainssketchyandempiricallybased(Banks,1989).Theprocessesandmechanisms
behind the influence of 0 2 and C0 2 and the reasons for the differences between
products are still quite uncertain. For a better understanding it is necessary to focus
on the biophysical and biochemical processes actually occurring within the plant
tissues exposed to extreme gas conditions. The main processes involved in gas
exchange processes are respiration, fermentation and diffusion.
Low oxygen and respiration
Afterharvestfruitsandvegetablesstaymetabolicallyactive,whichisexpressedinhigh
respiration rates. Respiration is a central process in living cells that mediates the
release of energy and the formation of carbon skeletons necessary for maintenance
andsyntheticreactionsafterharvest(Kays,1991).Respirationprovidestheenergyand
metabolites for maturation and ripening. A reduction of respiration results in a lower
energy supply and a reduced rateof changes withinthe product (Kader et al., 1989).
Conditionsaroundtheproductthat reducerespiration,likelowtemperature andlow 0 2
concentrations, should becreated.
13
Chapter1
Ingeneralthe reductionofthe respiration rateisregardedthemost important affected
process byaltered gas conditions (Banks et al., 1993; Leeet al., 1995),although itis
notthe only beneficial effect ofCAand MA (Kader, 1986). Laties (1995)for example,
criticizespostharvest studiesonripeningfocussingonrespirationwithout regardtothe
role of ethylene. Nevertheless he also mentions fruits not exhibiting an ethyleneinduced climacteric on ripening, and ethylene induced respiratory responses without
concomitant ripening. Thus, the course and nature of respiration in ripening fruit
remains of paramount interest (Laties, 1995). A good quantification of the effect of
reduced 0 2 on respiration rates is also essential for MA, asthis effect generates the
equilibriumconcentrationsinsideMApackages.ThereforeforagoodapplicationofCA
and MA it is important to have good insight inthe respiratory characteristics as they
are affected by 0 2 and C0 2 concentrations.
Respiration pathways
Respiration can bedivided intothree closely related pathways; glycolysis,TCA cycle
and oxidative phosphorylation. The term glycolysis, meaning lysis of sugar, was
introducedin1909todescribethebreakdownofsugartoethanol.Nowadaysglycolysis
is described asthe group of reactions that converts glucose (orfructose) to pyruvate
and inwhich2ATP and2 NADH molecules per glucose are produced (Salisbury and
Ross, 1985).Thebreakdownof pyruvatetakes place inacycleof reactionscalledthe
Krebs cycle (or TCA cycle). The Krebs cycle accomplishes removal of some of the
electrons from organic acid intermediates, andtransfer of these electrons to NAD+or
FAD.Permoleculeofpyruvate4NADHand1FADH2isgenerated.Alsoone molecule
ofATPisformedduringtheconversionofsuccinylCoAtosuccinicacid(Salisburyand
Ross, 1985).Thefinalpathway involvedinrespirationistheoxidativephosphorylation.
In this pathway the NADH and FADH2 produced in glycolysis and Krebs cycle are
oxidizedtoproduceATP.Thisoxidationstepinvolves 0 2 uptakeandH20production.
Fermentation
Glycolysis can function well without 0 2 , only the further oxidation of pyruvate and
NADH requires this gas. Lowering 0 2 concentrations around plant tissues inevitably
leads to a decrease in oxidative phosphorylation. The NADH produced in glycolysis
cannot be oxidized to NAD+. Thus when 0 2 is limiting, NADH and pyruvate are
accumulating (Salisbury and Ross, 1985). Fermentation enables the production of
14
Introduction
NAD+from NADH,whichensurestheproductionof(glycolytic)ATP,andanincreased
rate of glycolysis (Stryer, 1981). Under very low 0 2 conditions the glycolytic pathway
replacestheKrebscycleasthemainsourceoftheenergy neededbytheplanttissues
(Kader, 1986).The main products offermentation inplanttissues areethanol, lactate
and alanine, all derived from pyruvate, the end-product of glycolysis. Ethanol is the
major product inhigher planttissues (Ricardet al., 1994).Especially under prolonged
anoxiaethanolisthemostabundantfermentation product (Pfister-Sieber andBrandie,
1994; Ricard étal., 1994).
Gas exchange rates
Because respiration has acentral position inthe overall metabolism of a plant (part),
its measurement is often used as a general measure of metabolic rate (Kays,1991;
Leeetal., 1995).Specificmetabolicchanges,however,mayoccurwithout measurable
changesinnetrespiration(Kays,1991).Measurementsongasexchangewerealready
conducted by Kidd (1917) on pea and mustard seeds. In 1928 Blackman first
measured the C0 2 production of apple fruits. Thornton (1933) was the first who
measured 0 2 consumption of a range of harvested plant products other than apples.
Platenius (1943) combined the measurement of both 0 2 consumption and C0 2
production,andwas ableto derive respiration quotients (RQ).After the second world
wargasexchangeratesareextensivelymeasured,undervarious0 2 ,C0 2 ,temperature
and humidity conditions. To estimate the increase of fermentation rates at low 0 2
conditions, the measurement of only 0 2 consumption orcarbon dioxide production is
not adequate. The measurement of both 0 2 consumption and C0 2 production under
various combinations of fixed 0 2 and C0 2 concentrations, however, is rarely done.
Thusfar only data are known on apples (Fidler and North, 1967), tomato (Yang and
Chinnan, 1988;Chinnan and Pendalwar, 1990)and mushrooms (Peppelenbos et al.,
1993). In addition also data are known measured with a clever technique using MA
packages to derive various gas conditions: tomato (Cameron, 1989) and blueberry
(Beaudry et al., 1992; Beaudry, 1993).
Diffusion
Some experimental data on gas exchange rates cannot be understood if diffusion is
not taken into account (Chevillotte, 1973). Normally respiration rates of products are
compared with 0 2 and C0 2 concentrations from the atmosphere aroundthe product.
15
Chapter1
However, itisknownthatconcentrations insideaproductdifferfromtheconcentrations
outside.There are diffusion barriers betweentheexternal atmosphere andthe actual
place where respiration takes place, the mitochondria. This leads to a different
response of intactfruitsto0 2 concentrations comparedtocellcultures (Boersiget al.,
1988). Although the terminal oxidase of respiration is saturated at 0 2 concentrations
well below 5%, apple respiration is still increasing at higher 0 2 concentrations. This
behaviour isoftenexplainedbythecombinationofrespiratory responseswith diffusion
limitations within fruits (Burton, 1974;Cameron et al., 1995).
AIR
C02
FILM
PACKAGE
VOLUME
PEEL
INTERNAL
VOLUME
CELL
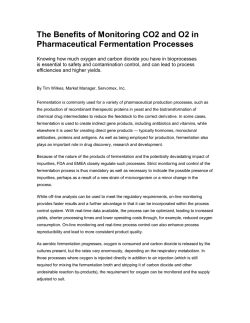
Figure2.
RESP
MaingasexchangeprocessesinsideaMApackage.02 =Oxygen,C02 =Carbondioxide,
DIF= diffusion,RESP= respiration(adaptedfromPeppelenbos, 1995).
Diffusion of the metabolic gasses 0 2 and C0 2 , between the external and internal
atmosphere of both package and product, isoften consideredtofollow Ficksfirst law
(Burgand Burg,1965;Cameron andYang, 1982;Emondet al., 1989).This iscorrect
if the skin is the major barrier for diffusion (Knee, 1991a,b), and if the rate of C0 2
production is uniform throughout the tissue (Solomos, 1987). From research by
Rajapakse et al. (1990) it is known that for some products diffusivity in flesh tissues
must be taken into consideration. In apples, however, the percentage of the total 0 2
gradientbetweentheexternalatmosphereandtheinternalcorecavitycausedbyflesh
was foundto bevery low. Adifference inthe resistance to gas diffusion is one of the
16
Introduction
reasons for differences between products intheir response to altered gas conditions.
Often the diffusion resistance between the intercellular space volume and the
atmosphere aroundthe product isassumedto beconstant, although Rodriguez et al.
(1989) found a relationship between ripeness of fruits and the resistance to gas
diffusion. Also internal gas volumes and internal concentrations in a product are not
homogeneous (Solomos, 1987; Weichmann and Brückner, 1989; Rajapakse et al.,
1990).These findings stress that for acorrect estimation of the relationship between
0 2 and C0 2 concentrations and respiration rates, internal gas concentrations should
beknown.Thisinformationcanbeusedtoimproveknowledgeonchanges inoptimum
storage conditions during storage of products. When the considerations on gas
exchange,fermentation anddiffusion arecombined,aproduct likeanapple seemsto
resemble a MA-package itself (Dadzie et al., 1993; Peppelenbos, 1995):optimum 0 2
and C0 2 concentrations seem to depend most onthe combination of the respiration
rate, the diffusion resistance andthe internal volume of the product (Fig.2).
Models
Both respiration andfermentation result inmassfluxes of0 2 andC0 2 . To relatethose
fluxes to gas concentrations, several equations were developed (Hayakawa et al.,
1975; Yang and Chinnan, 1988; Mannapperuma et al., 1989). These empirical
descriptions of 0 2 uptake can cause serious prediction errors, especially at low 0 2
concentrations (Cameron et al., 1995). At the moment the most widely used and
appreciated equation to describe respiration of a whole fruit is based on a
mathematical description ofthe kinetics at enzyme level.This Michaelis-Menten type
of kinetics have been used by several authors (Chevillotte, 1973, Banks et al., 1989,
Lee et al., 1991, Andrich et al., 1991):
=
02
Vm02 * Q2
Km02 + 0 2
(1)
where V02 is the 0 2 consumption rate (ml.kg"1.h1), Vm02 is the maximum 0 2
consumption rate(ml.kg~1.h1),0 2 isthe0 2concentration (%) andKm02istheMichaelis
constant for 0 2 consumption (% 0 2 ). In equation 1 it is assumed that the whole
respiratory chain can be described by one enzyme mediated reaction, with the
substrateglucoseconsideredasnon-limiting,andthesubstrate0 2aslimiting.Thetotal
reaction is considered to be in a pseudo steady-state. Steady-state refers to the
17
Chapter1
assumption that the enzyme-substrate complex reaches a constant value soon after
the start of the reaction (Chang, 1981). 'Pseudo' is added by Rubinow and Segel
(1991), because they expect the enzyme-substrate complex to bechanging slowly in
time.The Km02 inthe equation referstothe 0 2 concentration wherethe reaction rate
(0 2 uptake rate) ishalfthemaximum rate.Vm02 isthemaximum reaction rate,incase
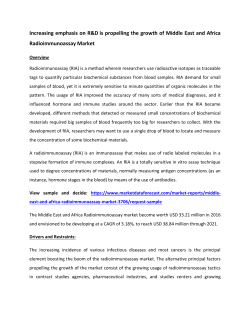
0 2 is also non limiting. Because not only low 0 2 concentrations reduce respiration
rates, but also high C0 2 concentrations (Fig.3),equation 1was modified to describe
this effect.
S
Q.
3
IN
O
0
3
6
9
12
15
18
O Concentration (%)
Figure3.
GasexchangedataofFidlerandNorth(1967),combinedwithequation2, withVm02=6.0,
Km02 =4.2andKmC02=4.0(U =dataat0%C02, • =dataat5% C02,
at 0%C02,
=model
=modelat 5% C02).
Although it was unclear which type of inhibition was caused by high C0 2 , the noncompetitive type was used by Lee et al. (1991):
y,02
Vm,02
(Km02 + 02) * (1 +
o,
CO,
Km,C02
where KmC02 is the Michaelis constant for C0 2 inhibition of 0 2 consumption (% 0 2 ).
The limitation ofthe modelsthusfar isthatthey canbeusedonlyforthecalculationof
18
(2)
Introduction
oxidative processes: respiration. If apackage orthetransport and storage conditions
are not optimal and fermentation takes place, even during a small period, the
calculated concentrations will differ from the actual concentrations. For the enzyme
kinetics modelspecific parameters must beknownfor every product; Vm02, Km02 and
Kmc02.Accurate measurements of0 2 consumptionandC0 2 production undervarious
0 2 and C0 2 concentrations are needed to calculate these values. Thus far only few
data are published that meetthisneed.
For the MA technique the most suitable package can be calculated by combining
product data(optimum levelsof0 2 andC02) andpackage data (diffusion characteristics) with descriptions of the underlying physical and physiological processes
(respiration, fermentation and diffusion). Simulations of changing 0 2 and C0 2
concentrations in a MA-package are shown in Fig.4.
concentration (%)
25
20
15
10
' ~\ " /
5
\^
i
• — _ _
/
;
1 1 1 1 1 1 1 I
0
4
8
1 1 1 I
1 1 I
12
! 1 1
1 1 1 1 1 1
I ' l l
16 20 24
28 32
36
time (hour)
— Oxygen - - Carbon Dioxide
Figure4.
Simulation of the change in 02 and C02 concentrations in a MA-package (adapted from
Peppelenbos, 1995).
19
Chapter1
Outline of the thesis
Respiration isthe key process behindthe positive effects of CA and MA technology,
while fermentation is thought to be closely related to disorders. Optimum gas
concentrations for storage are often a compromise between decreased respiration
rates and increased fermentation rates. The exact reason for a specific optimum
concentration is unclear. It is expected, however, that a good quantification of
metabolic products, includingfermentative metabolites andenergycarriers,willclarify
animportantpartofthetoleranceofharvestedplantproductstolow0 2 concentrations.
Modelsareessentialtosimplify alltheprocesses involved,andtogenerate predictions
on metabolic rates and needs.
The thesis isfocussed on the analysis ofthe quantitative meaning of respiration and
fermentation for the decrease in quality of stored produce. To integrate basic
physiological knowledge models are developed that quantify the influence of the
metabolic gasses 0 2 and C0 2 on gas exchange rates. First respiration is described,
with a special focus on the influence of high C0 2 concentrations, and by which type
of inhibition this influence can be described best (chapter 2). Inthe next chapter (3)
two models are derived, as the 0 2 uptake model based on a description of enzyme
kinetics, enabling the description of C0 2 production. The models make a distinction
between C0 2 produced byoxidative orfermentative processes.Thefunctioning ofthe
two models isthen compared withtwo previous described models. Because analysis
oftheC0 2productionmodelsrevealedthatC02notonlyinfluencesrespiration (chapter
2),butalsofermentation,thisinfluence isfurtheranalyzed inchapter4.Toincludethis
aspect of gas exchange one of the C0 2 production models was modified. Together
chapters2,3and4addresstheinfluenceofvarious 0 2 andC0 2 concentrations on 0 2
uptake and C0 2 production of a range of harvested plant products.
Inthe mentioned chapters gasexchange rateswere relatedto gasconditions outside
a product, although the metabolic processes themselves take place incell organelles
experiencing different gas conditions. Therefore chapter 6 is addressing the role of
resistances to gas diffusion in the functioning of the derived gas exchange models.
First (chapter 5) a newly developed method is described to measure both gas
exchange rates anddiffusion resistance simultaneously and onthe same object. The
data obtained by this method are used to calculate internal 0 2 concentrations. The
functioning ofgasexchange models isanalyzed usingboththeexternalaswellasthe
calculated internal 0 2 concentrations (chapter 6).Chapter 7 isfocussed onthe useof
20
Introduction
gasexchange modelsforthepredictionofthetolerancetolow0 2 concentrations.This
was done by comparing changes in specific gas exchange characteristics, like the
Anaerobic Compensation Pointandthe Respiration Quotienttochanges inoptimal 0 2
concentrations during storage as observed in literature. Based on the models also
energy (ATP) production was calculated and compared to estimated maintenance
energy requirements forthe prediction of optimal 0 2 concentrations forthe storageof
apples.Althoughthemodels describedarebasedonenzymekinetics,theyaremerely
used as mathematical tools only.To have some idea oftheir physiological relevance,
predictedfermentation ratesundervarious0 2concentrationsarecomparedwithactual
measurements on fermentative metabolites (chapter 8). The last chapter (9), the
general discussion, is summarizing and integrating the results of the other chapters.
21
22
2
Evaluation of four types of inhibition for modelling the
influence of carbon dioxide on oxygen consumption of
fruits and vegetables
H.W. Peppelenbos, J. van 't Leven.
1996, Postharvest Biol. Techn., 7:27-40.
Abstract
High carbon dioxide (C02) concentrations can reduce the oxygen (02) consumption
rateofanumberoffruitsandvegetables.Thisreductioncanbemodelledbyfourtypes
of inhibition inanenzyme kinetics model: 1.thecompetitivetype,2.the uncompetitive
type,3. acombination of both previoustypes and4.the non-competitive type.These
different types of inhibition were tested for describing the C0 2 influence on 0 2
consumption usingexperimentaldatasupplementedwithdatafrom literature.Thegas
exchange rates of apples (cv Golden Delicious and Elstar), asparagus, broccoli,
mungbean sprouts andcutchicorywere measured underawide rangeof0 2 and C0 2
concentrations.WiththerangeofC0 2 concentrations used,noinfluencewasfoundon
gas exchange rates of apples. There was a clear influence of high C0 2 on the gas
exchange rates of the other produce.A good estimation of 0 2 consumption could be
obtainedwiththeinhibitionmodels.ThissupportstheuseofMichaelis-Menten kinetics
for modelling0 2 consumption. Depending onthe productthe statistical analysis gave
goodresultsforthecompetitiveandtheuncompetitivetypeofinhibition.Basedongas
exchange dataonly, nodistinction betweenthecompetitive anduncompetitive typeof
inhibition could be made. It suggests the simultaneous existence of both types of
inhibition. Therefore the combined inhibition equation seems most closely related to
what isactually occurring inplanttissues. However, for reasons of simplicity the noncompetitive type of inhibition is preferred, showing similar results to the combined
23
Chapter2
inhibition, and giving good results for all the productstested.
Introduction
Low0 2 concentrations arecommonly usedfortheextensionofthestorage periodand
shelf lifeofanumberoffruitsandvegetables.Thedecrease inthegasexchange rates
underthese conditions is considered to bethe most important, although not the only
factor for the retarded deterioration of the products (Kader et al., 1989). For an
effective application of gas conditions in systems like Controlled Atmosphere (CA)
storage or Modified Atmosphere (MA) packaging, the relationship between gas
concentrations andgas exchange rates must beknown.The relationship between 0 2
concentrations and 0 2 consumption rates can be described using Michaelis-Menten
kinetics (Chevillotte, 1973; Banks et al., 1989). Although this description is a
simplification, based on one (limiting) enzymatic reaction instead of all the enzymes
involved,therelationfitswellwithexperimentaldata(Banksetal., 1989;Andrichetal.,
1991; Lee et al., 1991). The relation between 0 2 concentration and 0 2 consumption
is described as:
_ Vmoz * O
'oz
Kmos +O,
where V02 is the 0 2 consumption rate (ml.kg'1.h"1), Vm02 is the maximum 0 2
consumption rate(ml.kg"1.h1),0 2 isthe0 2concentration (%) andKm02istheMichaelis
constant for 0 2 consumption (% 0 2 ). For some products, both 0 2 and C0 2
concentrations haveaninfluenceonqualityandshelf life.At highC0 2 concentrations,
quality loss could be reducedfor products such as broccoli (Lebermann et al., 1968),
pear (Ke et al., 1990),figs (Colelli et al., 1991) and mushrooms (Peppelenbos et al.,
1993). An influence on the gas exchange rate is found for C0 2 as well (Kidd, 1917;
Thomas, 1925;Thornton, 1933;FidlerandNorth,1967;ShipwayandBramlage,1973;
Kerbel et al., 1990).This isoften explained asan influence of C0 2 onthe activitiesof
enzymes inthe glycolysis (Shipway and Bramlage, 1973,Kerbel et al., 1990; Hesset
al., 1993) and the Krebs cycle (Bendall et al., 1960; Frenkel and Patterson, 1973;
Shipway and Bramlage, 1973). Bendall et al. (1960) suggested a direct competitive
effect of C0 2 on succinic dehydrogenase. Shipway and Bramlage (1973), however,
state that the effect of C0 2 is not dueto aneffect on a single enzyme.They suggest
24
(1)
Evaluation of02uptake models
that the effect of C0 2 on many enzymes can probably be attributed to pH changes.
This isconfirmed by Hess et ai.(1993),whofound an indirect effect of C0 2 onATPand PPi phosphofructokinase dueto changes inpH.
The question arises whether the overall influence of C0 2 can be modelled using the
kinetics of a single enzyme, as is done with 0 2 influence on 0 2 consumption. In
general three types of inhibition onthe reaction rate of an enzyme are distinguished:
competitive, non-competitive and uncompetitive (Chang, 1981).Thecompetitive type
ofinhibitionoccurswherebothinhibitor (C02)andsubstrate(02)competeforthesame
active site of the enzyme. An increase of 0 2 at high C0 2 concentrations would then
strongly influencethe 0 2 consumption rate.The modelwithcompetitive inhibition can
be described as:
Vm02* q.
V02
-
02 + Km02*
(
CO, \
1 +-JT—*-
(2)
where C0 2 isthe C0 2 concentration (%) andKmcC02isthe Michaelis constantforthe
competitive C0 2 inhibition of 0 2 consumption (% C02). The uncompetitive type of
inhibitionoccurswheretheinhibitor(C02)doesnotreactwiththeenzyme,butwiththe
enzyme-substrate complex. Inthiscasetheincreaseof0 2 athighC0 2 concentrations
has almost no influence onthe0 2 consumption rate (when 0 2 concentrations are not
very low).The model with uncompetitive inhibition can be described as:
v<* -
Vm02
Kmoz + Oz*
*o2
C
fi{ + Kmucoz)
°> )
(3)
where KmuC02 is the Michaelis constant for the uncompetitive C0 2 inhibition of 0 2
consumption (%C0 2 ).Thenon-competitivetypeofinhibitionoccurswheretheinhibitor
reactsbothwiththeenzymeandwiththeenzyme-substrate complex.This leadsto 0 2
consumption ratesat high C0 2 concentrations which lie inbetweenthose obtainedby
the previously described inhibition models.The model with non-competitive inhibition
can be described as:
25
Chapter 2
\ZrDQ2 * 02
V02 (Km02
• Oè * (l
(4)
+Kj\
where Kmn C 0 2 is the Michaelis constant for the non-competitive C 0 2 inhibition of 0 2
consumption (% C0 2 ). When enzyme reactions are described, only one enzyme is
involved. The complete respiratory pathway, however, involves many enzyme
reactions. This means that the 'overall' type of inhibition describing gas exchange can
be a combination of both competitive and uncompetitive types. The non-competitive
type of inhibition describes such a combination, but in such a way that assumes both
types to be equally active. Therefore an equation is given with a combination of the
competitive and uncompetitive type, where each type differs in its relative activity:
_
v
œ
KrriQz *
'
V">o2 * 02
CO, \ „
(
1 + —Kmc
— ? - + O, *2 1 '
œ2
CO, \
(5)
Kmucot)
Although Bendall et al. (1960) suggested a competitive type of inhibition by C 0 2 i n
Ricinus mitochondria, to our knowledge only the other types of inhibition have been
actually used for gas exchange models of whole products, i.e. the uncompetitive (Lee
et al., 1991) and the non-competitive type of inhibition (Peppelenbos et al., 1993). To
make a discrimination between these types of inhibition based on gas exchange data,
datasets are needed on 0 2 consumption measured at least at two different C 0 2
concentrations and at least three 0 2 concentrations. We found six datasets that meet
this requirement, published by Fidler and North (1967),Yang and Chinnan (1988), Lee
et al. (1991), Talasila et al.(1992), Beaudry (1993) and Peppelenbos et al. (1993). The
data of Talasila et al. (1992), Beaudry (1993) and Peppelenbos et al. (1993), however,
show no clear influence of C 0 2 on 0 2 consumption.
The four described inhibition models were tested with gas exchange data from
experiments and literature. The objective of this was to obtain a generic model
describing both the influence of 0 2 and of C 0 2 on 0 2 consumption. The model should
be able to describe gas exchange for different types of products.
26
Evaluation of02uptake models
Material and methods
Modeltesting
To test the reliability of the different types of C0 2 inhibition, data on 0 2 consumption
measured at different 0 2 concentrations (including very low 0 2 concentrations) and
C0 2 concentrations arenecessary.These datasetswereobtainedfrom literature and
from gas exchange measurements. The data were compared with the models using
the facilities for non-linear regression in the statistical package Genstat (release 5).
The 0 2 consumption was fitted using equations 1to 5. In all cases, the non-linear
equations werefitteddirectlywithout anytransformation, usingan iterative methodto
maximize the likelihood, rather than first linearizing the equations as is often done.
Linearizingthe equations isequivalenttochangingtheweight giventothe data inthe
estimation procedure. Thetwo methods will onlytendto coincide when the residuals
are small (Ross, 1990). Normally, when fitting linear models, an F-test is used for
comparing them when one model is asubset ofthe other. This cannot be applied for
non-linear models (DraperandSmith,1981),whichisthecasehere.Still,thevariance
ratiofor comparing two models when one hasextra parameters, givesa guideline as
to whether a model gives any real improvement.
Literaturedata
From the literature, three datasets were obtained with an influence of C0 2 on 0 2
consumption: data on apple (Fidler and North, 1967; Table 2), tomato (Yang and
Chinnan, 1988; Fig. 1,day 9) and broccoli (Lee et al., 1991; Table 3).
Product information
The products selected for the gas exchange measurements were apples (Malus
domesticaBorkh.,cv.GoldenDeliciousandElstar),broccoli[BrassicaoleraceaL.,var.
Italica), asparagus(AsparagusofficinalisL, var.Altilis),mungbeansprouts(Phaseolus
aureus,syn.mungo)and,representing a processed vegetable for MA packaging,cut
chicory (CichoriumintybusL., var. Foliosum).
The experiment with apples was carried out twice, once with Golden Delicious and
once with Elstar. Golden Delicious was harvested on27 September 1993and stored
in air for 4 weeks at 1°C. Elstar was harvested on 31 August 1993and stored inair
for 9 weeks at 1°C. Also the experiments with broccoli and asparagus were carried
27
Chapter2
out twice. Broccoli was harvested on 16November 1992 andon 30 November 1992.
Itwasstoredinairforonedayat2°C.Theasparaguswasharvestedon 14May1994
andon28 May 1994.Itwasstored inairfortwodaysat 1 °C.The mungbean sprouts
were harvested on 31 January 1994 and stored in air for two hours at 18 °C. The
chicorywasharvestedon3January 1994andstoredinairfortwohoursat 18°C.The
chicory leaves were cut into pieces of about 4 cm2one hour before the experiment.
Gasexchange measurements
Thefreshweight oftheproductswasmeasured.Thentheproductswereplacedin1.5
I flasks (20 I desiccators for broccoli). The flasks were stored in a temperature
controlled room andconnected to aflow through system.Atemperature and a range
of gas conditions were selected (Table 1), simulating storage temperatures for MA
packages of the tested products. The temperature was recorded automatically every
15 minutes with a Vaisala temperature probe (HMP 31 UT). The gas coming into a
flask was humidified by leading the gas through a 500 ml water flask. The relative
humidity in all experiments was close to saturation (97-99%). In the flow-through
system, pure N2,0 2 and C0 2 were mixed using mass flow controllers (Brooks, 5850
TR series). The flow rate used in the experiments was 400 ml.min"1. For all
experiments a complete factorial design was used with all the combinations of gas
concentrations as listed inTable 1.
Table 1. Experimentorysetupof thegas exchange measurements.
Temp=averagetemperaturefC, ±0.4 °C),02=02concentrations (%),C02 = C02 concentrations(%),nr
= number of products per flask/desiccator,rep = number of replications, weight = average weight of
measuredproductsandstandarddeviation (g),day=daysofstoragewhenrespirationratesweremeasured
(thesemeasurementswere averaged).
Product
Temp
o2
co2
nr rep
weight
day
Apple (G. Delicious)
Apple (Elstar)
Asparagus
Broccoli
Mungbean sprouts
Cut chicory
19.0
19.6
18.6
18.7
17.9
8.1
0,0.5, 1.5, 2.5, 8, 21
0,0.5, 1.5,2.5,8, 21
0,3, 10,20
1,3,5,21
0,0.5, 2, 6,21
0,0.5, 1.5,5, 20
0.5,5
0.5,5
0, 10,20
0, 2, 10
0,5
0, 5, 20
1
1
3
3
168.4+ 13.1
147.1 ± 10.1
153.217.2
593 ±101
30.6± 0.5
76.2± 2.1
2, 3, 4
2,3, 4
2, 3, 4
2,3, 4
2, 6,7
2,3,6
2
2
2
2
2
1
The gas concentrations selected in the experiments were based on previous
experiments (not shown) or literature data. For measuring gas exchange, the air
28
Evaluation of02uptake models
streamthroughtheflaskswasstopped.0 2 ,C0 2andN2concentrationsweremeasured
twicewithaChrompackCP2001gas-chromatograph(GC).Gaswasleddirectlyfrom
the flasks to the GC. The exact time of the measurement was logged. For every
measurement two samples were taken,and only the second sample was used.The
time period between first and second measurement was 2 hours at 8°C and 1hour
at 18 °C. The difference in concentration between the two measurements never
exceeded 0.5% 0 2 or C0 2 at high 0 2 and 0.3% at low 0 2 concentrations. The total
amount of air taken from the flasks was 7.2 ml,which resulted in a pressure drop of
6 mbarintheflasks (measuredwithaDruck PDCR930).Afterwards acorrectionwas
made for pressure loss. After the two measurements the flasks (desiccators) were
againconnectedtotheflowthrough system.The0 2 consumption rates,measuredon
different days, were averaged (Table 1). Data were only used from days showing
almost no difference in gas exchange (0 2 consumption and C0 2 production, not
shown).
Gas exchange rates were calculated by expressing the concentration differences
betweentwomeasurementsasvolumedifference (ml)perunittime(hour)andperunit
weight (kg fresh weight at the start of the experiment). The free volume of the
desiccatorsandtheflaskswascalculatedbysubtractingtheestimatedproductvolume
fromthe measured desiccator orflaskvolume.Theproduct volume was estimatedby
multiplying the fresh weight with the average density, which was 1.16 ml.g"1 for
broccoli, 1.05 ml.g"1forasparagus, 1.18 ml.g"1forcutchicory (Verbeek, 1988)and 1.05
ml.g"1formungbeanspruots.Forapplesthedensitywascalculatedforeach individual
apple using the method of Baumann and Henze (1983).
Results
The models withthe different types of inhibition weretested using both literature data
(Table 2) and experimental data (Table 3). Models 1(no inhibition) and 5 (combined
inhibition) were compared withthe other models using an F-test.
A clear effect of C0 2 on 0 2 consumption isfoundfor literature data onapples (Fidler
and North, 1967) andtomato (Yang and Chinnan, 1988). For both products model 1
showed poorer results thenthe inhibition models (Table 2).The non-competitive and
uncompetitive models gaveslightly better (notsignificant) resultsthenthe competitive
model (Table 2). For the broccoli data (Lee et al., 1991) the C0 2 influence was very
small and probably (considering the F-test) not significant.
29
Chapter 2
O = data at 0% C0 2
+ = data at 5% C0 2
= model at 0% C0 2
= model at 5% CO,
O =data at 0% C0 2
+ = data at 5% C0 2
c
o
n
= model at 0% C0 2
= model at 5% CO,
y^O
y
8
F
+/
3
U)
r
o
O
A+
+,
60
c
40-
^^~^
30-
/ / -- "
20"
±
,-•-""" _
O =data at 0% C0 2
+ = dataat 10%CO 2
• = data at 20% C0 2
= model at 0% C0 2
= model at 10% C0 2
= model at 20%CO,
ft,'
1//'
1'
r
10-
0
3
9
12
15
18
21
O Concentration (%)
Figure 1.
30
Averagevaluesfor02consumptiondata(ml.kg'.h') atseveral02andC02concentrations,
fitted with thenon-competitivetypeofinhibition.A: Apple cv. GoldenDelicious,B:Apple
cv.Elstar,C:Asparagus.
Evaluation of02uptake models
The C0 2 concentrations used showed no influence on 0 2 consumption rates for the
experimental data on apples. None of the four types of inhibition, compared to the
modelwithout inhibition,increasedthepercentageofexplainedvariance (R2,Table3).
Possibly the C0 2 concentrations used were too low for apples or, alternatively, the
period of measurement was too short to show any effect. The gas exchange dataof
asparagus, broccoli, mungbean sprouts and cut chicory showed a clear influence of
C0 2on0 2consumption rates.Theinhibitionmodelsgavebetterresultsthenthemodel
without inhibition (Table 3). The competitive and the combined type of inhibition
showed the best results for broccoli and asparagus. For chicory, however, the
competitivetypeshowedthepoorestresults.Formungbeansprouts,allinhibitiontypes
gaveequally goodresults,withhighvaluesfor Ft2.Inconclusion,noneofthe inhibition
models used showed the best results for all products measured.
Table 2. Regressionanalysisofdataon02 consumption obtainedfrom literature.
Model 1 =No influenceofC02, Model2= Competitiveinhibition, Model3= Uncompetitiveinhibition, Model
4 = Non-competitiveinhibition, Model5 = Combinedinhibition,R2= Percentage varianceaccounted for
(indicationforthegoodnessoffit)andBdi=adjustedforthenumberofparameters,v.r.=varianceratio,with
1 = comparisonwithmodel 1and5is comparisonwithmodel5 (+issignificantlydifferent,withP=0.05),
est= estimatedvalues,se= standarderror,*=couldnotbeestimated, Lee= EstimatedvaluesofLeeet
al.(1991) withuncompetitive inhibition.
Product
ModelR2adj
Apple (Cox's)
Fidler, North
1967
1
2
3
4
5
37.2
89.6
91.2
93.3
92.4
v.r.
1 5
Vm02
est se
Km02
est se
KmcC02
est se
KmuC02
est se
KmnC02
est se
+
+ + + -
4.18
4.84
5.59
5.32
5.25
1.02
0.45
0.55
0.40
0.50
4.24
2.30
4.16
3.45
3.28
3.09
0.96
1.17
0.81
1.07
.
-
-
16.0
18.2
22.4
19.1
23.0
8.2
6.5
8.9
6.1
12.3
17.4
17.1
24.1
18.4
25.1
16.1
11.1
15.1
10.3
21.4
229
230
245
242
245
16
16
23
20
24
1.92
1.63
2.06
1.93
2.06
0.63
0.75
0.66
0.60
0.70
+
Tomato
1
Yang, Chinnan 2
1988
3
4
5
.
52.3
80.7 + 84.2 + 82.9 + 80.2 -
Broccoli
Lee et al.
1991
1
2
3
4
5
59.7
61.8
64.6
64.2
60.2
Lee
-
_
----
219
1.4
0.82 0.39
3.05 0.81
-
-
4.49 0.96
3.45 3.28
5.03 2.58
-
-
-
-
23.0 12.3
*
15.5 8.7
*
.
29.5 50.4
*
-
-
-
.
-
.
-
87.0 86.0
*
41.4 16.6
14.0 17.3
-
112
86.8 91.0
-
115
-
114
31
Chapter 2
A
""""
_
„ - - "
/ 6t-
__^- —~~~-
= model at 0% C0 2
•
/ >
o//,
O = data at 0% C0 2
+ = data at 2% C0 2
• = data at 10%CO 2
-- - ~
_
__ __
= model at 2% C0 2
= model at 10% CO,
^*- '
#'
S/
['•
B
c
0 /
-t
_ _ ^
/ -""^
c
o
—
•
+
\A
\l
/
Q.
E
O = data at 0% C0 2
+ = dataat 10%CO 2
= model at 0% C0 2
= model at 10% CO,
O)
C
o
ü
0
C
40'
30-
--^~~
+
•
20-
O = data at 0% C0 2
+ = data at 6% C0 2
• = dataat 19%C0 2
= model at 0% C0 2
= model at 6% C0 2
= model at 19%CO,
10'
V
O Concentration (%)
Figure2.
Averagevaluesfor02consumptiondata(ml.kg~1.h~')atseveral02andC02concentrations,
fittedwiththenon-competitive typeofinhibition. A:Broccoli, B:Mungbeansprouts,C:Cut
chicory.
32
Evaluation of 02 uptake models
Table 3. Regressionanalysisofdataon02 consumptionfromgasexchange measurements.
Model 1=Noinhibitionincorporatedinthemodel, Model2=Competitiveinhibition, Model3=Uncompetitive
inhibition,Model4 = Non-competitiveinhibition,Model5 = Combinedinhibition,P? = Percentage variance
accountedforandeljj=adjustedforthenumberofparameters, est=estimatedvalues,v.r.=varianceratio,
with 1= comparison withmodel 1,5 = comparisonwithmodel5 (+is significantlydifferent,P= 0.05),se
= standarderror,*= couldnotbeestimated
Product
ModelR2adi
v.
1 5
Vm02
est se
Km02
est se
Apple G.Del.
1
2
3
4
5
96.0
96.1
96.4
96.3
96.2
- - - -
23.0
23.1
24.9
24.1
24.9
1.5
1.5
2.0
1.7
2.0
6.40
6.17
6.96
6.50
6.96
1
2
3
4
5
93.1
93.1
93.4
93.3
93.1
- - - -
15.2
15.2
16.1
15.7
16.1
1.1
1.1
1.4
1.2
1.5
1
2
3
4
5
88.1
96.3
94.8
95.7
96.5
+
+ + +
+ +
+
41.2
43.0
50.4
49.3
44.9
1
2
3
4
5
70.9
94.2
87.7
92.0
94.0
+
1
2
3
4
5
1
2
3
4
5
Apple Elstar
Asparagus
Broccoli
Mungbean
sprouts
Cut chicory
KmcC02
est se
KmuC02
est se
KmnC02
est se
0.98
1.03
1.08
0.96
1.11
-
-
33.8 22.7
-
-
64.1 49.8
4.57
4.55
4.88
4.61
4.88
0.86
0.96
0.94
0.85
0.96
-
2.2
1.3
2.3
1.8
1.8
2.95
1.22
3.24
2.76
1.57
0.60
0.27
0.46
0.34
0.37
-
8.19 3.17
14
7
18
11
9
4.94
2.51
6.05
4.72
2.82
1.47
0.47
1.28
0.72
0.63
-
+ +
+
124
132
169
159
137
85.3
95.2
93.9
95.0
96.5
+
+ +
+ +
+ +
+
25.0
24.9
28.4
28.1
26.1
1.7
0.8
1.5
1.2
0.9
0.86
0.19
0.81
0.67
0.26
49.2
72.7
85.7
83.4
83.9
+
+ +
+ + +
34.1
44.8
59.0
52.1
59.0
7.4
7.9
9.4
7.4
9.9
2.81
2.61
5.20
3.68
5.20
+ + +
47.8 70.0
*
429
*
*
33.8 23.3
*
.
-
42.7 43.0
-
-
91
42.7 44.0
-
-
37.2 6.1
.
-
-
45.1 6.1
135 81
-
2.37 0.59
_
-
-
_
-
-
11.5 2.3
3.00 1.15
59.9 78.2
-
0.30
0.08
0.21
0.16
0.10
-
.
-
-
1.41 0.74
27.5 11.5
-
1.97
1.56
1.94
1.36
2.05
-
.
-
-
5.0
*
1.3
-
8.03 2.37
0.71 0.33
13.1 3.3
-
-
3.41 2.31
*
8.05 2.90
-
*
8.04 3.07
126
14.2 3.1
13.5 4.8
-
The maximum 0 2 consumption rate (fitted as Vm02) was highest for broccoli, and
lowest for Elstar apples.The Km02 varied widely between the products, ranging from
0.20 (mungbeansprouts)to6.96 (GoldenDelicious).Thisdifference inKm02, probably
33
Chapter2
related to the different resistance for diffusion of the products, is reflected in the
differently shaped curves (shown in Fig. 1and 2). Two different apple cultivars were
measured andtheir respirationcurveswerecompared (Fig.1aand 1b).There seems
to be only a minor difference in the maximum 0 2 consumption rate (Vm02) and Km
(Km02) between Golden Delicious and Elstar apples. The different types of inhibition
arecompared inFig.3,wheretheequations (models)2,3and4fittedonbroccolidata
areshown.The Fig.showsthe different response ofthe inhibition modelsto elevated
C0 2 concentrations. As expected the competitive type shows the strongest inhibition
ofthethreetypes atlow0 2 concentrations,whereas itistheuncompetitivetypewhich
shows the strongest inhibition at high 0 2 concentrations. The non-competitive type of
inhibitionshowsaresponsewhichliesbetweenthatoftheothertwotypesofinhibition.
140
120
100
c
g
o.
E
D
(0
c
o
Ü
6
9
12
15
O Concentration (%)
Figure3.
Comparisonofthreeinhibitionmodelsfittedon02consumptionofbroccoli.:thecompetitive
(.
) ,non-competitive(
) and uncompetitive(
(upperthreelines)and 10%C02 (lowerthree lines).
34
) type of inhibition at 0% C02
Evaluation of02uptake models
Discussion
Enzyme kinetics ofthe Michaelis-Menten typeareemployedtodescribethe influence
of gas concentrations on gas exchange. Infact enzyme kinetics describe processes
at the level of a cell organelle. Inan agricultural product a series of resistances exist
to gas diffusion between a cell organelle and the atmosphere around the product.
When enzyme kinetics are used for these products, as it is done here, diffusion
resistances influence the model results intwo ways. Firstly they influences substrate
(02) availability,thereby affectingtheVm02, Km02andKmC02.Secondly, concentration
gradients along the tissue of the products can occur and it can be assumed that this
will result in different respiration rates within a product. For the model it is important
toestablishwhethertheoverallreactionisstilloftheMichaelis-Mententype.According
to Chevillotte (1973) this is not the case, but he states that the single enzyme
representation can still be satisfactory. This is confirmed by the percentage of
explainedvariance (R2inTable2)foundforall models.Themodels usedgive agood
descriptionforthe0 2 consumptionofalltheproductsmeasured.Thissupportstheuse
of Michaelis-Menten kinetics for modelling 0 2 consumption at product level.
Whenthe C0 2 influence on0 2 consumption is investigated moreclosely, a difference
between literature data and the present measurements becomes clear. Fidler and
North (1967) found an influence of C0 2 on 0 2 uptake of apples, but the current data
do notshowthis effect. Ontheother hand,thedataof Leeetal. (1991)show noclear
influence of C0 2 on broccoli,while the current measurements do show this.
Lee et al. (1991) selected the uncompetitive type of inhibition for modelling the
influence of C0 2 . The analysis of the current measurements on broccoli shows a
higher percentage of explainedvarianceforthecompetitive andthecombinedtypeof
inhibition (Table3). Moreover, the lower (more important) valuefor KmcC02 compared
to KmuC02 in the combined inhibition model suggests a major relative importance for
the competitive type of inhibition. The difference in the values for Vm02, Km02 and
KmuC02 given by Leeet al. (1991) andthevalues obtainedfromthe current statistical
analysis (Table 2) is probably caused bythe different methods of model fitting used,
asthe former authors linearized data and models beforefitting.
Based on gas exchange data only, no selection between the competitive and
uncompetitive type of inhibition can be made (Table 3). Itsuggests the simultaneous
existence of both types of inhibition, at least for broccoli, but probably also for
asparagus and mungbean sprouts, where the combined inhibition equation gave the
35
Chapter2
best results (Table3).The ideaisthatcombined inhibition (equation5) ismostclosely
relatedtowhat isactually occurring inplanttissues. For reasons ofsimplicitythe noncompetitive type of inhibition is preferred, as it gives very similar results to the
combined inhibition, and good results for allthe productstested.
The duration of the gas exchange experiments on apples was quite short (4 days).
This is in contrast to the experiments carried out by Fidler and North (1967) which
lasted 50to 200 days.This difference could be responsible forthe fact that no effect
of C0 2 on 0 2 consumption of Golden Delicious and Elstar apples was found in the
current measurements, in contrast to the results of Fidler and North (1967). On the
other hand, a clear C0 2 influence was found for broccoli (average values of 4
consecutive days), where Lee et al. (1991) found only a minor influence (measured
after 1day). Inadditiontothe question astowhichtype of C0 2 inhibition isinvolved,
this raises the question asto when the inhibition begins to take effect. Being a weak
acid,dissolvedC0 2 influencesthepHinthecytoplasm (Brown,1985).An influenceof
C0 2 on glycolytic enzymes by changing the pH was found by Hess et al. (1993).
Duringalongerstorage period,theinfluenceonpHcouldbelarger. Italsomeansthat
the influence of C0 2 on the metabolic rate could be of another type than the four
previously described, which are all based on a direct influence on enzymatic
intermediates.
Acknowledgements
TheworkwasinpartfinanciallysupportedbytheDutchcommodity boardforfruitsand
vegetables. Wethank E.C.Wilkinson for advice on statistical analysis of the models.
36
3
Modelling oxidative and fermentative carbon dioxide
production of fruits and vegetables
H.W. Peppelenbos, L.M.M. Tijskens, J. van 't Leven, E.C. Wilkinson
1996. Posth. Biol. Techn., 9: (in press).
Abstract
Twomodelshavebeendevelopedtodescribecarbondioxide(C02) productionoffruits
and vegetables in response to oxygen (02) and C0 2 concentrations. The models
describeacombinationofoxidativeandfermentativeprocesses.InbothcasestheATP
production rate, representing ATP concentration, functions as an inhibitor of
fermentative C0 2 production. The difference between the models is that ATP
production is calculated by using oxidative processes only or by a combination of
oxidative and fermentative processes. The models are compared with two published
ones which use the 0 2 concentration as an inhibitor of fermentative C0 2 production.
The comparison is made using gas exchange data of apples, asparagus, broccoli,
mungbeansproutsandcutchicory.AllfourmodelsallowforincreasedC0 2 production
at low 0 2 concentrations. However, high percentages of accountable variance were
found only for one published model andthe new onewhich uses oxidative ATP.The
performance oftheothertwo models isconsiderably poorer.The resultsdonot clarify
whether increased fermentation rates can be attributed to decreased 0 2 levels or
energyfluxes.Theapproachused,however,enablesthecalculationofC0 2 production
rates of different types of commodities stored under various gas conditions. This
facilitatesabetterpredictionofC0 2conditionsinsidestorageroomsandMApackages.
37
Chapter3
Introduction
InControlledAtmospherestorage (CA)orModifiedAtmosphere packaging(MA),fruits
and vegetables are exposed to low 0 2 and high C0 2 concentrations. These gas
conditions reducethe respiration rate,which is often regarded asthe main cause for
a slower rate of maturation and change of quality. Several models have been
developedtoenablethepredictionofgasconcentrations inMApackages.The relation
between0 2 andC0 2concentrationsand0 2consumption ratescanbedescribedusing
Michaelis-Menten kinetics (Chevillotte, 1973; Peppelenbos and van 't Leven, 1996):
Vm
v
02
=
Q2* °2
(Km02 * O*) * (1 + COJKmncoà
(1)
where 0 2 is the oxygen and C0 2 the carbon dioxide concentration (%), V02 the 0 2
consumption rate (ml.kg"1.h1), Vm02 the maximum 0 2 consumption rate (ml.kg'Vh"1),
Km02the0 2concentrationwherethe0 2consumption is50%ofthemaximum rate(%),
andKmnC02theC0 2 concentration (%) wherethe0 2 consumption isinhibitedfor50%.
Equation 1isalsooften appliedtodescribe C0 2 production (Leeetal., 1991;Songet
al., 1992).This approach assumes noC0 2 production at0%0 2 , which iscorrect ifno
fermentation takes place or if all of the fermentation which occurs leads to the
formation of products like lactate or alanine. In most plant tissues, however, it is
primarily ethanolwhich isformed infermentation (PerataandAlpi, 1993;Ricardet al.,
1994). This leads to additional C0 2 production at low 0 2 concentrations. When 0 2
concentrations are not too low, this extra C0 2 production can be accommodated for
someproductsbyadjustingVm02andKm02.However,equation 1 becomes unsuitable
for products with increasing C0 2 production at low 0 2 concentrations, such as
asparagusandcarrots (Platenius, 1943),pear(Boersigetal., 1988),cherry(Cameron,
1989) and blueberry (Beaudry et al., 1992).
To overcome this problem, four models have been published (Banks et al., 1993;
Beaudry et al., 1993; Peppelenbos et al., 1993; Andrich et al., 1994) that make
distinctions between C0 2 produced by oxidative metabolism and by fermentative
metabolism:
*C02
=
^C02(<M)
+
Vcozß
where VC02 is the total C0 2 production rate (ml.kg"1.h1), VC02(0X) the oxidative C0 2
production rate (ml.kg"1.h1),andVC02(f)the'fermentative' C0 2 production rate (ml.kg"1.
38
' '
Modelling C02production
h"1). Beaudry et al. (1993) and Andrich et al. (1994) use exponential functions to
describe fermentative C0 2 production. Banks et al. (1993) and Peppelenbos et al.
(1993), however, basetheir equations onanextension of equation 1,which is based
on enzyme kinetics. These latter authors calculate oxidative C0 2 production by
multiplying the 0 2 consumption with a specific RQ value, RQ0X, which is the ratio
between oxidative C0 2 production and 0 2 uptake:
W )
= RQ
o* * vo2
<3>
RQ0Xis assumed to be independent of 0 2 concentrations. Banks et al. (1993) as well
asPeppelenbosetal.(1993)regard0 2 asaninhibitoroffermentativeC0 2production.
The type of inhibition, however, is different. Banks et al. (1993), referredto as model
1, describe total C0 2 production as:
Vac - ™m * V02+ ™ -
""« - "
(0 2 +a)6
(4)
where a and b are empirical constants. Inaslightly modified version of the model of
Peppelenbos et al. (1993),total C0 2 production is calculated as:
v„ - *Q0X*vO2+
,+0™Kmfoz
W
whereVmfC02isthemaximumfermentativeC0 2 production rate(ml.kg"1.h1)andKmf02
the Michaelis constant for the inhibition offermentative C0 2 production by 0 2 .
Model 1 was not fitted to experimental data, whereas model 2 was fitted to gas
exchange data for mushrooms only. Therefore the degree to which either model
describes C0 2 production of different products isunknown.Theobjective ofthis work
was the development of a generic model describing the production of C0 2 under
various gas conditions for different types of products.
Material and methods
First,measurementsongasexchangeforarangeofproductsaredescribed.Thenthe
developmentoftwonewC0 2productionmodelsisexplained.Thetwonewmodelsand
the two published models were tested using the gas exchange data.
39
Chapter3
Gasexchange measurements
Gas exchange rates were measured on awide variety of agricultural products under
a range of 0 2 and C0 2 concentrations. The products selected for the gas exchange
measurements were apples (Malus domestica Borkh., cv. 'Golden Delicious' and
'Elstar'), broccoli (BrassicaoleraceaL, var.Italica),asparagus (Asparagus officinalis
L, var.Altilis), mungbean sprouts (Phaseolusaureus,syn. Mungo)and cut chicory
(Cichorium intybus L, var. Foliosum), representing a processed vegetable for MA
packaging.Measurements on0 2 consumptionandC0 2 productionwereperformedas
described in Peppelenbos and van 't Leven (1996). The conditions for the
measurements are shown inTable 1.
Table 1:The range of products and gas atmospheres used.
02=02concentrations(%), C02 =C02 concentrations(%), rep=numberofreplications, n=numberofdata
values,weight=averageweightofmeasuredproductsing.(andstandarddeviation), day=daysofstorage
whenrespirationrates weremeasured(thesemeasurementswere averaged).
Product
o2
Apple (Golden Delicious)
Apple (Elstar)
Asparagus
Broccoli
Mungbean sprouts
Cut chicory
0,0.5, 1.5, 2.5,8,
0,0.5, 1.5, 2.5,8,
0, 3, 10,20
1,3,5, 21
0, 0.5, 2, 6,21
0,0.5, 1.5,5, 20
21
21
co2
rep
n
weight
day
0.5, 5
0.5, 5
0, 10,20
0, 2, 10
0,5
0,5, 20
2
2
2
2
2
1
24
24
24
24
20
15
168.4+ 13.1
147.1 ±10.1
153.2 ±7.2
593 ±101
30.6 ± 0.5
76.2 ± 2.1
2,3,4
2,3,4
2,3,4
1,2,3,4
3,7,8
2,3,6
Modeldevelopment
Anincrease ofC0 2production at low0 2 concentrations canbeattributedto increased
rates of glycolysis and fermentation. Adenine nucleotides play a key role in the
regulation of the metabolic rates. For example, a relation between increased C0 2
production and reduced ATP concentration was found in potato tubers (Amir et al.,
1977).AlthoughtheATPconcentration hasnodirectinfluenceontheactivityofalcohol
dehydrogenase (Daviesetal., 1974;Keetal., 1995),itcaninfluencefermentation rate
indirectly. Both phosphofructokinase and pyruvate kinase are inhibited by high levels
ofATP (Stryer, 1981).AtlowATPlevels,theseenzymesbecomemoreactive,andthe
glycolytic rate is increased. This will result in increased ATP and NADH production.
When the low ATP levels were caused by low 0 2 concentrations (Tesnière et al.,
1994), the NADH produced in glycolysis cannot be oxidized to NAD+. Fermentation
enables the production of NAD+ from NADH, which ensures the production of
40
Modelling COz production
(glycolytic) ATP, and the increased rate of glycolysis (Stryer, 1981). In a model
summarizing these processes in one overall reaction, ATP concentration can be
considered as the main inhibitor of fermentative C 0 2 production. The following
equation, based onenzyme kinetics, canbederived if carbohydrates are considered
to be non-limiting inthefermentation process:
Vmf,
COS
V,
C02{f)
ATP \
KmfATP
(6)
where ATPistheATPconcentration (mg.kg 1 ) andKmfATP the Michaelis constant for
the inhibition of fermentative C 0 2 production byATP. If only gasexchange dataare
used for testing the models, noinformation isavailable onATP concentrations. As ATP
consumption of plant cells is closely tied to ATP production (Pradet and Raymond,
1983), a direct proportionality between ATP production andATPconcentration was
assumed. This allows theuse ofATP production to represent ATP concentration,and
ATP production can be estimated using gas exchange rates. The use of theATP
production rate in equation 5 was tested in two different models. One model was
based onthemain production route forATP, oxidative phosphorylation, which can be
directly derived from the0 2 consumption rate:
KITTO
=
v
o2 * 6 * 4 1 - 8 7
<7>
where VATP(ox) is the oxidative ATPproduction rate (u.mol.kg"1.h'1), 6 is the assumed
ATP/0 2 ratio, and 41.87 isaconversion factor (|imol.ml"1) based ontheideal gas law
(at 18°C and101.3 kPa). Combining equation 3,6and 7 gives thefollowing equation
for total C 0 2 production, referred to as model 3:
Vco2 = V « * RQoX
+
-.
1
• / " °?.. +
V
ATt\o>H I
(8)
Kmf
ATP
Oxidative ATP production is only part of total ATP production, especially at low 0 2
concentrations when fermentation is increased. Therefore both oxidative and
fermentative ATP production were used to represent ATP concentration in a second
model. It was assumed that the main fermentation route leads to the production of
ethanol and C0 2 (Perata andAlpi, 1993; Ricard et al., 1994) allowing the calculation
of fermentative ATP production from fermentative C0 2 production:
41
Chapter3
VW«» -
V
02* 6 * 41.87 + Vow * 41.87
(9)
whereVATP(total) isthetotalATP production rate(|xmol.kg"1.h1).Bycombining equations
3,6and9thefollowingequation (referredtoasmodel4)fortotalC0 2 productioncan
bederived:
v
V„n.
'C02 -~ V
02
m * RQm
Vmfc
+
1
+
°*Kmf
V
Amptal> I
< 10 >
Kmf
ATP
Modeltesting
The models werefitteddirectlytoC0 2 production datausing0 2 uptake (Peppelenbos
andvan 't Leven, 1996) by non-linear regression inthestatistical package GENSTAT
(Rothamstead, U.K.). The fitting of model 4 was complicated by the fact that
fermentativeATPproductionisafunctionoffermentativeC0 2 production (equation9),
while atthe sametimefermentative C0 2 production isafunction ofATP (equation6).
The problem was solved by using initial values for fermentative C0 2 production, and
then iteratively optimizing both calculations. The initial values were obtained by
subtractingthe product ofthe02consumptionvalues (Peppelenbos andvan 'tLeven,
1996) and an estimated RQ0X from the measured (total) C0 2 production. RQ0X was
estimated by dividing the measured C0 2 production by the measured 0 2 uptake in
ambient air,wherefermentation isexpectedtobevery low. Inallcasesthe non-linear
equations werefitted directly without anytransformation ofthe equations orthedata,
usinganiterative methodtomaximizethelikelihood.Modelswerecompared usingR2
values for the percentage variance accounted for, and the standard errors found for
the parameter estimations. As additional criteria on the applicability of the various
models, RQvalues werederivedbycombiningfitted C0 2 productionfrom eachofthe
four mentioned models with the fitted 0 2 consumption given by equation 1 for the
dataset of apple cv. Golden Delicious (after Peppelenbos and van 't Leven, 1996).
Thesefour setsof estimated RQ'swerecompared with RQvalues calculated directly
from the measurements.
42
Modelling C02production
Results
COsproductiondata
Thebehaviour ofthecommodities thatwereinvestigatedallowthemtobedivided into
twogroups.Inonegroupconsistingofthetwoapplecultivarsandasparagus(Figs.1a,
1band 1c),theC0 2 production increasedatlow0 2 concentrations. Intheothergroup,
consisting of broccoli, mungbean sprouts and cut chicory (Figs. 2a, 2b and 2c), C0 2
production was lowest at the lowest 0 2 concentration applied, but did not appear to
cease at 0 2 concentrations closeto 0%.Whenthe measurements onasparagus and
cut chicory were examined more closely, a reduction of C0 2 production at 0 2
concentrations closeto0%wasfoundwhenC0 2 concentrationswerehigher (Figs.1c
and 2b). Because almost all of the C0 2 produced at such 0 2 concentrations is the
result of fermentation,this suggests an influence of C0 2 onfermentation rates.
C02 productionmodels
Models2 (Peppelenbos et al., 1993) and3(oxidativeATP) consistently accountedfor
morethan 75%ofthevariance (R2,Tables 2and3). Model2 almost always resulted
in the highest values for R2, although the results of model 3 were only slightly lower
(Tables 2 and 3). It is not possible to say whether model 2 gives a statistically
significant betterfit than model 3.Thefitting of model2 onbroccoli data resulted ina
high R2, but also led to an unreliable value for the RQ0X (0.68, Table 2) and a high
standard errorfor Kmf02. Forall products model 1(Banks et al., 1993) resulted inlow
R2 values, and for 'Elstar' apples it was inapplicable. Also the standard error of
parameter b could not be established for any of the commodities because the
estimates forthe parameters aand bare highly correlated with each other (Table2).
When total ATP production (model 4) was used instead of oxidative ATP production
(model3)to representATPconcentration,theresultswereconsiderably worse (Table
3). The results of the two models were only comparable for products which showed
almost no increase in C0 2 production at low 0 2 concentrations (e.g. broccoli,
mungbean sprouts and cut chicory). An inhibition of oxidative C0 2 production by
increased C0 2 concentrations was foundfor asparagus, broccoli, mungbean sprouts
and cut chicory (Figs. 1c,2a,2b and 2c).This influence was especially clear at high
0 2 concentrations,wherefermentationwasverylowornegligible.Inallthemodelsthis
influence of C0 2 was incorporated intheterm V02 (eq.1).
43
Chapter 3
O =data at 0% C0 2
+ = data at 5% C0 2
= model at 0% C0 2
= model at 5% CO,
O =data at 0% C0 2
+ = data at 5% C0 2
= model at 0% C0 2
= model at 5% CO,
o
•o
O
O
ü
O =data at 0% C0 2
+ =data at 10%CO 2
• =data at 20% C0 2
= model at 0% C0 2
= model at 10% C0 2
= modelat 20%CO,
0 2 Concentration (%)
Figure 1.
Average valuesfor C02 productiondata(ml.kg'.h') combinedwitha modelfit. Thefitis
a combination of model 3 and equation 1 using the same gas exchange data (after
Peppelenbosandvan'tLeven, 1996). A:Applecv.GoldenDelicious,B:Applecv. Elstar,
C:Asparagus.
44
Modelling C02production
For two products, asparagus and mungbean sprouts, C0 2 production at an 0 2
concentration near 0%was also reduced by higher C0 2 concentrations (Figs. 1c and
2b).An influence of C0 2 onfermentative C0 2 production was not incorporated inany
of the models. Therefore fitting the models to the data of asparagus and mungbean
sprouts resulted in erroneous results. For instance model 3 predicts asmall increase
of C0 2 production at low 0 2 concentrations for mungbean sprouts, whereas the data
do not show this (Fig.2b).
Modelledfermentation
Using data for apples cv. Golden Delicious the predictions of the four models at low
0 2 concentrations were more closely examined. When the calculated total C0 2
production was compared to the data (Fig. 3a), two of the models seemed to be
slightly incorrect. Model 1gaveavery lowC0 2 production rateat 0.2%0 2 , wherethe
measurements showed much higher rates. In contrast, the total C0 2 production
predicted by model 4 never became as low as the measurements, and neither did it
rise asthe measured levels for fruit kept at
Table 2. Results of the regression analysis for C0 2 production.
Model 1= modelBanksetal.(1993),aandb = empiricalconstants,Model2 = modelPeppelenbos etal.
(1993), VmfC02 = themaximumtermentativeC02 productionrate (ml.kg'.h'1), Kmf02= Michaelisconstant
(expressedin % OJ, FFadj = P? Percentagevarianceaccountedfor (indicationof thegoodness of fit),edj.
adjusted for the number of parameters, est = estimated values, se = standard error,# = could not be
established, *= standarderrornotavailabledueto singularity.
Product
Model
Apple (Golden Delicious)
Apple (Elstar)
Asparagus
Broccoli
Mungbean sprouts
Cut chicory
20.6
#
34.2
71.2
68.5
66.7
RQ0,
est
se
est
1.07
1.16
0.87
0.93
0.98
1.01
0.02
0.01
0.02
0.04
0.04
0.02
0.283
0.270
0.324
0.007
0.334
0.002
b
est
a
0.003
0.003
0.002
*
0.002
0.003
2
2
2
2
2
2
91.4
82.1
92.2
92.2
89.9
98.9
0.99
0.98
0.84
0.68
0.92
0.99
0.03
0.04
0.01
0.07
0.03
0.02
16.6
14.7
26.1
20.7
12.2
9.82
*
*
*
*
*
Kmf02
VmfC02
Apple (Golden Delicious)
Apple (Elstar)
Asparagus
Broccoli
Mungbean sprouts
Cut chicory
19.8
19.6
19.8
5.0
19.8
5.63
1.71
0.97
1.57
2.62
1.04
1.44
0.233
0.492
0.190
88
0.367
0.310
0.062
0.095
0.050
150
0.153
0.134
45
Chapter3
O = data at 0% C0 2
+ = data at 2% C0 2
• = data at 10% C0 2
= model at 0% C0 2
= model at 2% C0 2
= model at 10%CO,
O =data at 0% C0 2
+ =data at 10%CO 2
= model at 0% C0 2
= model at 10% CO,
c
o
o
•o
O
O
O
C
o
50-
O =data at 0% C0 2
+ = data at 6% C0 2
40-
• =data at 19%C0 2
—'
20-
= model at 0% C0 2
_______ _
30-
/ /
P/V _ - » -
+
= model at 6% C0 2
••
= model at 19% CO,
101 %/ór'
0
3
6
9
12
15
18
21
0 2 Concentration (%)
Figure2.
46
Average valuesfor C02 productiondata(ml.kg''.h'1)combinedwitha model fit. Thefitis
a combination of model 3 and equation 1 using the same gas exchange data (after
Peppelenbos and van 'tLeven, 1996). A: Broccoli,B:Mungbeansprouts,C:Cutchicory.
Modelling C02production
Table 3. Results of the regression analysis for C02 production.
Model 3 = inhibition of fermentative C02 production by oxidative ATP production, model 4 = model 3 +
fermentative ATP production, Vmfc02 = the maximum fermentative C02 production rate (ml.kg'.h'), KmfATP
= Michaelis constant (expressed in ATP production rate, mmoles.kg'.h'),
P?^ = P?= Percentage variance
accounted for (indication of the goodness of fit), adj = adjusted for the number of parameters, est = estimated
values, se = standard error.
Product
Model
R adj
RQo«
est se
Vmf C02
est
se
est
se
1.8
0.8
2.1
7.3
5.5
0.22
0.42
0.70
8.90
0.96
0.27
0.06
0.09
0.19
6.40
0.63
0.30
0.66
1.03
2.10
14.8
3.62
1.39
0.14
0.20
0.30
6.31
1.48
0.62
Apple (Golden Delicious)
Apple (Elstar)
Asparagus
Broccoli
Mungbean sprouts
Cut chicory
3
3
3
3
3
3
90.2
78.3
87.2
93.1
83.4
97.2
0.95
0.88
0.79
0.78
0.83
0.97
0.03
0.05
0.02
0.04
0.05
0.03
17.0
13.5
28.4
30.3
18.9
23.7
Apple (Golden Delicious)
Apple (Elstar)
Asparagus
Broccoli
Mungbean sprouts
Cut chicory
4
4
4
4
4
4
56.0
29.1
68.0
92.9
77.3
96.0
0.82
0.65
0.68
0.76
0.73
0.95
0.07
0.09
0.03
0.04
0.07
0.04
15.3
14.1
27.3
26.8
13.0
9.09
KmfATP
19.3
0%0 2 . Fermentative C0 2 productionatambient air,ascalculatedbymodels2,3 and
4,wasconsiderably higherthancalculatedbymodel 1(Fig.3b).Model4inparticular
gaveahighestimatedfermentation rate.Whenmodel1 wasapplied,fermentative C0 2
productionbecamenegligibleatan0 2concentrationgreaterthan0.2%(Fig. 3b).While
models 2,3and4 resulted ina maximum fermentative C0 2 production at0%0 2 , a
maximum wasnever reached bymodel 1. When theRQvalues calculated fromthe
measurements were compared withtheRQ'sderivedfromthemodels,agood visual
relation wasfound for models 2,3 and4 (Fig.3c).Thefigure also shows that the
models describeagradual increaseoftheRQwhen0 2 concentrationsare decreased,
suggesting agradual increase offermentation rates.
Discussion
The impossibility ofusing0 2 consumption models (suchasequation 1)forcalculating
C0 2 productionatlow0 2 concentrationsisunderlinedbythecurrent results.Forallthe
products considered in this article C0 2 production did not approach zero when 0 2
concentrations werecloseto0%.Thefourtestedmodels overcome this problem,but
to different degrees.Themodels canbecompared onstatistical grounds usingR2
47
Chapter 3
D =data
= model 1
= model 2
= model3
c
o
o
= model 4
T3
O
O
O
- = model 1
- = model 2
= model 3
c
o
o
. = model 4
T3
O
O
ü
• = data
= model 1
= model 2
= model 3
= model 4
O
CC
0 2 Concentration (%)
Figure3.
48
Comparison ofthefourmodelstestedondataofapplecv.GoldenDelicious. A: TotalCOs
production data and models, B: Modelled fermentative C02 production, C: RQ values
derivedfromdataandgas exchange models.
Modelling C02production
values andstandarderrors (of parameterestimates),buttheir physiological relevance
also needs to betaken into account. When considering statistical aspects, models 2
and3resultinhighercorrelationsthanmodels 1 and4.Theparameterstandarderrors
for model 2 are on the whole lower than those of model 3, except for broccoli. This
suggests aslight preferencefor model2,whenstatisticalaspects areconsidered.For
a comparison of the physiological relevance ofthe models,the parameters used are
more closely examined.
RQ0X is used to describe the ratio between oxidative C0 2 production and 0 2
consumption.An RQbased on actual measurements also includes fermentative C0 2
production. In case of fermentation being active at high 0 2 concentrations, the RQ
values derived from such measurements will tend to overestimate oxidative C0 2
production.Ontheother hand,the low RQ0Xvaluesfoundfor model4 (Table3) seem
an underestimation of oxidative processes, andmost likely resultfromthe difficulty of
simulating increasedC0 2 productionatlow0 2 concentrations usingthis model.Itwas
solved bythe statistical package byestimating a highfermentative C0 2 production at
21% 0 2 (Fig.3b).
Model 1 results in unrealistically high values for the maximum fermentative C0 2
production rate, making it inappropriate for use at 0 2 concentrations close to anoxia.
The VmfC02values of models 2,3and4 (Tables 2and 3) are closeto the datafound
on C0 2 production at low 0 2 concentrations (Figs. 1ato 2c).Therefore it seems that
VmfC02 can be used as a measure for the maximum fermentation rate when mainly
ethanol is formed, which is the case for most plant tissues (Perata and Alpi, 1993;
Ricard et al., 1994).The influence of C0 2 onfermentative C0 2 production,found for
mungbean sprouts and asparagus, was not incorporated inany of the models. Given
that a similar influence was found by Patterson and Nichols (1988) on apples, the
models should beextended.
Models 3 and 4 relate energy production to fermentation rates.The parameter used
isKmfATP, theATP production ratewhich inhibitsfermentative C0 2 productionto50%
of its maximum value. Although there is an indirect relation between ATP levels and
fermentation rates (see Material and methods), it is unclear whether ATPfluxes area
correct representation of ATP levels. In models 3 and 4 ATP production drops to 0
(model 3) or becomes very low (model 4). Normally in anaerobic situations, ATP
concentrations onlytemporarily droptovaluescloseto0(RaymondandPradet, 1980;
Trippi et al., 1989;Tesnière et al., 1994). Usingthis information, astrong increase of
49
Chapter3
fermentation (and fermentative C0 2 production) is not allowed for with the current
models. It seemsthat the highfermentation rates at low 0 2 predicted by model3and
4 cannot be explained merely by a shift from oxidative to fermentative pathways. An
increaseofthemaximumfermentative ratewouldthenbenecessary.Indeeditisfound
that at low 0 2 concentrations the synthesis of alcohol dehydrogenase can increase
(Andrewsetal., 1993;SunChenandChase, 1993,Bûcheretal., 1994),which implies
that VmfC02can also increase. Interestingly Bûcher et al. (1994) suggest that ADH
transcription istriggered directly through an oxygen-sensing system.This implies an
influence of the 0 2 concentration on VmfC02, which is described in models 1and 2.
Parameter Kmf02,usedinmodel2,describesthe0 2 concentrationwherefermentative
C0 2 production is 50%of its maximum rate. It is unclear, however, whether enzyme
kinetics are relevant indescribing the oxygen-sensing system.The parameters used
inmodel 1, aand b,arestrictly empirical anddonotdirectly describe anaspect ofthe
fermentation process.
Models 2, 3 and 4 describe a gradual increase in fermentation rates when 0 2
concentrations are lowered and even suggest a considerable fermentation rate in
ambient air (Fig. 3b). Indeed, for several products (apple, pear, strawberries, fig,
avocado), ethanol and lactic acid production has been found in ambient air (Fidler,
1933;Boersigetal., 1988;LiandKader, 1989;Colellietal., 1991;Nanoset al., 1992).
Itseemsthatfermentation isactiveunderall0 2concentrations,althoughethanol isnot
necessarily to be found due to remetabolization (Bûcher et al., 1994). Another
explanation of fermentation at relatively high 0 2 concentrations is that the models
involved the gas concentrations outside the products, whereas the actual
concentrations insidetheproductcanbeconsiderably lower.Thiscanexplainthepoor
performance of model 1, which was originally meant to incorporate internal 0 2
concentrations. The value of 10"10, used in model 1 (Banks et al., 1993), would
probably increase when external 0 2 concentrations wereused.
Inconclusion, statistical results indicate a much better performance of models 2 and
3.ConsideringthephysiologicalrelevanceofKmf02andKmfATP,nopreferencebetween
models 2 and 3 can be made. It seems that both decreased 0 2 levels and energy
fluxes attribute to increased fermentation rates. The approach used for both models
enablesthecalculationofC0 2productionratesofdifferenttypesofcommoditiesstored
under various gas conditions. This facilitates a better prediction of C0 2 conditions
50
Modelling C02production
inside storage rooms and MA packages.
Acknowledgements
The work was in part financially supported by the Dutch Commodity Board for Fruits
and Vegetables.
51
52
4
The influence of carbondioxideongasexchange ratesof
mungbeansprouts at aerobic and anaerobic conditions
H.W. Peppelenbos, L. Brien and L.G.M. Gorris
(Submitted)
Abstract
To predict gas conditions inside MA packages offresh plant products, gas exchange
models are often used.Current models describing C0 2 production of harvested plant
products do not account for an inhibition of high C0 2 concentrations on fermentation
rates, whereas such an inhibition on plant metabolism is well documented. One
existing model, based on inhibition of the alcoholic fermentation rate by 0 2 , was
therefore modified to includethis inhibition byC0 2 . Gas exchange data of mungbean
sproutswerecollected undervarious 0 2 andC0 2 concentrations and usedtovalidate
the model.Withthemodification applied,C0 2 production rateswere described better.
Although C0 2 production at low 0 2 concentrations was reduced by high C0 2
concentrations, noinfluencewasfoundonethanolandacetaldehyde levels.Thedata
found indicate large differences between gas exchange rates of different batches of
mungbean sprouts. It is suggested that microbial metabolism attributes substantially
tototal C0 2 production rates found,and might explain these differences.
53
Chapter4
Introduction
Highly perishable plant products, such as mungbean sprouts, must be kept under
specificconditionstoincreasethetimeperiodinwhichthequality remainsacceptable.
The use of MA packaging offers the possibility of reducing the 0 2 concentration and
increasingtheC0 2concentration aroundtheproduct.Alteredgasconditionsarefound
to increase the shelf-life of mungbean sprouts (Varoquaux et al., 1996), who found
optimal conditions of about 5%for 0 2 and 15%for C0 2 . Increased concentrations of
carbon dioxide can influence metabolic rates in harvested plant parts. In aerobic
conditions highcarbon dioxideconcentrations arefoundto decrease respiration rates
ofapples,broccoli,asparagus and mungbean sprouts (Fidler and North,1967;Leeet
al., 1991; Peppelenbos and van 't Leven, 1996). Under these conditions, also an
increased fermentation rate has sometimes been found, for products such as
strawberry, pear, lettuce and blueberry (Li and Kader, 1989; Ke et al., 1990; Mateos
et al., 1993; Beaudry, 1993). Under anoxic conditions, high C0 2 concentrations have
been found to decrease fermentation rates of apples (Thomas, 1925; Patterson and
Nichols,1988)butincreasefermentation ratesofsweetpotatorootsandpears (Chang
et al., 1983; Ke et al., 1993). No single explanation is known that covers all these
findings,althoughthe influence ofC0 2 onpHmayinducedifferent enzyme responses
dependent on the plant tissue affected (Shipway and Bramlage, 1973). Davies et al.
(1974) found a shift from lactic acid production to ethanol production when pH was
decreasing.ThislatterfindingindicatesthatC0 2 mayaffectthefermentative route,but
leaves unanswered whether it also inhibits the total fermentative rate as well.
Because the main fermentation route in higher plants is assumed to be leading to
ethanol (Pfister-Sieber and Brandie, 1994; Ricard et al., 1994), the lower C0 2
production at anoxic conditions can be explained as an influence of C0 2 on
fermentation rates.Foraneffectiveapplicationofalteredgasconditionsinsystemslike
Controlled Atmosphere (CA) storage or Modified Atmosphere (MA) packaging, the
relationship betweengasconcentrations andgasexchange ratesoftheproducemust
beknown.Mungbean sprouts areknowntoshowadecrease inthe C0 2 production in
response to elevated C0 2 concentrations both in ambient air and under anoxic
conditions (Peppelenbos and van 't Leven, 1996; Peppelenbos et al., 1996). At the
moment itisnot possibletocalculate gasexchange ratesof mungbean sprouts inMA
packages (Varoquaux et al., 1996). The purpose of this work was to develop a gas
exchange modelwhich incorporates the influence of C0 2 on bothoxidative aswellas
54
C02andthegas exchange rates ofmungbean sprouts
fermentative pathways.
Material and methods
Gasexchangerates
Two batches of mungbean sprouts {Vignaradiata(L.) Wilczek) were obtained freshly
harvested with a 12 days interval from a local grower and were subsequently stored
in air for three hours at 2 °C before the experiments started. Storage during the
experiments was at 8°C. Inaddition all the possible combinations of 0, 0.5, 2, 6 and
21 % 0 2 with 0 and 10% C0 2 were applied using a flow through system.
Measurements ongasexchangewerecarriedoutonthefirstbatch,whilefermentative
metabolites were measured in material from both batches. For gas exchange
measurements about 100 g of mungbean sprouts were placed in 1.5 Iflasks. Two
flaskspergasconditionwereused.Gasexchangerates,asdescribedbyPeppelenbos
andvan 't Leven (1996), were measured after 2, 3, 6 and 9 days of storage.
Fermentative metabolites
Plastic trays with 50 g of mungbean sprouts each were placed inside 65 I metal
containers.The containers were connectedtoaflowthrough system,usingthesame
gasconditions asfortheflasks with ahumidifiedflow of400 mlper hour. After 7and
10 days of storage, two trays were used for the measurement of fermentative
metabolites. To this end 15 g of mungbean was grinded (Bühler type H04) in 10ml
ofdemiwater at35000 rpmfor 1 to2minutes,untilthemixturewas homogenous.The
mixture was poured into a closed cuvette, and boiled for 6 minutes to inactivate
enzymeactivity.Afterboiling,thesampleswereplacedonicetocooldown.Thenthey
were centrifuged for 30 min at 20000 rpmat 4°C.The supernatant was filtered using
Syrfil MF 0.22 (Amfilters. One ml of sample was mixed together with 1ml a solution
containing a known amount of phenoxyacetic acid (internal standard). Lactic acid,
acetate,acetaldehydeandethanolweremeasuredbyHPLC(ShodexlonpackKC-811)
as described by Gosselink eral. (1995). Lactic acid, acetaldehyde and acetate were
assessed with UV and Rl detectors. Ethanol was measured using a Rl detector only.
Recoverytestsforthemetabolitesmentioned,carriedoutbeforeactual measurements
took place, showed a recovery above98%.
55
Chapter4
Modelling gas exchange
The experimental data on gas exchange rateswere compared with an 0 2 consumption
model and a C 0 2 production model. For 0 2 consumption, and the C 0 2 influence on 0 2
consumption, a model using a noncompetitive type of inhibition by C 0 2 (Peppelenbos
and van 't Leven, 1996) was used:
Vm,02
'02
(1)
CO,
(0 2 + Km^) * 1 +
Kmn.C02J
where V 0 2 is the actual 0 2 consumption rate (ml.kg'1.h'1), Vm 0 2 is the maximum 0 2
consumption rate (ml.kg" 1 .h 1 ), Km 0 2 is the Michaelis constant for the inhibition of 0 2
consumption by0 2 (%0 2 ), and Kmn C02 isthe Michaelis constant forthe noncompetitive
inhibition of 0 2 consumption by C 0 2 (%C0 2 ). Peppelenbos et al. (1996) gave two
models that adequately describe C 0 2 production. The one using 0 2 as an inhibitor of
fermentative C 0 2 production is used here. It includes C 0 2 produced by oxidative and
fermentative pathways:
"C02
Vmf,C02
V02 * flQox
(2)
Kmf,02
where V C02 is the C 0 2 production rate (ml.kg"1.h1), RQ0X is the RQ of oxidative
processes, Vmf C02 is the maximum fermentative C 0 2 production rate (ml.kg"1.h~1) and
Kmf 02 isthe Michaelis constant for the inhibition of fermentative C 0 2 production by 0 2 .
The influence of C 0 2 on C 0 2 production is only accounted for oxidative pathways by
the incorporation of actual 0 2 uptake in both models. An influence on fermentative
pathways, however, was not accounted for, and is introduced in equation 2 to give:
V,C02
V,02
Vmf,C02
RQr,
2
1
+
f° ]
{Kmf02j
+
( co2 \
KmfC02
where Kmf C02 isthe Michaelis constant forthe inhibition offermentative C 0 2 production
by C 0 2 .
56
(3)
C02andthe gas exchange rates ofmungbean sprouts
Statisticalanalysis
The 0 2 uptake and C0 2 production rates measured were compared with the models
describing gas exchange (equations 1, 2 and 3), using the facilities for non-linear
regression in the statistical package Genstat. The non-linear equations were fitted
directly without any transformation, using an iterative method to maximize the
likelihood. RQ0X,theRQoftheoxidativepathways,wasnotestimatedbythestatistical
package but fixed at 0.872, beingthe average RQvalue found at 0 2 concentrations
exceeding 20% (where fermentation is thought to be negligible). The concentrations
of fermentative metabolites were analyzed for significant differences by analysis of
variance (ANOVA) with Genstat as well.
Results and discussion
02 andrespiration
0 2 uptakeratesofmungbeansprouts,assessedduringa9daysstorageperiodat8°C,
were reduced only atvery low 0 2 concentrations, resulting in low Km02 values, which
were found to be ranging between 0.46 and 1.11% of 0 2 (Table 1).After prolonged
storage (longer than 3 days) 0 2 uptake showed a dramatic increase, especially at
higher 0 2 concentrations. Such an increase iscomparable to results of Varoquaux et
al. (1996) who, however, also found a decrease in 0 2 uptake after 5 days of storage
(Fig. 1).When also data used inPeppelenbos et al. (1996, not shown previously) are
compared, it is obvious that the storage period after which a strong increase in 0 2
uptake isfound canvary widely.Although these resultswerefound at 21% 0 2 , which
ishigherthanusedinMA-packages,thisvariability betweenbatchesneedstobetaken
into account for a good application of MA.
Table1. Resultsofthe regressionanalysisfor02consumption (equation1).
est = estimated value, se = standard
error,Fr = Percentagevariance accounted for (indication for the
goodnessof fit)andadi=
adjusted for thenumberofparameters.
R
M
2
adj
Vm02
Km02
Kmncœ
day 2
est
se
day 3
est
se
day6
est
se
day 9
est
se
76.2
15.9
0.77
17.6
1.5
0.30
6.7
86.9
18.1
0.46
17.3
1.2
0.13
4.5
92.3
59.9
1.11
3.49
4.2
0.25
0.82
97.6
159.8
0.96
2.44
8.6
0.12
0.40
57
Chapter4
Time (days)
Figure 1.
ComparisonofchangeinOs uptakeofmungbean sproutsstoredat ffC andin ambientair.
Data from Varoquaux et al., 1996 (*), Peppelenbos et al., 1996 (0) and current
measurements(•).
Because tissue damage was foundfrom day 6 onwards at 6 and 21 % 0 2 (data not
shown),oxidativereactionsotherthanrespirationlikelycontributedtotheincreased 0 2
uptake rates. Mungbean sprouts are knownfortheir high microbial counts at harvest,
andtherefore alsomicrobial metabolism might havecontributedtosomeextenttothe
increased gas exchange rates observed (after Varoquaux et al., 1996). A difference
in initial microbial counts could than explain the difference between the batches as
showninFig 1.Thisparameter, however,wasnotmeasuredinthecurrent experiment.
C02 andrespiration
The highest C0 2 concentration used (10%) inhibited respiration at high 0 2
concentrations (Fig. 2). When the 0 2 uptake model (eq 1) was used to quantify the
inhibition term KmnC02, values between 2.4 and 17.6% C0 2 were found (Table 1),
which is inthe range oftheaverage KmnC02(14.2)asfoundby Peppelenbos andvan
't Leven (1996). Interestingly the inhibition by C0 2 increased in importance after a
58
C02andthegas exchange rates ofmungbean sprouts
B
o
20-
c
0
0
/***
15"
°/
I°
10"
o
•
•
I*
5
0
3
6
9
12
15
18
21
I
0
12
3
15
18
21
CD
D
CO
o
Q.
o
Z3
^
—
o
90"
60-
m
9
12
15
18
21
r'
•
•
u-^-,-
0
3
6
9
12
15
18
21
O Concentration(%)
Figure2.
Measured02uptake(O=at0% C02, 0=at1O% C02) andmodelled02uptake(
0%C02,
=at
=at 10% COJ ofmungbeansproutsat various02. A: after2daysofstorage,
B: after3 daysof storage,C:after6 daysofstorage,D:after9days ofstorage.
prolongedstorage period(Table 1).Thismightbeexplainedbyanaccumulating effect
of high C0 2 concentrations, asthis gas easily dissolves inplant tissues. Onthe other
hand, it isalsoknownthat increasedC0 2 concentrations can reducemicrobial growth
andmetabolism(DixonandBell,1989;Benniketal., 1995),alsoonmungbeansprouts
(Varoquauxetal., 1996).Ifmicrobialmetabolismisconsistentlycontributingtothetotal
gasexchangeratesfound,andwithmicrobialmetabolismincreasingstronglyunderlow
C0 2 but not under high C0 2 , this could explain the decreased KmnC02 values.
59
Chapter4
C02 productionmodels
At low 0 2 concentrations C0 2 production was also decreased at the highest C0 2
concentration (Fig. 3), which confirms earlier data of Peppelenbos et al. (1996).
Fermentative C0 2 production under 0%0 2 remained equal during storage (Fig.3ato
3d). Because for most plant tissues ethanolic fermentation decreases during the first
hours ordays aftertransferfrom airtoanoxia (Ricardet al., 1994),itcouldmeanthat
formungbeansproutsthischangealreadyoccurredbeforethefirstmeasurement (day
2). After two and three days of storage, the unmodified C0 2 production model
(equation 2)accountsfor lowamounts ofthefoundvariation,with R2of41.2and47.0
(Table2).Themodification ofthe model (equation 3) increasedthese numbers.Thus
the modification improves the prediction of gas conditions inside packages when 0 2
concentrations (temporarily) drop to very low values. Remarkebly the R2 at day two
andthree,whenmetabolic rateswerecomparabletodataofPeppelenbosetal.(1996,
Fig. 1), was considerably lower than found by these latter authors when using the
same unmodified model.Maybethe lower C0 2 concentrations used by Peppelenbos
et al. (1996), 5% at maximum,contributed tothis difference.
Table 2. Resultsof theregressionanalysisfor C02production.
est = estimated value, se - standard error,P?= Percentage varianceaccounted for (indication for the
goodnessof fit)andadl=adjustedfor thenumberofparameters.
day 2
est
se
day 3
est
se
day 6
est
se
day 9
est
se
41.2
10.6
1.12
1.7
0.64
47.0
6.83
3.52
1.80
4.40
94.5
9.43
2.59
1.58
1.86
95.1
15.0
1.51
3.5
1.39
61.8
12.8
1.98
6.95
1.6
1.02
3.34
73.4
11.0
3.98
2.99
1.8
2.70
1.79
96.1
12.5
3.45
7.96
1.8
2.13
3.86
95.8
19.1
2.50
9.35
3.7
1.87
5.86
Without C0 2 inhibition (equation 2):
R adj
VmfC02
Kmf02
With C0 2 inhibition (equation 3):
R adi
VmfC02
Kmf02
KmfC02
Changeofmodelparametersintime
Gas exchange calculated with models based on enzyme kinetics suggest the
description of actual physiological processes.The useofsuch modelstodescribethe
changes in gas exchange rates intime, however, can be questioned.Although the
60
C02andthegas exchange rates ofmungbean sprouts
D
B
0
G
/D
r
"
0
p
15'
h
10- Iß
1 •
5
c
g
9
12
15
18
21
•
•
'¥
ïi
0
3
6
12
9
15
18
21
3
O
•o
D
20-
O
ü
90-
D
ay
60"
30)
f
•
•
1
9
12
15
18
21
0
3
9
12
15
18
21
O Concentration(%)
Figure2.
MeasuredCO?production(O =at 0%C02, • =at 10% COJ andmodelledC02 production
-at 10% CO?) ofmungbeansproutsatvarious02. A: after2days
:at0% CO,,
(ofstorage,B:after3 daysofstorage,C:after6daysofstorage,D:after9daysofstorage.
absolute age of mungbean sprouts stored at the various 0 2 concentrations isequal,
thisissurely notthecasewiththephysiologicalage;maturationand/orsenescencewill
be different. Nevertheless, the models better fit to data measured after a longer
storage time (Tables 1and2). It seemsthat the present models can be used wellto
describe the 'overall' metabolic processes, especially after prolonged storage. To
relate,however,predictedgasexchangeratestoactualphysiology (fermentation rates
at tissue level, energy metabolism), more processes have to be taken into account.
61
Chapter4
Talasilaetal.(1994)alreadysuggestedtodescribe Km02asKm1/2,toexpressthefact
that Kmvaluesfound at plant product level (fruit,vegetable) are notthe Kmvalues at
enzyme level due to diffusion processes. Varoquaux et al. (1996) suggested that it
couldalsobeimportanttotakeintoaccountthecontributionofmicrobialgasexchange
rates.When only gasexchange rates arecalculated orpredicted,this isnot essential
considering the good fit of the modified model. In such a case it is more relevant to
considerthechanges intime ofthe modelparameters.Theparametersfor 0 2 uptake
changesubstantiallyduringstorage(seeearlier).Theparametersforfermentative C0 2
production, however, hardly change (Table 2). Although there is some variation in
VmfC02, Kmf02 and KmfC02, the values stay within the same ranges and within the
standard errors found.This means that once fermentative C0 2 production is known,
itcan also be estimated throughout the complete storage period of a MA package of
mungbean sprouts.
Fermentative metabolites
InTable3the0 2 andC0 2 concentrationsactuallymeasuredduringthestorage period
aregiven.Whenthefermentative metabolitesarising under0%0 2 wereexamined,no
significant difference between ethanol, acetaldehyde or acetate concentrations were
found under low C0 2 or high C0 2 (Table 3).When ANOVA was repeated using C0 2
concentrationsastheonlyvariable,acetaldehydeandacetateconcentrations appeared
to be significantly lower at a high C0 2 concentration (Table 3). The influence on
acetaldehyde is the only indication found of an influence of C0 2 on ethanolic
fermentation of mungbean sprouts. The reduced acetate levels suggest a C0 2
Table 3. Concentrationsoffermentative componentsat day10.
Concentrations(mg.g1) withdifferentletters(a,b)are significantlydifferent(p<0.05).
0 2 (%)
Component
C0 2 (%)
Lactic acid
0.26 9.89
0.05
0.54
0.94
1.93
5.81
20.4
0.40a
0b
0.14b
0.10b
0b
0b
average
0.11a 0.02b
62
0.09b
0b
0b
0b
0b
0b
Acetaldehyde
0.26 9.89
0.43a
0.53a
0.63a
0.53a
0a
0a
Ethanol
0.26
9.89
0.47a
0.10a
0.14a
0a
0.02a
0a
0.35a 0.12b
1.34a
0b
0b
0.05b
0.01b
0b
Acetate
0.26
9.89
1.25a
0b
0b
0b
0b
0b
0.23a 0.21a
0.35b
0.27b
0.38b
0.77a
0.13b
0.03b
0.32a
0.23b
0.04b
0.06b
0.15b
0.03b
0.05b
0.09b
C02andthegas exchange rates ofmungbean sprouts
influence on microbial metabolism,sinceacetate isnotanabundant fermentative end
product inhigherplants (Ricardetal., 1994).At0.05%Ozconcentrations of lactic acid
werelowerwhenC0 2 wasincreased(table3).Becauseafterprolongedstorage under
anoxia the main fermentative route in plant tissues should lead to ethanol (PfisterSieber and Brandie, 1994; Ricard et al., 1994), the high lactic production again
suggests a high metabolic rate of microorganisms.
EstimationofmicrobialC02 production
Microbial metabolism ismentioned severaltimes,although itscontribution tothe total
C0 2 productionisunknown.Usingmeasurementsatanoxiaanestimationof microbial
C0 2 productioncanbemade.Thiswasdonebyrelatingconcentrations ofethanoland
acetaldehyde (innmol.g"1)atday10tomungbeanmetabolism,andacetatetomicrobial
metabolism. Usingsuchacalculation,microbial metabolismcovers 13.2%ofthetotal
C0 2 production at 0% C0 2 , and 9.34% at 10%C0 2 . Although these numbers do not
cover the difference in C0 2 production due to high C0 2 as found at the lowest 0 2
concentrations, they are surprisingly high. It underlines the need for a good
quantification of microbial metabolism.
Conclusions
The modification ofthe C0 2 production model of Peppelenbos et al. (1996) results in
an improved description of fermentative C0 2 production of mungbean sprouts.
Although C0 2 production at low 0 2 concentrations was reduced by high C0 2
concentrations, noinfluencewasfoundonethanolandacetaldehyde levels.Thedata
found showed large differences between gas exchange rates of different batches of
mungbean sprouts. It is suggested that microbial metabolism attributes substantially
to total C0 2 production rates found, and might explain the differences between
batches.
Acknowledgements
Partofthis work was supportedbythe EuropeanCommissionthroughcontract AIR1CT92-0125. The authors wish to thank R. Gosselink for helping with the HPLC
analysis.
63
64
5
A method for the simultaneous measurement of gas
exchange and diffusion resistance under various gas
conditions
H.W. Peppelenbos, W.K. Jeksrud
1996, Acta Hort, (in press)
Abstract
Amethodwasdevelopedformeasurements ofmetabolic gasexchange ratesandgas
diffusion resistance in apples simultaneously, under various gas conditions. For this
purpose the trace gas neon was selected. In closed flasks containing apples in a
specific gascondition,neonwasaddedsoastobringitspartialpressureupto 110Pa.
Changes intheoxygenandcarbondioxideconcentrations wereusedtocalculate gas
exchange rates, and the decrease in neon concentration was used to calculate gas
diffusion resistance. Resistance values have been compared with data from the
literature, and estimations values of gas diffusion of 0 2 and C0 2 were made.
65
Chapter5
Introduction
The use of Modified Atmosphere Packaging (MAP) and Controlled Atmosphere (CA)
storage systems for fruits and vegetables is focused on so called optimum gas
concentrations, i.e. gas conditions which positively affect quality and shelf-life. Fruits
canbeconsideredasMApackagesthemselves,withaninternalatmosphere different
in composition from the external atmosphere (Dadzie et al., 1993). Internal gas
concentrations are determined by gas exchange rates and the resistance to gas
diffusion.Although optimalgasconcentrations are relatedtotheexternalatmosphere,
the actual metabolic processes occurring in plant tissues are more relatedto internal
concentrations. Changes ingasexchange ratesand/orthe resistancetogas diffusion
in stored products will influence the internal concentrations, also when external
concentrations remain closeto optimal values. Forfuture applications inCA storage,
like dynamic control systems where storage conditions react on product physiology,
knowledge about these changes is needed to provide truly optimal external gas
concentrations.ThisknowledgewillalsobeusefulindevelopingMApackagesnotonly
designed to provide optimal concentrations, but also to keep the gas concentrations
within certain limits.
To determine the relationship between the time change of gas exchange rates and
diffusion resistance,bothshouldbemeasuredonthesamefruitorvegetable,because
diffusion resistance shows large variations between individual fruits of the same
species and cultivar (Banks, 1985; Rodriguez et al., 1989). A method is needed
enabling this simultaneous measurement under various gas conditions without
influencing the product. The use of non-influencing measurements enables repeating
the measurements intime. Changes of both gas exchange and diffusion resistance,
and their influence on optimal storage conditions, can then be monitored. A good
method of determining diffusion resistance is to measure the efflux of a trace gas
(ethane) from the fruit some period after the fruit was loaded with the gas (Cameron
and Yang, 1982; Knee, 1991). This method, however, cannot be combined with gas
exchange measurements under various gas conditions, because gas exchange
measurements need a period of time to let the product adjust to the gas conditions.
Oneoptiontoavoidpreloadingistostartwithproductsalreadyadjustedtovariousgas
conditions, andthen add atrace gas in order to measure the flux of the gas into the
product. This latter option is addressed inthis study.
66
Measuringgas exchange anddiffusion resistance simultaneously
Material and methods
Forthe measurement of agasflux intothe productthetrace gas neonwasselected,
as it was easy to detect on the gaschromatograph (GC) used. Also, neon does not
interfere with ethylene peaks, as was the case with ethane. Neon is an inert gas,
present in normal air in a concentration of 18.18 ppm (Greenwood and Earnshaw,
1984).
Produceinformationandstorage conditions
Three cultivars of apples (Malus domesticaBorkh.) were used: 'Golden Delicious',
'Elstar' and'Cox'sOrange Pippin'.'Golden Delicious'washarvestedon27September
1993and stored in airfor4weeks at 1°C.'Elstar' was harvested on31August 1993
and stored in air for 9 weeks at 1 °C. 'Cox's Orange Pippin' was harvested on 8
September 1993 and stored in air for 9 weeks at 1°C. Several gas conditions were
appliedtothe apples.Acompletefactorial designwas usedwithallthe combinations
ofthefollowing gas concentrations: 0,0.5, 1, 2,6and21 %0 2 and 0and5%C0 2 in
two replicates, resulting in 24 apples per cultivar. After 4 and 5 days under the
mentioned gas conditions gas exchange and neon afflux were measured.
Measurementsofgas exchangeandneonafflux
The method of Baumann and Henze (1983) was used to establish product weight,
product volume and the internal gas volume (V) of each individual apple. A small
amount of grease was put on the floral end of the apple to avoid a possible flow of
water (during the underwater measurements) or air (during the measurements of
diffusion resistance) into the central cavity. The apples were placed in 1.5 L flasks
containingsmallventilators inapieceofPVCpipethatsupportedtheapple.Theflasks
were connected to aflow through system to achieve various gas conditions.
Temperature was controlled and recorded every 15minutes (Vaisala HMP31 UT).In
allexperiments thetemperature was 18-19°C(s.e.was0.4°C,seeTable 1).Thegas
entering eachflask was humidified,resulting inarelative humidity closetosaturation.
After closing of the flasks, 1.5 ml of neon was added into each flask resulting in an
initial partial pressure close to 110 Pa. The air in the flasks was mixed by the
ventilators for 30 seconds. Then the ventilators were stopped (to prevent a local
increaseintemperature),andthefirstmeasurementongasconcentrationswascarried
67
Chapter5
out. In total 5 measurements were made, and each measurement consisted out of
three samples.The exact time ofthe measurements after closing oftheflasks was 1,
19,37, 127 and289 minutes.After thefifth measurement the flasks were connected
againto the flow through system.
Table 1.Produce information.
weight=average weightofmeasuredproducts(andstandarddeviation),volumeisthemeasuredtotalapple
volume,internal volumeiscalculated.
Cultivar
Golden Delicious
Elstar
Cox's Orange Pippin
Temperature
weight
gram
apple
volume
ml
internal
volume
ml
resistance
for neon
s.mm"1
°C
19.0
19.6
19.5
168.4 ±13.1
147.1 ±10.1
165.4 ±13.2
216.0 ±16.9
186.0 ±12.5
199.6 ±16.9
56.7± 5.8
46.3 ± 3.3
42.6 ± 4.9
408 ±136
780 ±167
665 ± 240
Thesampledgaswas leddirectlyfromtheflaskstoagaschromatograph (Chrompack
CP 2001). Neon,0 2 and N2were measured on a Molsieve A column (T = 60°C, p =
110.3 kPa),and C0 2 and ethane were measured on a Hayesep Acolumn (T=60°C,
p = 81.4 kPa).The carrier gas was helium. For every sample 1.2 mlwas taken from
theflasks, sothetotal amount of airtakenfromtheflasks was 18 ml,which resulted
in a pressure drop of 1.38 kPa in the flasks. Concentrations were corrected for
pressure loss. Forcalculations ofthegasconcentrations thesecondandthird sample
were used.Gas exchange rateswere calculated usingthe concentration differences
betweenmeasurements 1 and4(timedifference 127minutes).Thefreevolumeofthe
flasks (V0) was calculated by subtracting the calculated apple volume the measured
volumes of the ventilator and the PVC pipe from the measured flask volume. The
atmospheric pressure was measured (Druck PDCR 930) to correct for changes in
atmospheric pressure, andto convert gas concentration (% or ppm) to Pa.
Calculationof diffusion resistance
The process described is the diffusion of trace gas from the free volume inthe flask
outside the apple (V0) to the free gas volume inside the apple (Vi). The resistance
valueobtainedisanestimateoftheoverallresistancetogasdiffusionofskinandflesh
of an apple. Diffusion can be described with Fick's first law (Burg and Burg, 1965;
Cameron and Yang, 1982):
68
Measuringgas exchange anddiffusion resistance simultaneously
ds _ (CO - C,) * A
dt '
R
(1)
where ds/dt isthe rateofdiffusion (ml.s"1),Risthe resistancecoefficient (s.cm1),Ais
thesurfaceareaofthetissue (cm2),C0'istheconcentration outsidethetissue(ml.ml"1)
andC;'theconcentration insideattimet.TheapplesurfaceAwascalculatedfromthe
apple volume, assuming the apple to be a perfect sphere (after Knee, 1991). The
diffusion rate can also be described by (after Cameron and Yang, 1982):
* = V0*{^)
dt
° K dt'
(2)
where V0 is the free volume of the flask and dC0 the change in concentration in the
free volume. When the total amount of trace gas in the flask (a closed system) is
constant, and Viis not neglected,the following istrue:
V, * Cf' + V0 * C? = C? * {V, + i g
(3)
where Vi=the internalvolume of an appleand C0,=~=Concentration of neon at time
= °°(equilibrium concentration). Equations 2and3canbesubstituted intoequation 1,
resulting inthe nextequation:
dt
R * Vj*vo
When equation 4 is integrated from time 0totime t,the next equation wasobtained:
A .(v,-> vy
' * R . V, . V.
= CT-( C -o * e
(5)
with t = the time period after start of the experiment (s). With the concentration
measurements available Rcan becalculated:
-t * A * (V, +
v,* v0
*Ln
C
°
Vè
(6)
c'*0
69
Chapter5
Results and discussion
The exact neon concentrations applied and the external and internal volumes
measured differed per apple. The resistance values found differed widely between
individual apples: the minimum and maximum values found were 1.93*103 and
7.06*103 s.cm"1for 'Golden Delicious', 4.96*103 and 11.9*103 s.cm"1 for 'Elstar', and
2.75*103 and 12.0*103 s.cm"1 for 'Cox'. When the average resistances of the three
applecultivarswerecompared,thevaluefor'Golden Delicious'appleswaslowestand
for'Elstar'appleshighest (Table 1).Togetherwithachangeinneonconcentration,the
respiratory gases were measured.0 2 uptake rates (Fig. 1)and C0 2 production rates
(not shown) were established. The highest 0 2 uptake rates were found for 'Golden
Delicious' apples, andthe lowest for 'Elstar' apples (Fig.1).
•
<p
Ü
•
Q.
H
co
+
D
•
D
O
O
•
o
Q.
« Ï
=3
+
O
+
+
-É+
Q
D
0 2 Concentration (kPa)
Figure 1.
Oxygenuptakerates(mlSTP.kg'.h'1) of'GoldenDelicious'<D), 'Elstar'(+)and'Cox'sOrange
Pippin'(<>) applesatseveral02 concentrations (kPa).C02 concentrationis ± 40Pa.
For a general view of the resistance measurements the values were averaged per
apple cultivar (Table 2). The total change in neon concentration found in the
experiments was about 4 Pa, which is about 4% of the initial concentration (Fig.2).
The measured accuracy of the GC on neon was 0.42 Pa at neon concentrations
equivalent to 110 Pa. The total change in neon found was 12times larger than this
accuracy. For future applications ofthis method it will be usefulto increase the initial
70
Measuring gas exchange and diffusion resistance simultaneously
concentrations, or reduce the volume outside the apple (V0). With the measured
external volume (V0), the calculated internal volume (V;) and the measured neon
concentration atthe start oftheexperiment (Nestart),the expected neon concentration
at the end of the measurement (Neend) can be calculated. This calculated Neend was
higher than the actually measured Neendfor all three apple cultivars (Table 2). Three
factors can attribute to this result: the diffusion of neon into the water phase of the
apples,leakage of neonoutoftheflasks and/or asystematic experimental error. First
diffusion of neon into the water phase wascalculated.
Table 2. Summary of the measurements on neondiffusion intothe products.
V0 =freevolumeoutsidetheapple(ml),V,=internalgas volume(ml), 'neon'referstoneon concentrations
(Pa).
Variable
v0
V,
neonstart measured (a)
neonend measured (b)
neonendcalculated (c)
neonaq (d)
c-d-b
accuracy
Cultivar
Golden Delicious
Elstar
Cox's Orange Pippin
1309
56.7
118.1
112.4
113.2
0.14
0.66
0.42
1339
46.3
109.4
105.4
105.7
0.11
0.19
0.42
1325
42.6
109.8
106.0
106.4
0.13
0.27
0.42
With the value for the solubility of neon in water of 10.5 ml.1"1 (Greenwood and
Earnshaw, 1984),the weight of the apples used and the value for the percentage of
water in apples (Knee, 1991),the maximum amount of neonthat can dissolve inthe
waterphase(withanatmosphereof 100%neonaroundtheapples) canbecalculated.
Whenthisamountisrelatedtotheexpectedneonconcentration (thecalculatedNeend),
the decrease ofthe neon dueto diffusion intothewater phasewas calculated (Neaq).
This Neaqwasonlyaminorcontributiontothedecreaseof neoninthevolume around
the apple (Table 2).After correcting the calculated Neendfor Neaq it still exceeded the
measured Neend. Forthe measurements ontwo applecultivars, 'Elstar' and'Cox',this
difference was less than the accuracy of the GC, and can therefore be ignored. For
theexperimenton'GoldenDelicious'leakageprobablycontributedtotheconcentration
difference found. In equation 3 the total amount of gas in the system is assumed
constant. When leakage occurs, this assumption is no longer true and the equation
71
Chapter5
cannot be used.The leakagefound (calculated) inthe experiments isconsidered too
small to influence the resistance values found, and can therefore be neglected. It
remains important, however, for a good functioning of equation 3, to eliminate all
leakages inclosed systems.
The data on gas exchange (Fig. 1) are comparable to those obtained on days
preceding the current measurements (Peppelenbos and van 't Leven, 1996). This
impliesthatthemeasurement of respiratorygasexchange hasnotbeeninfluencedby
the methodof measuringthe neonflux.Toevaluatethe resistancevaluesfound,they
have to be compared with datafrom the literature. For 'Golden Delicious' and 'Cox's
Orange Pippin' apples literature data are known (Table3).
Table 3. Comparing literature andexperimental data on diffusion resistance.
Method: 1 =Ethanefluxoutoftheproduct, 2=gassamplingofatubegluedonthesurface,3=fluxofneon
into theproduct, Ris ethaneandneonresistance values.
Apple cultivar
Source
Method Age Temperature Rel.Humidity Resistance
(days) (°C)
(%)
(s.mm')
low
high
Golden Delicious Banks (1985)
1
Knee (1991)
1
Data found here
3
Cox's Orange P. Rajapakse et al. (1990) 2
Knee et al.(1990)
1
Datafound here
3
±7
?
31
?
?
19.0
3
20
35-80 3.3
66
19.5
?
?
>95%
?
?
>95%
970 205
560
760
193 706
594
980
151
275
120
The highest resistance values found here for Golden Delicious and Cox's Orange
Pippin are comparable to those found in literature. The lowest values, however, are
considerably different.Thesignificanceofthesedifferences isunclear,especially after
comparing the circumstances under which the measurements were made. In earlier
experiments the temperature has been lower (Knee et al., 1990) or not been given
(Banks,1985;Knee,1991).Therelativehumidity,whichcaninfluencethevaluesfound
for diffusion resistance (Lidster, 1990), has also not been given. Because the apples
used in the experiments found in literature also have different ages, and because
diffusion resistanceofapplescanchangeovertime(Solomos, 1987;Parketal., 1993)
it isclearthat onlyacomparison oftheorderof magnitude ismeaningful,which isthe
case here. The neon afflux method seems a good method for measuring diffusion
resistances. Its advantage is that it can easily be combined with gas exchange
72
Measuringgas exchangeand diffusion resistance simultaneously
measurements. One has to take into account that the produce to be measured should
have a considerable internal volume (V;) compared to the volume surrounding the
product (V0) for a large enough decrease in neon concentration to be measurable.
One disadvantage of using ethane instead of neon for the measurement of diffusion
resistances, in addition to a possible influence of ethylene concentrations on the
ethane measurements, is that ethane production is found in ageing plant tissues.
Ethane production is commonly associated with membrane damage and cell death,
and is increasedwith increasing injuryof planttissues (Abeles et al., 1992). Particularly
ra
o.
c
o
o
ü
o
CD
0
50
100
150
200
250
300
Time(min.)
Figure2.
Typicaldecreaseoftheneonconcentrationin theflaskin time.Measurementson thesame
apple ofcv.GoldenDelicious, at day4 IP) andday5(M).
when research is focussed on a relation between changes in diffusion resistance in
fruits during storage and the onset of storage disorders, this ethane production may
influence the measurements.
After deriving resistance values for neon diffusion in plant tissues, and for ethane
diffusion as well, it is important to know the relation to resistance values for 0 2 and
C0 2 . This issue was not addressed by Cameron and Yang (1982) or Knee (1991).
Banks (1985) suggests that ethane diffusion is probably similar to 0 2 and ethylene
diffusion. Using Graham's law predictions on the relationship between the diffusion of
73
Chapter5
the various gases can be made. Based onthis law one would expect diffusion rates
of 0 2 , ethane and ethylene to be comparable, but neon diffusion rate to be 18%
higher and C0 2 diffusion rate to be 20% lower (Table 4). The diffusion routes,
however,of neon,ethane,0 2 andC0 2 arenotnecessarily equal(Banks, 1985),which
makesthe use of only Graham's lawsuspect. Arealcomparison of resistance values
is necessary, andforthis purpose one mightcombine the methodof Rajapakse et al.
(1990) andthe ethane (Cameron and Yang, 1982) or neonmethod.
Table 4. Diffusion rateof metabolic gases ascomparedtoethane and neon using Graham's law.
Carbon dioxide
Oxygen
Ethylene
Ethane
Neon
Ethane
Neon
0.799
0.937
0.966
1
1.176
0.679
0.796
0.821
0.850
1
Acknowledgements
We gratefully thank Mr. Johan van 't Leven for his assistance in doing the
measurements on gas exchange and diffusion resistance.
74
6
Functioning of gas exchange models using external and
internal gas concentrations ofthree apple cultivars
H.W. Peppelenbos, W.K. Jeksrud
Abstract
Basedongas exchange ratesanddiffusion resistance, internalgas concentrations of
apple cultivars Golden Delicious, Elstar and Cox's Orange Pippin were calculated.
Internal 0 2 concentrations were2.3 kPa lowerat anexternal 0 2 concentration of 20.7
kPafor Golden Delicious apples, and about 4.5 kPa lower at 20.1 and 20.4 external
0 2 for Elstar andCox's apples respectively. Internal C0 2 concentrations substantially
exceedednormalexternalconcentrationsof50Pa.TheKmvaluesfoundforthethree
apple cultivars remained significantly different when internal instead of external
concentrationswereused.Thisindicatesthattheapplecultivarsmeasureddonotonly
show biophysical differences (resistance, porosity), but also differences at the
biochemicallevel.ForGoldenDeliciousapplesnodifference inmodelfunctioningwas
found when internal or external concentrations were used. Incontrast, for Elstar and
Cox's Orange Pippinapplesthe0 2 uptakeandC0 2 production models showed better
results (expressedas R2)whenfittedonexternalconcentrations. Itisarguedthatthis
might be explained by the experimental setup. For instance the internal 0 2
concentration of Cox's Orange Pippin calculated at the optimal external 0 2
concentration (1.2%) reached 0.085%. A small change of 0.1%in an external 0 2
concentration closeto 1%thereforecanchangetheinternalatmospherefromhypoxia
to anoxia,which cannot be regarded as an equilibrium situation.
Theconclusionto bedrawn isthat alsoforexperimentalsetups,where often different
temperatures are used, some precalculations using gas exchange and diffusion
75
Chapter6
resistanceswillhelptooptimizethemethods.Theselowinternalconcentrations,based
on data found at 18°C, also confirm the ideathat optimal 0 2concentrations increase
when temperature isincreased.
Introduction
Instudies onthe storage offruits under ControlledAtmosphere (CA) conditions often
an emphasis is laid on the role of diffusion characteristics of the fruits. Dadzie et al.
(1993) suggestedthat quality changes of afruit stored underchanged gas conditions
canprobably bebetter relatedtotheinternalthentotheexternalconcentrations.More
and more it becomes clear that it is necessary to know the concentrations inside the
fruit (andatthecell level) todevelop physiological explanations ofthe modeof action
of CA storage (Knee, 1991b). Due to metabolical processes in combination with
diffusion resistances,the 0 2 concentrations insidefruits arealways lowerthanthe 0 2
concentrationssurroundingthem.Knowledgeof0 2diffusion isneededforstudyingthe
oxidases that may be involved infruit respiration, but alsofor predicting minimum 0 2
levels that can be safely used in CA storage (Solomos, 1987).
Incontrastto internal0 2 concentrations, internal C0 2 exceedexternalconcentrations.
Varietaldifferences insusceptibilitytoC0 2 injurycouldpossibly resultfromanatomical
rather than biochemical differences (Burton, 1974). Burton (1974) was aware though
that not only resistance or permeability define optimal storage conditions, but the
combination ofpermeability,gasexchange ratesandinternalgasvolumes.Simplified,
fruits can be regarded as Modified Atmosphere (MA) packages (Dadzie, 1993), with
the skin and flesh (Rajapakse et al., 1990) resembling the permeable film, and the
internal gas volume resembling the free volume inside the package.
In the past years most authors describing gas exchange in relation to 0 2
concentrations prefer a Michaelis-Menten type of equation, as it describes the
enzymatic rate of 0 2 uptake inplanttissues (Cameron et al., 1995). Itwas mentioned
by Chevillotte (1973) that diffusion resistances can influence the type of relationship
found between gas exchange rate and gas concentrations. So far, however, the
equations usedarebasedongasconcentrations outsidethefruit.Yet,itisthe0 2 level
inside the product that limits respiration rates (Cameron et al., 1995). This paper
therefore focusses on the functioning of known equations when internal instead of
externalconcentrations areused.Bycombiningthemodelledgasexchange rateswith
76
Internalgas concentrations and functioningofgas exchange models
diffusion resistances, internal gas volumes and advised optimal (external) gas
concentrations,the internal gasconcentrations ofthree applecultivars arecompared.
Material and methods
Internalconcentrations
Thegasconcentrations inthe intercellular spacecan be regarded asanestimationof
the intracellular gas concentrations ifthe resistance to gas diffusion infruits is mainly
attributed tothe skin ofthefruit.Although significant resistances of skintissues have
beenfound(Rajapakseetal., 1990),especiallyinfruitswithhighinternalgasvolumes,
like non-climacteric apples, concentration gradients within the intercellular air space
should be negligible (Kays, 1991).
To establish the intercellular gas concentrations ('internal concentrations'), the gas
exchange rates andthediffusion resistance ofthree applecultivars (Malus domestica
Borkh.,cv Golden Delicious, ElstarandCox'sOrange Pippin) weredetermined,using
the method described by Peppelenbos and Jeksrud (1996). The experimental setup
andthecharacteristics ofthefruitsarealsogivenbyPeppelenbosandJeksrud(1996).
Withthe external oxygen (02) concentrations, gas exchange rates andthe resistance
to gasdiffusion,the internal0 2 concentrations can beestimated using Fick'sfirst law:
where [02\ = the internal 0 2 concentration (umol.cm"3), [0 2 ] e = the external 0 2
concentration (umol.cm3), V02=the0 2 uptake rate (umol.g"1.s1), m=the massofthe
fruit (g),r02= the resistance to 0 2 diffusion (s.cm"1), and A is the surface of the fruit
(cm2).Internalcarbondioxide (C02) concentrationswerederivedinacomparableway:
[cou,-[«u. . "+ « • » • ' «
(2
>
where [C02]; =the internal C0 2 concentration (umol.cm'3), [C02]e =the external C0 2
concentration (umol.cm"3), VC02 = the C0 2 uptake rate (umol.g"1.s1), and rC02= the
resistance to C0 2 diffusion (s.cm1). The resistance to 0 2 and C0 2 diffusion were
derivedfromtheresistancetoneondiffusion,usingGraham's lawtoconvertto0 2 and
77
Chapter6
C0 2 resistance.Theinternalandexternal0 2concentrationandthegasexchangerates
were calculated from kPa or ml to nmoles using the ideal gas law. The actual
temperature and pressure measured during the experiments were used for this
conversion.
Gasexchange models
Totestgasexchangemodels gasexchange rateswerefittedwiththeexternalandthe
calculated internal concentrations. Two gas exchange models were used. 0 2 uptake
rates were fitted using an 0 2 consumption model without inhibition by C0 2 , because
this inhibition was not found on the apple cultivars used (Peppelenbos and van 't
Leven, 1996):
V„
'02 -
Vm 2
° *°*
(3)
Kmoz + 0 2
where 0 2 = the external or internal 0 2 concentration, V02 = the 0 2 uptake rate (ml.
kg"1.h"1),Vm 02 =the maximum 0 2 uptake rate (ml.kg"1.h1) and Km02= isthe Michaelis
constantfortheinfluence of0 2 onthe0 2 uptake rate.C0 2 productionwasfitted using
one of the models given by Peppelenbos et al. (1996):
Vmf,
C02
Sc02 = Vf» * flO-
(4)
1
+
Kmf02
where RQ0X is the RQ value for oxidative processes, VmfC02 is the maximum
fermentativeC0 2 production rate(ml.kg"1.h1),andKmf02theMichaelisconstantforthe
inhibition of fermentative C0 2 production by 0 2 . The data were compared with the
models usingthefacilities for non-linear regression inthe statistical package Genstat
(release 5). The 0 2 consumption and the C0 2 production were fitted directly without
anytransformation,usinganiterativemethodtomaximizethelikelihood.Bycombining
the modelledgasexchange rateswithdiffusion resistances, internalgasvolumes and
advisedoptimal (external) gasconcentrations,theinternalgasconcentrations ofthree
apple cultivars are compared.The optimal external 0 2 concentration used was 1.2%
for all apple cultivars (Meheriuk, 1993).
78
Internalgas concentrations andfunctioningofgas exchange models
Results
After measuring gas exchange ratesand diffusion resistance the internal0 2 and C0 2
concentrations perindividualapplewerecalculated.Forequalexternal concentrations
the values were averaged, and are shown Table 1. For external C0 2 concentrations
close to ambient conditions the relation between external 0 2 concentrations and
internal0 2 andC0 2 concentrations isshowninFig 1. Thedifference between internal
andexternal0 2 concentrations washighest athigh0 2 concentrations,duetoahigher
respiration rate. Reduced C0 2 production rates also accounted for the lowest
differencebetweeninternalandexternalC0 2concentrationsat0 2concentrationsclose
to2%.
(0
0-
A
g
ra
y
/
o
+
O
ra
+
c
S
c
jf* «
ra
B
CL
>
+
o
o
ra
c
CD
o
0
+
?
O
o
> «
+
G
+
+
Ü
o |
D
0
External 0 2 concentration (kPa)
Figure 1.
Internaiconcentrations relatedtoexternal02 concentrations(inkPa at 0%external C02,
D = GoldenDelicious, += Elstar, 0=Cox'sOrangePippin).A: 02concentrations, B: C02
concentrations.
79
Chapter6
Whentheapplecultivarsarecompared,thesmallestdifferences betweenexternaland
internal concentrations were found for Golden Delicious apples (Table 1). Due to
increased C0 2 production at 0 2 concentrations approaching anoxia,the internal C0 2
concentrations found attheseconditions werecomparable toconcentrations found in
ambient air. The highest internal C0 2 concentrations were found for Cox's Orange
Pippin apples (Table 1). For Cox's Orange Pippin apples the estimated internal 0 2
concentrations approached 0 or were negative (Table 1). This indicates that the
methods used become unreliable when 0 2 concentrations become as low as 0.5%.
Table 1. Externaland internal02and C02concentrations.
Average valuesofmeasuredexternal(Ex)andcalculatedinternal(In)concentrationsof Golden Delicious,
Elstarand Cox's Orange apples.
Golden Delicious
Elstar
Cox's Orange Pippin
o?
o2
co2 co2
Ex
In
o2
o,
co2
co2
o2
0.08
0.43
1.56
2.88
7.46
20.67
0.03
0.10
0.95
2.16
6.42
18.39
0.52
0.25
0.23
0.28
0.63
0.81
2.67
1.21
1.43
1.29
1.89
3.56
0.09
0.48
1.42
2.84
7.53
20.14
0.04
0.14
0.41
1.83
5.23
15.64
0.39
0.28
0.26
0.21
0.30
0.47
3.71
3.21
2.61
2.09
3.42
6.20
0.08
0.00
0.33 -0.22
1.37
0.47
2.77
0.88
7.50
4.81
20.37 15.84
Ex
In
Ex
In
Ex
In
Ex
o2
In
co 2
co2
0.84
0.58
0.32
0.51
0.45
0.66
6.51
4.34
1.81
3.99
4.13
6.56
Ex
Thegasexchange models werefitted usingdataofeachindividual apple.ForGolden
Deliciousapplesnodifferenceinmodelfunctioningwasfoundwheninternalorexternal
concentrations were used (Table 2). In contrast, for Elstar and Cox's Orange Pippin
applesthe0 2 uptakeandC0 2 production modelsshowedbetter results(expressedas
R2) whenfittedonexternalconcentrations insteadofinternalconcentrations (Table2).
The change of the parameters of the 0 2 model was comparable for all three apple
cultivars: Vm02 and Km02 values decreased when internal 0 2 concentrations were
used.TheparametersoftheC0 2productionmodelreacteddifferentlyonusinginternal
concentrations. The RQ0X values did almost not change when internal or external
concentrations were used.Kmf02values decreased for allthree apple cultivars when
internalconcentrations were used,indicating an increase inthefermentation rateata
lower 0 2 concentration. Remarkable isthe high estimatedvaluefor VmfC02 of Golden
Delicious when internal concentrations were used,while the VmfC02 of the other two
cultivars remained almost the same. The measured gas exchange rates and the
80
In
Internalgas concentrations andfunctioningofgas exchange models
modelling resultsfor Golden Delicious apples areshown in Fig2, usingboth external
andinternalconcentrations.Thecurverepresentingthemodellingresultson0 2 uptake
shifts to lower 0 2 concentrations when using internal 0 2 concentrations, but remains
almostthesame(Fig.2A).ThisisnotthecaseforC0 2 production (Fig.2B),wherethe
fittingprocedure results inalowerminimumC0 2 production.The RQvalues basedon
dataandmodelsalsoshiftto lower0 2 concentrationswhen internal0 2 concentrations
are used (Fig.2C).
Table 2. Modellingresults.
Resultsoftheregressionanalysisfor02consumptionandC02productionusinginternal(Intern)andexternal
(Extern)concentrations.R2 = Percentagevarianceaccountedfor, est = estimated values,se = standard
error,Vm02= maximum02 consumptionrate (ml.kg'.h'), Km02 = Michaelisconstant, Vmfœ2=maximum
fermentativeC02 productionrate(ml.kg'.h'1), Kmf02 = Michaelis constant).
O, model
R2
Vm02
Golden D.
Intern
Extern
Elstar
Intern
Extern
Cox's O.P.
Intern
Extern
est
se
est
se
93.0
est
se
est
se
81.0
est
se
est
se
69.9
93.5
91.5
88.0
Km02
C0 2 model
Ft2
RQo,
23.66
2.85
25.03
3.15
5.11
1.61
7.17
2.14
91.2
16.84
3.71
18.15
2.92
5.34
2.94
8.76
3.14
75.6
15.16
2.13
18.98
2.29
0.55
0.34
3.25
1.18
64.9
92.5
87.7
85.5
VmfC02
Kmf02
1.037 23.4
0.043 21.5
1.024 18.91
0.044 5.16
0.027
0.026
0.128
0.077
1.069 14.42
0.067 2.34
1.033 13.17
0.050 1.07
0.148
0.066
0.616
0.159
1.079 14.58
0.084 1.33
1.102 21.56
0.053 2.41
0.170
0.088
0.329
0.108
After combining average values for porosity and diffusion resistances with calculated
gas exchange rates at 1.2%0 2 (by using the fitted equations), internal 0 2 and C0 2
were derived (Table 3). For both Golden Delicious and Elstar apples the internal 0 2
concentrations were close to half the external concentration,while their internal C0 2
concentrations accumulated to three and seven times the external values. The
estimated internal 0 2 concentration of Cox's Orange Pippin apples was as low as
0.085% (Table 3), suggesting almost anoxia inside the apples at optimal outside 0 2
concentrations. The estimated internal C0 2 concentration of Cox's apples was the
highest of the three cultivars, also indicating highfermentation rates.
81
Chapter6
H
CO
I
S
Q.
H
co
D
•D
O
O
ü
O
er
0
3
6
9
12
15
18
21
0 2 Concentration (%)
Figure2.
Gas exchange of Golden Delicious apples. Measurements related to external
concentrations (U) and to calculated internal concentrtaions (D). Models fitted using
external concentrations (
) and internal concentrations(
STP.kg'.h'), B: C02 uptake(mlSTP.kg'.h'), C: RQ.
82
) . A: 02 uptake (ml
Internalgas concentrations andfunctioningofgas exchange models
Discussion
Thecalculatedinternal0 2concentrationsofGoldenDeliciousandElstarapplesstored
in0 2 concentrations closetoambient air, 18.4and 15.6kParespectively, correspond
to found internal concentrations of other apple cultivars. Measured inambient air the
internal0 2concentrationsofKingEdwardVIIandStürmerPippinrangedbetween17.9
and 18.9% (at 12 °C, Kidd and West, 1949), of Stayman apples at 23 °C between
12.7% and 14.8%, of Rome Beauty, Mcintosh and Gala apples between 17.2 and
19.8% (at 15 °C, Solomos, 1987). Internal 0 2 concentrations of Braeburn apples
measured directly under the skin was 11.7% and 10.6% at the center of the fruit (at
20°C,Rajapakse etal., 1990).The internal0 2 concentrations ofCox's orange Pippin
applesmeasuredinambientair(15.8kPa)areclosetovalues reportedbefore.Internal
0 2 concentrations found range between 16.1% (at 12°C, Kidd and West, 1949) and
15.1% directly under the skinto 14.8%atthe center ofthefruit (at 20°C, Rajapakse
et al., 1990). Based on Graham's law the same value for the resistance for neon
diffusion will result in different values for 0 2 and C0 2 diffusion (Table3).
Table 3. Estimatedinternalgas concentrations at an optimalexternal02 concentrationof1.2%.
porosity in %,resistance(R.)ins.crrf',concentrations in kPa,02 uptakeand C02 productionin
ml STP.kg'.h'.
Cultivar
Porosity R.
R.
neon 0 2
Golden D.
Elstar
Cox O. P.
26.2
24.9
21.4
3917
8456
6265
R.
C0 2
4920 5770
10620 12455
7869 9228
[02]
out
[C02] o 2
co 2
[02]
out
uptake production in
[C02]
in
1.23
1.21
1.22
0.463 3.64
0.323 2.19
0.571 5.05
1.35
2.56
3.28
5.59
6.71
10.2
0.739
0.591
0.085
Theestimated internal C0 2 concentrations of Golden Delicious and Elstarapples (3.6
kPa and 6.2 kPa respectively), based on gas exchange rates and these resistance
values,werealsocomparabletovaluesreportedbefore(at21%0 2external).Reported
internal concentrations range from 1.8to 2.5% for King Edward and Stürmer Pippin
apples (Kidd and West, 1949), 0.93 to 3.25 %for Gala, Mcintosh and Rome Beauty
apples and 6.3 to 8.1%for Stayman apples (Solomos, 1987). The internal C0 2
concentration inambient airfoundforCox's appleswas6.6 kPa,which is higherthan
the 3.9% found by Kidd and West (1949). These authors, however, conducted their
experiment at a lower temperature (12°C). This likely resulted in a lower respiration
83
Chapter6
rate andconsequently a lower internal C0 2 concentration. Basedonthese values for
internal concentrations it can be concluded that the method used, based on a
combinationofneondiffusionandGraham'slaw,resultsincomparableresultsasother
methods. Elstar and Cox's Orange Pippin apples showed the largest difference
between external and internal concentrations (Table 3), but this was to be expected
since both cultivars show higher resistance values incombination with lower porosity
than Golden Delicious apples.
Table 2 and 3 show high standard errors and deviations, indicating large variance
between individual apples. Also Knee (1991b), in a survey of Cox's Orange Pippin
apples from different orchards, found that all possible combinations of high and low
respiration and high and low resistance can occur. This variability of plant material
prevents precise control of intercellular atmosphere; it seems that recommended
atmospheres can be designed only to avoid completely anaerobic conditions and a
harmfullevelofC0 2 inthecenteroftheleastpermeableindividualfruit (Burton,1974).
The gas exchange models currently known, like equations 3 and 4, are based on a
description of enzyme kinetics.One simplification ofthe models isthatthe calculated
gas exchange ratesare relatedto0 2 concentrations intheairaroundafruit,whilethe
actual 0 2 concentrations at the (modelled) enzyme level are much lower. This
difference resulted in lower Kmvalues for 0 2 uptake andC0 2 production for allthree
apple cultivars when internal concentrations were used. For this reason Chevillotte
(1973) suggested to use the term Kmex when external concentrations were used,to
show that the Kmvalues cannot be attributed to enzyme functioning directly.
TheKmvaluesfoundforthethreeapplecultivars remainedsignificantly differentwhen
internal instead of external concentrations were used.This indicates that the apple
cultivars measureddonotonlyshowbiophysicaldifferences (resistance,porosity),but
alsodifferences atthebiochemicallevel. ThereforethestatementofBurton(1974)that
differences betweenapplevarieties insusceptibilityto C0 2 injury couldpossibly result
from anatomical rather than biochemical differences' hasto be reconsidered.
Chevillotte (1973) concluded that the single enzyme model isthe only representation
which leadstoasatisfactory studyatthecytochromeoxidase-oxygen reaction levelin
vivo,when possible changes brought about by diffusion are taken into account. The
lower Km values found when internal concentrations were used can indeed be
attributed to diffusion limitations. A worse functioning of the models when internal
concentrations of Elstar andCox's Orange Pippin apples are used,ismore difficult to
84
Internalgas concentrations andfunctioningofgas exchange models
understand. The first thing to argue is the correctness of the resistance values. As
stated before,these values are based on Fick's law, assuming one main barrier for
diffusion: the fruit surface (skin). When also the fruit tissue has a considerable
resistance to gas diffusion, it invalidates such an approach (Knee, 1991b). From
research by Rajapakse et al. (1990) it isknownthat diffusivity infleshtissues mustbe
takenintoconsideration.Neverthelessthepercentageofthetotal0 2 gradient between
the external atmosphere and the internal core cavity caused by flesh in apples was
relativelysmall:4.5%inCox'sOrangePippinand11%inBraeburnapples(Rajapakse,
1990).Thisindicatesthatthevaluesfoundforthethreeapplecultivarsinchapter5are
likelytobeclosetotheoveralldiffusion resistancetogasdiffusion.Forproducts other
thanapplesthecontributionofflesh resistancecanadd upto30%inAsianpearsand
56%innectarines (Rajapakseetal., 1990).Thisindicatesthatboththeethaneandthe
neon method cannot be simply applied to all types of commodities. Another
explanation for the worse model behaviour, and the unreliable internal 0 2
concentrations of Cox's apples (Table 1), might be the experimental setup. Using
headspace techniques to quantify gas exchange rates,the assumption was that gas
exchange rates were in equilibrium with gas concentrations. With gas concentrations
changing0.3%atambientairand0.1%maximallyat0 2 concentrations lowerthan5%,
this assumption seems correct. When, however, the internal 0 2 concentrations were
calculatedatoptimalexternal0 2concentrations (Table3),theinternal0 2 concentration
of Cox's Orange Pippin apples was 0%. A small change of 0.1% in an external 0 2
concentration close to 1% therefore could change the internal atmosphere from
hypoxia to anoxia. That surely cannot be regarded as an equilibrium situation. The
conclusion to be drawn is that also for experimental setups, where often different
temperatures are used, some precalculations using gas exchange and diffusion
resistances will help to optimize the methods.
With respect tothe low internal concentrations asgiven inTable 3, it hasto be noted
that the optimal (external) concentration used (Meheriuk, 1993) was given in
combination with low storage temperatures, whereas the current experiment used
18°C.Thisconfirmstheideathatoptimal02concentrationsincreasewhentemperature
isincreased,asreportedbyBeaudry etal. (1992)for blueberry andJoiesetal. (1994)
for raspberry fruit.
85
86
7
RespiratorycharacteristicsandcalculatedATPproduction
of apple fruit in relation to tolerance to low 0 2 concentrations.
H.W. Peppelenbos, R. Rabbinge
1996, J. Hort. Sei., 71 (5): (in press)
Abstract
The applicability of respiratory characteristics to determine optimal 0 2 concentrations
forthestorageofappleswastested.Acomparisonwasmadebetween gas exchange
rates of apples directly after harvest and after a period of storage. Apples of three
harvest dates were used. Optimal 0 2 concentrations were based on gas exchange
dataandgasexchange modelsfittedonthedata,usingtheAnaerobic Compensation
Point (ACP) and the Respiratory Quotient Breakpoint (RQB). A third way was
comparing total ATP production with estimated maintenance energy requirements,
revealing the Maintenance Oxygen Concentration (MOC). ATP production was
calculatedusinggasexchangemodels.MOCwasdefinedastheoxygenconcentration
with the minimal ATP production rate necessary for maintaining cell viability. The
optimal 0 2 concentrations as established by ACP, RQB and MOC differed
considerably. Because ACP values differed from normally advised values, the ACP
was unsuitableforaquick determination oftheoptimal 0 2 concentration oftheapples
used. The RQB, however, might be suitable, but than the limit used to establish the
RQBshould bemorethan0.5 units higherthanthe RQmeasured inambient air.The
ACP and the RQB were decreased to lower 0 2 concentrations after storage,
suggesting optimal concentrations to decrease during storage. In contrast the MOC
was increased after storage, which is in agreement with results found in practice.
87
Chapter7
Model calculations indicated the lowest optimal 0 2 concentration for the second
(optimal) harvest usingtheACP,the RQBandtheMOC.Itissuggestedthat research
on the relationship between Maintenance Energy Requirements and cell injury will
clarify an important part ofthechanges inoptimal 0 2 concentrations (orthetolerance
to low 0 2 concentrations) during ageing or maturation of harvested plant tissues.
Introduction
In the Netherlands the majority of the picked apples are stored under Controlled
Atmosphere (CA) conditions. For apples, and other harvested plant products, it is
found that lowering the 0 2 concentration in the surrounding atmosphere leads to a
slower maturation and senescence (Kader et al., 1989). When 0 2 concentrations
become to low, disorders like browning and necrosis of tissues are found. Therefore
the main focus in the research of the storage of apples, and other harvested plant
products, isthe establishment ofthetolerance to low 0 2 concentrations. The 'optimal
0 2 concentration' is considered the concentration where maturation is reduced the
most without the occurrence of disorders which can be related to low 0 2
concentrations.These optimal0 2 concentrations differ betweenspecies,cultivars and
varieties (Kader et al., 1989),andcanevendiffer betweenyears forthe same variety
(Stow, 1989). Experiments to establish optimal 0 2 concentrations are based on trial
and error and are time consuming (Wollin et al., 1985; Gran and Beaudry, 1993).
Conclusions can be drawn after the storage period, revealing the optimal
concentrationsofthepastyear.Thequestiontheniswhethertheseconditionsarealso
valid in the years to come. A quick method has potential to determine optimal 0 2
concentrations before storage of the product. Wollin et al. (1985) suggested the use
ofgasexchangecharacteristicsforestablishingtheseconcentrations.Theyhypothised
that minimal 'respiration' (C0 2 production) couldcorrespondto maximum storage life.
Thiswas alsosuggested by Boersiget al. (1988),who introducedtheterm Anaerobic
Compensation Point (ACP),defined asthe0 2 concentration where C0 2 production is
minimal.LateralsotheRespiratoryQuotientBreakpoint(RQB)wasintroduced,defined
asthe0 2 concentration wherethe RQisincreasing rapidly (GranandBeaudry, 1993).
Boththe ACP andthe RQB arethought to be usefulforthe establishment of optimal
0 2 concentrations. Boersig et al. (1988) found a change in the ACP when pear fruit
was ageing.At the moment it is unknown whether a change in the ACP orthe RQB
can be relatedto a change in optimal 0 2 concentrations.
88
CalculatedATP andlowO-, tolerance
Both the ACP and the RQB are based on the premiss that fermentation is directly
relatedto disorders found inplant products stored at low0 2 concentrations. Often an
0 2 concentration isconsideredoptimalwhen0 2 consumption isminimizedwithoutthe
development of fermentation (Banks et al., 1993; Gran and Beaudry, 1993). On the
other hand fermentation is also believed to occur so plant cells can meet their
requirements forATP (Good and Muench, 1993; Fox et al., 1994).TheATP required
tokeepanaerobictissuesaliveisgeneratedinfermentation processes (Pfister-Sieber
and Brandie, 1994). For flooded plants it is found that a minimum ADH activity is
required to survive even short periods of anoxia (Kennedy et al., 1992). Recently the
maininjuries inplanttissuesoccurringduringanoxiaarerelatedtochanges inenergy
metabolism (Pfister-Sieber and Brandie, 1994). Although fermentation is highly
inefficient compared to respiration, fermentation can be regarded as 'just' another
source for ATP. Instead of focusing on the 0 2 concentration where fermentation is
ceasing, the total ATP production of both respiration andfermentation might also be
a measure for the tolerance to low 0 2 concentrations. Based on this concept, it is
unimportant which metabolic route (oxidative orfermentative) isprovidingthe energy,
as long asthe sum of both routes covers Maintenance Energy Requirements (MER).
MER is defined here asthe minimal ATP production to maintain cell viability.
Optimal concentrations based on actual fruit characteristics could probably help to
avoidstorage losses. Forthis purpose the usability of respiratory characteristics, and
modelsdescribingthesecharacteristics,weretested.Gasexchangecharacteristicsof
Cox Orange Pippin apples of three harvest dates, carried out directly after harvest,
were examined. Optimal gas concentrations were estimated using the ACP and the
RQB.ThesevalueswerecomparedwithanestimatedtotalATPproduction,basedon
modelsdescribing0 2consumptionandC0 2 production.Gasexchangerateswerealso
measured after a period of storage,to examine possible changes in ACP, RQB and
ATP production duringstorage.
Materials and methods
Gasexchange measurements
Gas exchange measurements were carried out on apples (Malus domesticaBorkh.,
cv.Cox's Orange Pippin) directly after harvest andafter aperiodof storage underCA
conditions. Apples ofthree harvest dates were usedtocompare apples with different
89
Chapter7
maturity.TheselectionoftheharvestdateswasbasedonthemethodofStreif (1983),
resulting inan early harvest (9September 1994), a harvest with apples of a maturity
considered to be optimal for storage (16 September 1994) and a late harvest (23
September 1994). At the days of harvest part of the apples was put in CA storage.
Storage conditions were standard Dutch CA conditions (1°C, 1.2% 0 2 , 2% C0 2 ).
Another part of the apples was used for gas exchange measurements. These latter
apples were placedinflasks connectedto aflow through system andwere subjected
to 0, 0.5, 1, 2, 5 or 21% 0 2 in combination with 0.1% C0 2 . Per gas condition four
apples were individually measured. The temperature used for measuring was 18°C,
and the relative humidity was close to saturation (97-99%). After two days at these
conditions gas exchange rates were measured twice per day, and the values were
averaged. 0 2 consumption rates and C0 2 production rates were measured by the
methoddescribedby Peppelenbos andvan't Leven(1996).After 140daysof storage
gasexchangemeasurementswererepeatedontheCAstoredapples,usingthesame
gas concentrations.
Gasexchangemodels
Oxygen uptake was calculated using a model without inhibition of oxygen uptake by
carbon dioxide (Chevillotte, 1973):
'02
Km02 +Q>
where V02 is the 0 2 consumption rate (ml.kg"1.h1), Vm02 is the maximum 0 2
consumption rate(ml.kg"1.h1),0 2 isthe0 2concentration(%) andKm02istheMichaelis
constant for the influence of 02on the 0 2 uptake rate (% 0 2 ). C0 2 production was
calculated usinganadaptedversion ofthemodelgiven byPeppelenbos etal. (1993),
which combines C0 2 produced by oxidation and fermentation processes:
Vcos = V02 * RQm
+
Vmf,
C02
! nO.2 \
KmfOZj
where VC02 is the total C0 2 production rate (ml.kg'1.h1), RQ0X is the RQ value for
oxidative processes, VmfC02 is the maximum fermentative C0 2 production rate (ml.
90
(2)
CalculatedATP and low02tolerance
kg"\h"1), and Kmf02 the Michaelis constant for the inhibition of fermentative C0 2
production by 0 2 . The RQ, necessary for establishing the RQ Breakpoint, was
calculatedbydividingthefitfoundfortheC0 2 productionmodelbythefitfoundforthe
0 2 uptakemodel.Bothgasexchange modelswerefittedonthedatausingthefacilities
for non-linear regression inthe statistical package Genstat.
Determinationofoptimal02 concentrations
Toassessoptimal0 2concentrationsbothmeasuredandmodelledgasexchangerates
of apples of the three harvest dates were used. Optimal 0 2 concentrations were
estimated usingtheACP (the0 2 concentration where C0 2 production isminimal) and
the RQB(the0 2 concentrationwhereRQisincreasing rapidly).Becausethedefinition
of the RQB is inadequate for a model showing a gradual increase of the RQ with
decreasing 0 2 concentrations (equation 2),the definition was more specified. In this
paperthe RQB isconsideredthe0 2 concentration wherethe RQexceeded aspecific
limit: 0.5 units higher than the RQ measured in ambient air. This limit value was
chosen because aRQashighas1.5isstillregardedasbeingsafeforstorage (Wollin
et al., 1985). By using gas exchange rates the total ATP production at various 0 2
concentrations can beestimated (Andrich et al., 1994).Theoxidative ATP production
(VATP(0), umol.kg~1.h"1) was derived from the 0 2 consumption rate (equation 1,V02 in
ml.kg"1.h"1) using a conversion factor based onthe ideal gas law:
VATf\o)
t
(3)
V02 * 6 * 41.87
where41.87 (umol.mr1) isthe conversion factor (at 18°Cand 101.3 kPa) and6 isthe
ATP/02 ratio. It is assumed that the production of ethanol and C0 2 is the main
fermentation route (Perata and Alpi, 1993; Ricard et al., 1995). Therefore the
fermentativeATP(VATP(f))productionwasderivedfromthefermentativeC0 2 production
(second term in equation 2):
V>
ATP(t)
Vmf,
C02
41.87
(4)
Kmf,
02/ J
91
Chapter7
B
16-
m12"
//
8-
B
Q.
z>
o
CM
t/
4-
0 2 Concentration (%)
Figure 1.
The02 consumption (ml.kg'.h1) data (O = after harvest,• = after storage) and fitted
models(
=afterharvest,
=afterstorage). A: first(early) harvest,B:second
(optimal)harvest,C:third(late) harvest.
92
CalculatedATP and low O? tolerance
Processes involved for maintaining cell viability are often referredto as maintenance
(Thornley, 1970), and the energy needed for maintenance as maintenance energy
(Pirt, 1965) or maintenance requirement for ATP (Zhang and Greenway, 1994).
Maintenance energycanberegardedasthelowestATPproduction ratenecessaryto
maintain cell viability. The 0 2 concentration where all energy production is used for
maintenance is referred to as the Maintenance Oxygen Concentration (MOC). The
estimated totalATP production,thesum of the calculated oxidative and fermentative
ATP production, was compared with a specific limit value (Maintenance Energy
Requirements).The0 2concentrationwheretheATPproductionequalledthevaluefor
MERwasconsideredtobetheMOCandanestimatefortheoptimal0 2concentration.
AtthemomentnovalueforMERisknown.ThereforetheATPproductionrateat1.2%
0 2 (the advised optimal storage condition for Dutch apples, Meheriuk, 1993) at the
optimal harvest data (harvest 2) was used as a reasonable estimation of MER.
Results
The results of the gas exchange measurements and the fitting of the models are
shown in Fig. 1 (0 2 consumption), Fig. 2 (C0 2 production) and Fig. 3 (RQ). The
percentage of the variation accounted for (R2) of the 0 2 consumption model ranged
between 91.5 and 97.8% (table 1).
Table 1. Regressionanalysisof02 consumption and C02 production data.
F?=Percentagevarianceaccountedfor(indicationforthegoodnessoffit)andatf/=adjustedforthenumber
ofparameters,est= estimatedvalues, se=standarderror.
Harvest 1
start
est se
storage
est se
Harvest 2
start
est
se
0 2 Consumption
R2
93.9
Vm02
12.2 1.1
Km02
3.78 0.89
96.4
13.5
5.83
CO, Production
R2
RQ„„
Vmfc02
Kmf02
80.4
1.08 0.09
13.2 2.4
0.136 0.073
69.7
0.860 0.099
15.6 1.5
0.722 0.217
1.1
1.33
97.8
15.1
3.00
storage
est
se
0.71
0.40
84.4
0.06
1.01
21.4
1.4
0.503 0.098
91.5
16.3
2.74
Harvest 3
start
est se
1.6
0.81
96.4
1.01 0.03
11.8 0.7
0.273 0.048
94.7
24.3
7.85
est
storage
se
2.8
2.07
94.4
15.3
4.37
68.9
0.945 0.120
26.2 2.8
0.712 0.222
1.4
1.09
93.5
1.00 0.05
18.6 1.4
0.152 0.035
93
Chapter7
B
20"
<
'o>
i
m
15"
c
g
,_-^=-^
3
T3
O
10J
O
ü
5-
0 2 Concentration (%)
Figure2.
TheC02production(ml.kg'.h') data(O=afterharvest,• =afterstorage)andfittedmodels
(
=afterharvest,
=afterstorage). A: first(early) harvest, B:second(optimal)
harvest, C:third(late) harvest.
94
CalculatedATP and low02tolerance
The modelling results for the C0 2 production model were less, specially for the
measurements directly after harvest,with R2rangingbetween68.9 and96.4 (table 1).
Different values for the model parameters were found for the different harvest dates
andstorageperiods (table 1). The0 2consumptionratemeasureddirectlyafterharvest
inambient air (21%0 2 ) increasedwithharvest date(Fig.1).The0 2 consumption rate
measureddirectlyafterharvestwascomparabletotheratemeasuredafterthestorage
periodforboththeearlyandthe'optimal'harvest (Fig.1a, 1b).Forthelateharvestthe
0 2 consumption rate measured in ambient air was decreased after storage (Fig. 1c).
The Kmvalues for 0 2 consumption (Km02) were lowest for the optimal harvest (table
1).This was found directly after harvest aswell as after the storage period.
Themeasurement oftheC0 2 productionalwaysshowedatypical lowest rateatalow
0 2 concentration, enabling the establishment of the ACP (Fig. 2). For apples of all
three harvest dates the maximum fermentative C0 2 production rate (VmfC02),
established usingthe C0 2 production rateat0%0 2 , wasdecreasedafterthe storage
period (table 1). This was also the case for Kmf02, the 0 2 concentration where
fermentative C0 2 production reached 50%of its maximum rate. All the RQ0X values
found were close to 1, except for the apples of thefirst harvest directly after harvest
where RQ0Xwas 0.86 (table 1).Basedongasexchange datathevalues foundfor the
ACP and the RQB were almost equal (table 2). Model calculations almost always
resulted inconsiderably higher0 2 concentrationsforthe RQBthantheACP (table2).
Interestingly the ACP and the RQB, based on data as well as the models, almost
always decreased to lower 0 2 concentrations after storage, suggesting optimal
Table 2. Estimatedoptimal02 concentrations forstorage(in%).
ACP = Anaerobic Compensation Point, RQB = Respiratory Quotient Breakpoint, MOC = Maintenance
OxygenConcentration.Data: valuesderivedfromgas exchangedata,Model:valuesderivedfrommodel
calculations.
Harvest 1
Harvest 2
Harvest 3
data
model
data
model
data
model
ACP
start
storage
RQB
start
storage
2.18
2.76
2.17
1.86
2.02
2.68
0.41
0.82
0.80
0.62
0.86
0.94
1.65
2.71
2.17
2.61
2.02
3.65
1.76
1.45
0.80
1.11
0.86
1.38
MOC
start
storage
2.40
3.74
1.19
1.20
1.53
2.21
95
Chapter7
j
B
10:
occ
à
1-
^ ^
»- ^
—_
0 2 Concentration (%)
Figure3.
96
=after
TheRQdata(O=afterharvest, M=afterstorage)andfittedmodels(harvest,
=afterstorage). A:first(early) harvest, B:second(optimal) harvest, C:
third(late) harvest.
CalculatedATP andlow02tolerance
concentrations to decrease during storage (Figs 2 and 3). In contrast the MOC
increased after storage for apples of thefirst and the third harvest date (Fig.4,table
2). Only for the second harvest date the MOC remained equal (table2).
When the three harvest dates were compared, optimal oxygen concentrations as
derived with the ACP and the RQB are almost equal (based on the gas exchange
data).Themodelcalculations,however,indicatedaloweroptimal0 2 concentrationfor
the second harvest using the ACP, the RQB and the MOC. This expected higher
tolerance of apples of the second harvest to low 0 2 was found directly after harvest
and after storage.
Discussion
The 0 2 concentrations supposed notto be injurious differ considerably when derived
bytheACP,the RQBorthe MOC.Assuming one 0 2 concentration to be injurious for
apples of the same harvest, a conclusion is that these concepts are not valid
simultaneously.Tohavemoreclarityonthevalidityoftheconceptstheyareexamined
moreclosely.Twopracticalaspectsofusingrespiratorycharacteristicsareconsidered:
a. the use of gas exchange measurements directly after harvest as an indicator for
(fixed) gasconcentrations duringstorage, b.the useof gas exchange measurements
during storage as atoolto change storage concentrations.
Meheriuk gives an optimal 0 2 concentration of 1.2%for the storage of Cox Orange
Pippin apples grown inthe Netherlands. Apples picked in 1994 and stored commercially atthis 0 2 concentration showed goodquality after storage.Therefore 1.2%can
be considered a good storage concentration for apples of this particular year. The
optimalconcentrationsderivedfromthemeasurementsdirectlyafterharvest,however,
are always higher than 1.2% 0 2 (table 2). Only the MOC of apples of harvest 2 is
equal, butthis isdueto definition used (seematerial and methods). Byadjusting limit
values for the RQB and the MOC lower 0 2 concentrations can be derived.The limit
used to establish the RQB should be more than 0.5 units higher than the RQ
measured inambient air. Basedon Fig3.thelimitwouldapproximately be3.6forthe
first harvest, 2.8 forthe second harvest and 3forthethird harvest. These RQvalues
are considerably higher than the RQ's of Gran and Beaudry (1993), who used RQ
values between 1.5 and 2, dependent on the number of data available. Remarkably
the RQvalues found by Gran and Beaudry (1993) at high 0 2 concentrations (10-15
97
Chapter7
T3
O
O.
1-
<
12
15
18
21
0 2 Concentration (%)
Figure4.
The ATP production (mmoles.kg'.h') derived from the models (
harvest,
= after storage,
second (optimal) harvest.C:third(late)harvest.
98
= after
= limit/ MER).A: first (early)harvest,B:
CalculatedATP andlow02tolerance
kPa) are also close to 1.5, which differs from the data found in the current
measurements. The different temperature during the gas exchange measurements
(1°Cfor Gran and Beaudry, 1993) might bethe cause of the differences found.
The RQBseems usefulfor aquick determination ofthe optimal 0 2 concentration,but
a more clear definition of the RQB is required. The MOC was set at 1.2% 0 2 by
definition. Therefore the use of the MOC can only bejudged when measurements of
several years result in comparable values (and storage results). The ACP is directly
derived from a graphical representation, and cannot be modified by adjusting limit
values.C0 2 productioncanonlybelowestatone0 2concentration.TheACPtherefore
seems unsuitable for a quick determination of the optimal 0 2 concentration of the
apples used.
Itisknownthatapplesofdifferent harvestdateormaturity reactdifferentlytothesame
0 2 concentrations (North et al., 1977, Blanpied and Silsby, 1989; Curry, 1989). After
storingCoxOrange Pippinapples ofthree harvest datesat 1.25%0 2 , Northetal.first
noticed internal disorders (brown tissue) inthe late picked apples. Based on current
gas exchange characteristics different optimal0 2 concentrations werefound between
thedifferent harvest dates. Ingeneraltheestablished optimal 0 2 concentration of the
second(optimal) harvestisthelowest(table2),suggestingthehighesttolerancetolow
0 2 concentrations. This result underlines the possible use of gas exchange
characteristics in establishing optimal 0 2 concentrations.
Optimal 0 2 concentrations, as derived by ACP, RQB and MOC, seem to change in
time. One practical aspect of changing optimal 0 2 concentrations is that a fixed 0 2
concentration for storage will not be the best procedure. One solution could be
dynamic control of storage concentrations (Wollin et al., 1985). When respiratory
characteristics are to be used for this purpose, changes in the derived optimal
concentrations should correspond to changes in optimal concentrations found in
practice.The optimal 0 2 concentrations established byACP and RQBwere found to
change to lower values after storage. The MOC, however, changed to higher 0 2
concentrations,indicatingadecreasedtolerancetolow0 2afterstorage.Onlythislatter
result agrees with resultsfoundinpractice.Lidster etal. (1985)foundthatthestorage
of Mcintosh apples forthree months at 1% 0 2 andsubsequently in3%0 2 resulted in
lowerlowoxygeninjuryandsenescentdisorderlevelsthenapplesstoredcontinuously
at 1% 0 2 (more injury) or3%0 2 (more disorders). Comparable results werefoundby
Little and Peggie (1987). Kader et al.(1989)statethat the limit oftolerance to low 0 2
99
Chapter7
would be higher than advised if storage duration is increased. This suggests a
decrease of the tolerance to low 0 2 concentrations and an increase of optimal 0 2
conditions.
Wollin et al. (1985) assumed that if the product is kept at the 0 2concentration with
minimal C0 2 production (equaltotheACP),no low0 2 injurywasto befound.The 0 2
concentrationshouldbecontinuouslymonitoredandadjustedifnecessary.Considering
the data found the ACP is changing indeed, but to other 0 2 concentrations than are
expected to be beneficial. Usingthe ACP orthe RQBfor dynamic control could lead
to severe problems. A combination of gas exchange rates and models which enable
the calculation of ATP production might reduce that risk.
According to Pfister-Sieber and Brandie (1994) changes intolerance of plant tissues
to low 0 2 concentrations is probably a matter of minor changes in metabolic rates.
Based on maintenance energy requirements (MER) two hypothetic explanations can
be given for this change. The first explanation is that metabolic rates decrease,
especially the fermentative rate, leading to a lower ATP production rate at a low 0 2
concentration. The second explanation is that MER is not constant, but possibly
increases during storage, leading to a shortage of ATP at low 0 2 concentrations. In
bothcasesthestorage offruit ataconstant low0 2 concentration leadstoanincrease
of injury levels.The decrease infermentative rate after storage (Fig.2), leading to a
decrease in ATP production at low 0 2 concentrations (Fig. 4), supports the first
hypothesis if a constant value for MER is assumed. Consequently an increased
fermentation rate(orglycolyticrate;Pasteureffect)wouldincreaseATPproductionand
tolerance to low 0 2 . This latter phenomenon is observed by Waters et al. (1991),
studying root apices of wheat. In this paper Maintenance Energy Requirements are
assumed to be constant at varying 0 2 concentrations (Fig.4). Zhang and Greenway
(1994) calculatedthat maintenance energy requirements underanoxiaare lowerthan
in air.They assumed, however, that the plant tissue they studied used all the energy
producedfor maintenance, irrespective ofgasconditions. Itisunclear, however, ifthe
divisionofenergy usebetweengrowthormaintenance inthiscaseissufficient. Apples
after harvest do not show 'growth', but do show processes related to ripening
(maturation) which require energy. Infact the basis of the storage under low oxygen
concentrations offruitsandvegetables isthat ripening isreduced(Kader et al., 1989).
A situation without growth is not necessarily a situation with only maintenance.
100
CalculatedATP and low02tolerance
Therefore itisproposed that total ATP production (VATP) isdescribedas:
V
ATP =
V
ATPW
+ V
ATf\o +
V
Airw
(5)
where VATP(g)= ATP production used for growth, VATP(r)= ATP production used for
processes related to ripening, VATP(m)= ATP production used formaintenance of cell
viability. TheMERlevel used in this paper, is based on VATP(m) only, andcanbe
referred toastheminimum ATPproduction necessary to maintain cell viability.We
hypothise that more research on the relationship between maintenance energy
requirements and cell injury will clarify animportant part ofthechanges intolerance
to low0 2 concentrations (oroptimal0 2 concentrations) duringageingormaturationof
harvested plant tissues.
101
102
8
Alcoholic fermentation of apple fruits at various
oxygenconcentrations.
Model prediction andphotoacousticdetection.
H.W. Peppelenbos, H. Zuckermann, S.A. Robat
Abstract
Apples (MalusdomesticaBorkh.,cv. Elstar)werestoredatvarious0 2 concentrations,
ranging between normoxia and anoxia. Gas exchange rates and the production of
acetaldehydeandethanolweremeasured.Agasexchangemodel,whichdistinguishes
oxidativefromfermentative C0 2 production,wasfittedtothedata.Theresults indicate
alcoholic fermentation to be active at all the 0 2 concentrations used, and increasing
in importance when 0 2 concentrations are lowered. After calculating the amount of
metabolites intheappletissuefromthedatameasured inair,acloserelationshipwas
found between model predictions of alcoholic fermentation rates and measured
metabolite production in normoxia and anoxia. In hypoxia, however, the model
predictedhigherC0 2 production ratesincomparisontothemetabolitesactuallyfound.
BecausethemodelwasfittedtoC0 2 productiondata,thisindicatesanothersourcefor
C0 2 in hypoxia than alcoholic fermentation.
103
Chapter8
Introduction
Higher plants are aerobic organisms and need oxygen to survive (Perata and Alpi,
1993).When plant tissues are exposedto low oxygen concentrations also anaerobic
processesarefound.Thedurationofsurvivalofplantorgansunderanoxiavariesfrom
afew hourstoseveraldays (Ricardetal., 1994).TheATP requiredto keepanaerobic
tissues alive is generated in fermentation (Pfister-Sieber and Brandie, 1994). Active
fermentation is thought to be restricted to hypoxia and anoxia only. Therefore
fermentation is often described as an on/off process: the absence of oxygen results
in a switch from respiration to fermentation (Perata and Alpi, 1993), fermentation
usually starts with lactic acid formation (Pfister-Sieber and Brandie, 1994), and a
change in pH is triggering the switch from lactic acid production into ethanolic
fermentation (Fox et al., 1995).
Despitesomedebateontheroleof lacticacidinthispHshift,ethanolisalmostalways
found in plant tissues under hypoxia or anoxia (Perata and Alpi, 1993). Sometimes
ethanol is also detected in plant tissues kept in air. In the headspace ethanol was
foundfor muskmelonseeds (PesisandNg,1984)andtobacco leavecultures (Bûcher
et al., 1994; Yang et al., 1995). Also acetaldehyde, the precursor of ethanol, is
detected around fruits, seeds and leaves kept in air (Thomas, 1925; Pesis and Ng,
1984; Yang et al., 1995). Ricard et al. (1994) explain this phenomenon by (partial)
hypoxiawithinthesetissues,becauseoxygendiffusionwashamperedbyawaterlayer
(leave culture), impermeable coats (germinating seeds) or bulky tissues (fruits).
Nevertheless it is not clear yet whether fermentation is functional under aerobic
conditions, or at what level of hypoxia it becomes so (Ricard et al., 1994).
When Peppelenbos et al. (1996) developed models to calculate C0 2 production of
harvested plant tissues stored undervarious 0 2 concentrations, they included aterm
for alcoholic fermentation.The models usedfittedwellto experimental gas exchange
data, but alsosuggestedthatfermentation is always active,albeit at low rates at high
0 2 concentrations.Becausethisseemsincontrastwithcurrent knowledge,itisunclear
whether these models are actually describing alcoholic fermentation.
The evidence for ethanol or acetaldehyde production in ambient air greatly depends
onthe sensitivity ofthe detection method(Ricardet al., 1994).Measured inthe head
space by GCtechniques the lower concentration foundby Kimmererand MacDonald
(1987) for ethanol and acetaldehyde was 0.05 ng.ml"1, while the lowest detectable
production found by Pesis and Ng (1984) was 1umol.g"1for ethanol and 13nmol.g"1
104
Alcoholic fermentationofapplefruitsat various02concentrations
foracetaldehyde,and2nmol.g"1forethanolandacetaldehyde byBûcheretal.(1994).
Recently, in addition to GC techniques, also laser driven techniques were used to
measure volatiles in air (Woltering et al.1988; Harren et al., 1990).The use of these
latter techniques enabled a much lower detection limit for ethylene.
The focus of this paper was to apply this latter technique for the measurement of
ethanol and acetaldehyde of apples stored under various gas conditions. The data
found were compared with one of the models describing oxidative and fermentative
C0 2 production (Peppelenbos et al., 1996).
Material and methods
Gasexchange measurements
The product selected for the experiment was apple (Malus domestica Borkh., cv.
Elstar).Theharvest ofthe(preclimacteric)applestook placeinseptember 1995inthe
Netherlands. After three months of storage under Controlled Atmosphere conditions
(1°C, 1.2% 0 2 and 0.5% C02) the apples were placed in air tight flasks. The flasks
were connected to aflow through system.
Six different 0 2 concentrations, in3 replicates,were providedtothe apples:0,0.5, 1,
2, 6 and 21% supplemented with N2.The gas mixtures applied contained no argon.
The C0 2 concentration was kept below 500 ppm. The gas was ledthrough a water
flask, resulting in a relative humidity close to saturation (above 98% r.h.).The flasks
were kept in atemperature controlled room,with atemperature of 20°C. After three,
fourandfivedays underthe mentionedconditions gasexchange measurements were
carriedout asdescribed inPeppelenbos andVan't Leven(1996).Inthemethodused
theflasks are closed,and relative small changes in 0 2 and C0 2 are monitored. After
thegasexchange measurements (lasting2hours)theflaskswereconnectedagainto
the flow through system. After 4 and 5 days of storage 6flasks were kept in closed
condition after the gas exchange measurements, in order to carry out head space
analysis of ethanol and acetaldehyde. These 6 flasks were no longer used for gas
exchangemeasurements, resulting 12flasksmeasuredatdayfive.Thegasexchange
measurements were repeated with 18 other apples one week after the first
measurements.
105
Chapter8
Acetaldehyde andethanolmeasurement
Ethanol and acetaldehyde were detected using a photoacoustic (PA) detection
technique. Details onthetechnique are described by Harren et al.(1990) and Bijnen
(1995). The main device used isaCO-laser,whichenables aconversion of radiation
into acoustic energy. The laser is line tunable over a large infrared frequency range
(350 lines between 1200 to 2100 cm"1), where many gasses show a specific
'fingerprint' absorption. Via collisional relaxation,the excited molecules transfer their
vibrational energy to translational energy, which results in a pressure increase. The
laser radiation is modulated at a frequency of about 1kHz by a chopper so that the
gasabsorption isgeneratingaperiodic pressuremodulation:asound.The absorption
cell (PAcell) isbuiltasaacoustic resonatortooptimally sustainthis periodic pressure
modulation. A condensor microphone mounted at the anti-node of the resonator
detects the sound.The PA cell is placed insidethe CO-laser cavity to profit from the
oneorderofmagnitudeincreaseinlaserpowerascomparedtoanextracavityposition.
A multi component analysis of the gas in the headspace of the apple cuvette was
performed bytuningthegratingto5specific laser linesandmeasuringthe PAsignals
which are proportional to the absorption (after normalization to the intracavity laser
power).Theabsorptioncoefficientsofacetaldehyde,ethanolandwatervapouratthese
laser lines were determined beforehand. The concentrations of these gasses were
calculated using the mathematical formalism of Meyer and Sigrist (1990), involving
matrix manipulation. Concentrations were corrected for background concentrations
found at the start of every measurement. A full cycle of positioning the grating and
measuring on 5 lines took about 5minutes.
Headspace gas of theflasks containing the apples was brought intothe PA detector
byflushing itwith pure N2of0.5 liter/hour. To reducethe influence ofwatervapouron
the measurements acoolingtrap andteflontubing (FEP) were usedforthe gasflow.
Stable readings werefound after 0.4 hours (24minutes) offlushing.With an average
freevolume intheflasks of 1423mlthismeansadilutionofthe0 2 concentrations with
about 12%. Since the readings remained stable between 0.4 and 0.7 hours after
flushing,weassumethatthisdilutinginfluenceontherateofacetaldehydeandethanol
productionwasnegligible.Themeasurementswerecarriedoutincombinationwiththe
gasexchange measurements. Duetotechnical problems,however,thefirst seriesof
measurements resulted in unreliable results (not shown). Therefore only the data
collected inthe second series wereused.
106
Alcoholic fermentationofapplefruitsat various02concentrations
Gasexchangemodels
The models usedto relate gasexchange ratestogasconditions arebasedonsimple
Michaelis-Menten type of equations. The 0 2 uptake rates measured were fitted to
equation 1(Chevillotte, 1973):
<""02
=
2
"2
( 1 )
{Km02 + cy
where Vm02 is the maximum 0 2 uptake rate (ml.kg"1.h"1) and Km02 the Michaelis
constant for 0 2 uptake. Because C0 2 can be produced byoxidative andfermentative
processes, these processes were described separately. Oxidative C0 2 production is
calculated as:
VC02ox = V02 * RQox
(2)
whereVC02ox istheoxidativeC0 2 production rate(ml.kg'1.h"1)andRQ0XtheRQofthe
oxidative processes. Fermentative C0 2 production is calculated using model 2 of
Peppelenbos et al. (1996):
vcoj
= _!^«»
'2'
02 \
0)
Kmf02
whereVmfC02isthemaximumfermentative C0 2 production rate(ml.kg'1.h"1)andKmf02
the Michaelis constant for the inhibition of fermentative C0 2 production. Total C0 2
production,therefore, isthe combination of equations 2 and3:
* RO
vco2 -- - VO
VVJ * n u
2
+
m
Vmfœ2
+
1 +
(4)
[Kmf02j
Statisticalanalysis
Gasexchangedatawerecomparedwithequations 1 and4usingnon-linear regression
inthe statistical package GENSTAT (Rothamstead, U.K.). In all cases the non-linear
equations werefitteddirectlywithout anytransformation, usingan iterative methodto
107
Chapter8
maximize the likelihood. At low concentrations of ethanol and acetaldehyde a linear
relationship is assumed between levels measured inthe gas phase and levels inthe
tissue (after Kimmerer and MacDonald, 1987). Therefore, to clarify the relationship
betweenfermentation ratesasmeasuredbyethanolandacetaldehyde concentrations
intheheadspaceandthemodelledfermentativeC0 2production,tissueconcentrations
of ethanol and acetaldehyde were estimated using GENSTAT and a simple linear
equation:
COz f = a * Acetaldehyde + b * Ethanol
(5)
with C02f, ethanol and acetaldehyde in mmoles.kg"1.h"1 and a and b empirical
constants.
Results
The response of the gas exchange rates of the apples measured to various oxygen
concentrations is shown infigures 1A (0 2 uptake) and 1B(C0 2 production). Infigure
1B the contribution of both oxidative and fermentative processes to the total C0 2
production,asfitted with the equations used,is shown.Already at 0 2 concentrations
closetonormoxiatheequationsusedpredictfermentativeC0 2production,albeitsmall.
When 0 2 concentrations are lowered, fermentative C0 2 production increases in
importance, until at an 0 2 concentration of about 1.1% it equals oxidative C0 2
production (Fig 1B).Afterfittingequation 1tothe 0 2 uptakedataa Km02 value of 5.7
was found (Table 1), meaning that at an 0 2 concentration of 0.5% 0 2 uptake rates
weredecreasedto50%ofitsmaximum rate.ForfermentativeC0 2 productionaKmf02
Table 1. Regression analysis of gas exchange data on 02 consumption and COs production models.
R2 = Percentage variance accounted for (indication for the goodness of fit), adj = adjusted for the number of
parameters, est = estimated values, se = standard error.
Model
R2adj
variate
0 2 Consumption
93.4
Vm02
Km 0 2
C 0 2 Production
61.1
RQox
Vmf C02
Kmf 02
108
est
se
9.44
5.72
0.956
6.67
0.506
0.60
0.95
0.043
0.57
0.142
Alcoholic fermentationofapplefruitsat various02concentrations
of0.51wasfound, indicatingthatatan0 2 concentration of0.5%thefermentative C0 2
production reached50%of its maximum rate.The RQoftheoxidative processeswas
estimated as 0.956 (Table 1). Acetaldehyde and ethanol were detected at all 0 2
concentrations applied, including concentrations close to normoxia (Table 3). The
lowest acetaldehyde and ethanol concentrations found were 0.3 ppb and 30 ppb
respectively.
0)
XL
B
Q.
O
Ü
O Concentration (%)
Figure1.
Gas exchange rates of Cox Orange Pippin apples stored at various 02
concentrations.A: 02 uptake:measurements(P) and model fit (
) . B: C02
production:measurements(U)andmodelfit;totalC02production(
),oxidative
C02 production(
) andfermentativeC02 production (
).
109
Chapter8
Atypical detection curve is shown infigure 2,wheretwo specialfeatures appear due
to the flushing of the headspace around the apples to the sample cell. First a
backgroundconcentrationisfound,whichhadtobecorrectedfor(measurements after
18-24minutes).Thesecondfeature isthat stableconcentrations arereachedafter42
minutes.Measurementsafterthistimeperiodwereusedtoestimateacetaldehydeand
ethanol concentrations. The concentrations were used to calculate production rates.
Because gas exchange rates were derived at concentrations changing 0.2% in 0 2
maximally, it is assumed that metabolic rates are in equilibrium with external gas
conditions.Therefore the C0 2 productionfound (andfitted) can beconsidered asthe
actualC0 2 production insideappletissues.Acetaldehyde andethanol,however, were
measured inthe gas phasesurroundingthe apples.It isknownthat concentrations of
acetaldehyde andethanol arehigherwithintissuesthan inthegas phase. Foragood
comparison between measurements on metabolites and the predicted fermentation
rates the internal metabolite concentrations were calculated. The conversion factors
used were estimated by equation 5, revealing 267 for acetaldehyde and 377 for
ethanol (meaning internal ethanol concentrations to be 377 times higher inside than
outside;Table 2).
Table 2. Ratiobetweenethanolandacetaldehyde in tissueand inair.
(dataofNorthand Cockburn (1975)weretransformedintoumol.g'.h'1 beforecalculatingtheratio,andthe
equationgivenby Kimmereretal.(1987)wasusedforairconcentrations below 100ppm).
Source
North, Cockburn (1975)
tissue
Acetaldehyde Ethanol
whole apples (cv. Golden Delicious)
226-303
whole apples (cv. H.Wonder with Grenadier)
Kimmerer et al. (1987)
C0 2 model fittedto data
leaves of woody plants
whole apples
718-857
334
5001
267
377
When predicted fermentative C0 2 production was compared with the summation of
(calculated) internal acetaldehyde and ethanol concentrations a good relation was
found at the lowest 0 2 concentrations used, but the relation was less at higher 0 2
concentrations (Table 3). Especially at hypoxia the predicted fermentative C0 2
production exceeds the ethanol and acetaldehyde production considerably (fig.3).
110
Alcoholic fermentation ofapplefruitsat various02concentrations
Table 3. EthanolandacetaldehydeproductionandpredictedfermentativeC02 production.
02:02 concentrationsactuallymeasuredduringthestorageperiod,headspace:acetaldehydeandethanol
productionderivedfromheadspacemeasurements, tissue:calculatedproductionusingheadspaceproduction
and conversionfactorsof table2, fermentativeC02: calculatedusingequation3.
day
4
5
4
5
4
5
5
4
4
5
5
4
o2
(%)
Headspace
Headspace Tissue
Tissue
Model
Tissue
Acetaldehyde Ethanol
Acetaldehyde Ethanol
Total
fermentative C0 2
nmol.kg'Vh"1 nmol.kg'.h"1 |j.mol.kg" .h"'
nmol.kgVh'1 nmol.kg'1.h~1 nmol.kg'.h'1
0.067
0.068
0.073
0.619
1.463
2.174
2.465
2.593
7.752
10.40
18.76
20.28
422.5
339.6
340.3
32.0
0.437
0.013
0.011
0.438
0.283
0.243
0.010
0.256
316.9
445.9
434.5
251.7
30.2
8.83
1.09
32.8
20.2
20.8
1.01
0.00
112.8
90.7
90.9
8.53
0.117
0.004
0.003
0.117
0.076
0.065
0.003
0.068
119.5
168.2
163.9
94.9
11.4
3.33
0.413
12.4
7.62
7.86
0.383
0.000
232.3
258.9
254.7
103.5
11.5
3.33
0.416
12.5
7.70
7.93
0.385
0.068
248.2
247.6
245.5
126.5
72.3
53.1
47.9
45.9
17.2
13.0
7.38
6.84
.o
Q.
a.
ôc
ra
"S.
LU
8
<
0.40
0.60
Time (hours)
Figure2.
Typical detection curve of ethanol (•) and acetaldehyde (D) as measured with the PA
techniqueandthemethodsdescribed(applein 7.6-7.4% 02).
111
Chapter8
O)
o
g
o
O
0 2 Concentration (%)
F/pure3.
Total ethanol and acetaldehyde production (9), of Elstar apples stored at various 02
concentrations,comparedwiththemodelledfermentativeC02 production(
).
Discussion
The lowest acetaldehyde and ethanol concentrations found (0.3 ppb and 30 ppb
respectively) are remarkably lower than the lowest concentrations detected by
Kimmerer and MacDonald (1987): 25.5 ppm and 24.4 ppm respectively. Also much
lower production rates could be detected: 0.01 pmol.g"1.h'1 of acetaldehyde and 1
pmol.g"1.h"1 of ethanol (Table 3), whereas Bûcher et al. (1994) found 2 nmol.g1 for
ethanol and acetaldehyde. The data found suggest alcoholic fermentation always to
be active, even at higher 0 2 concentrations. Already in 1933 Fidler also reported 40
\ig of ethanol per gram of appletissue stored inair. More authors found fermentative
metabolites in harvested plant tissues kept in air (Colelli et al., 1991;Nanos et al.,
1992, Mateos et al., 1993, Larsen and Watkins, 1995). At these conditions the
metaboliteswerealwaysdetectedinthetissue,butneverinthegasphasesurrounding
the tissue. Kimmerer and Kozlowski,for instance, found no ethanol or acetaldehyde
inthe gas phase surrounding 11different higher plants. Itseems that fermentation is
112
Alcoholic fermentationofapplefruitsat various02concentrations
activeunderall0 2concentrations,althoughethanolisnotnecessarilytobefound.This
can be due to remetabolization (Bûcher et al., 1994) orto the limits of the detection
methods used.
The main argument to explain fermentation in ambient air is the existence of 0 2
gradients inside bulky plant tissues such as apples. Although the 0 2 concentration
surroundingtheapples equals normoxia,part ofthe internalgasphasecould become
hypoxic or even anoxic (Brandie, 1968). This would explain the ethanol production
found in ambient air (Knee, 1991b). Nevertheless one has to consider that this was
found for apples at the climacteric peak, when gas exchange rates reach maximum
levels. For preclimacteric apples, like the apples used in this experiment, internal
concentrations found rangebetween 16.1%to 18.9%(Burton,1974), 12.7%to14.8%
(Solomos, 1987)or 11.7%to 15.1%directly undertheskinand 10.6%to 14.8%atthe
center of thefruit (Rajapakse et al., 1990).Although these internal 0 2 concentrations
areconsiderably lowerthantheexternalones,theycannot beconsideredto resemble
hypoxia.Thiswould meanthat fermentation isaconstitutive process inplanttissues,
but increasing in importance when 0 2 concentrations are lowered.This hypothesis is
in linewithdataonADHactivity (Andrews et al., 1993),where activeADH isfoundat
0 2 concentrations as high as 40%. The enzyme, however, regarded as limiting for
ethanolic fermentation is not ADH but Pyruvate Decarboxylase or PDC (Kennedy et
al., 1992).Although Perata andAlpi (1993) state that PDC is not active in normoxia,
other authors suggest aconstitutive PDC inleavesandother planttissues (Kimmerer
and MacDonald, 1987; Kennedy et al., 1992). If acetaldehyde, detected in air, was
actually derivedfrom pyruvate,thiswould indicatethatfermentative pathways arenot
fullyturnedoff underaerobicconditions(Ricardetal., 1994).Presentdatasuggestthat
this hypothesis is correct.
The gas exchange model used to describe fermentative C0 2 production predicts
fermentation always to be active,albeit atvery low rates when 0 2 concentrations are
ashighasnormoxia(Fig 1B).Althoughqualitativelythisseemsinaccordancewiththe
ethanol and acetaldehyde measurements, it is also important whether the actual
productionratesarecomparable.ThereforemodelledfermentativeC0 2productionwas
compared with the sum of estimated internal concentrations of ethanol and
acetaldehyde. This revealed that, although model predictions seemed accurate at
anoxia,at higher 0 2 concentrationsthe modelclearly overestimates fermentative C0 2
production,especially at hypoxia.Sincethe modelwasfittedtoactualC0 2 production
113
Chapter8
data, it would suggest another source for C0 2 in addition to fermentation and
respiration.
An excess of C0 2 production over ethanol production has been reported before.
Leshuk and Saltveit (1991) for instance found increased C0 2 production 7 minutes
after exposing carrot discs to anoxia, while increased ethanol production was found
after 30 minutes.A possible explanation isthat inthefirst periodof anoxiaaroundthe
exposed tissue the actual 0 2 concentrations inside the tissue experiences hypoxia.
One metabolic route possibly beingactive inhypoxia istheoperation ofapartialTCA
cycle (Ricard et al., 1994). It is suggested that reactions occurring in helminths also
take place inhigher plants,wheremalateisconvertedtofumarate andthen succinate
(Kennedy et al., 1992). Another source for excess C0 2 during anoxia might be the
conversion from glutamate to (gamma) amino butyric acid (Bertani and Reggiani,
1991). Both reactions generate C0 2 without ethanol. Good and Muench (1993),
however, argue that for root tissues succinate and malate are products of anaerobic
fermentation in the short term (1-2 days), but not in the long term. Because for the
applesthegasexchange datawerederivedafter 3to5daysofstorage,itseemsthat
in apples an additional C0 2 producing process is not only temporarily active. Also
Yearsly et al. (1996) find for Cox's orange Pippin apples a discrepancy between RQ
increase and increase inethanol production at low 0 2 concentrations. When different
pathways are involved inthe release ofC0 2 , itquestions the useofsimple MichaelisMenten kinetics for the description of C0 2 production.
The ratio between ethanol levels in air and in the apple tissue, as estimated by the
fitting procedure usingmodelling results,isremarkablyclosetovaluesfound by North
andCockburn (1975)forotherapplecultivars(Table2).Thevaluefoundby Kimmerer
et al. (1987) after measurements on woody plants, however, is much higher.
Nevertheless the ratio found for acetaldehyde, also found by these authors, is
comparable (Table 2).This result indicates that the estimated internal concentrations
are dependable, but also underline the close relationship between model predictions
and metabolite measurements.
The assumption, based on the C0 2 production model, that fermentation is active at
higher 0 2 concentrations, seems correct. The model used, however, does not seem
to describefermentation only.Whentotal C0 2 production rates haveto beestimated,
forapplications suchas ModifiedAtmosphere packaging offruits andvegetables,this
is not causing problems (Peppelenbos et al., 1996). When the model is used to
114
Alcoholic fermentationofapplefruitsat various02concentrations
estimate other processes, one has to be cautious. The discrepancy between model
predictions and measurements on metabolites clearly stresses the importance of a
good description of the processes occurring in hypoxia.The question is whether the
C0 2 production model, based on simple Michaelis-Menten type of kinetics, can be
used to incorporate additional processes.
Acknowledgements
Theauthorswishtothank Rolf Doekerforassistingthe lasermeasurements and Prof.
Jorg Reus for stimulating this work.
115
116
9
General discussion.
The role of gas exchange characteristics and models in
storing and packaging fruits and vegetables
State of the art
In 1989 Banks et al. opened their paper, presented at the main conference dealing
with CA storage and MA packaging,withthe complaint that 'despite several decades
of MA research,our knowledge ofthe physiology of MA effects remains sketchy and
empirically based'. Establishment of the lower 0 2 limit for stored fruit has normally
been accomplished bytrial and error (Gran and Beaudry, 1993), by keeping fruits or
vegetables undervarious gasconditionsfor acertain period,revealing aconditionas
the best to maintain specific quality aspects ofthe commodity. Because there areso
many fruits and vegetables, with different characteristics for every cultivar, location
where it was grown and even the year when it was grown,this type of research has
the potential of endless continuation.
Banks et al. (1989), however, came with another approach:modelling.A model isno
more than a simplified representation of the system studied (Rabbinge and de Wit,
1989). By simulating reality with the model,the properties of the models are studied
and compared tothose ofthe systems they represent. If unacceptable discrepancies
between model and system are observed, it is possible to judge which aspects are
then to be studied experimentally (Rabbinge and de Wit, 1989). 'Even inaccurate
models can provide valuable improvements in understanding, and can be used to
identify critical parameters regulating the system under study, and thereby assist
research programme management' (Banks et al., 1989). Modelling is widely used to
gain insight into the functioning of repeatable systems and has proved to be very
productive (Rabbinge and de Wit, 1989).
117
Chapter9
The research carried out inthe past 4 years, as described in the previous chapters,
was focused on modelling the main processes involved in CA storage and MA
packaging: respiration and fermentation.The goal was to enable the calculation and
predictionoftheresponseingasexchangebehaviourofarangeofproductstovarious
gas conditions. This chapter evaluates whether some progress has been made, if
practical applications can be derived, if the modelling was linked to physiological
processes actuallyoccurring,andifthemethods usedthroughouttheexperiments are
correct.
Respiration and quality changes
In 1995 Brash et al. published a paper entitled 'shelf-life of stored asparagus is
strongly relatedtopostharvest respiratoryactivity'. Generally,theeffect of reduced 0 2
and/or elevated C0 2 on reducing the respiration rate has been assumed to be the
primary reasonforthe beneficialeffects ofCAandMAonfresh produce (Kader et al.,
1989).Several authors,including Kaderhimself, haveseverecritics onthisapproach.
Itwaswellunderstood byearlyworkersasKiddandWestthatthecorrelation between
a reduction in the respiration rate and an extension of storage life was probably an
over-simplification (Burton, 1974). Knee (1980) stated: 'increased knowledge of
respiratory metabolism doesnotsuggest anobvious mechanismforC0 2 effects or 0 2
effects'. For Laties (1995) 'it challenges the imagination to contemplate a time when
fruit respiration was the cynosure of ripening and postharvest studies without regard
of the role of ethylene'. He continues to say that 'the preoccupation with fruit
respiration understandably stemmed from the perception that respiration was a
measureofmetabolic healthandintegrity'. Inrecentyearsalsoquestionsaroseonthe
roleofethylene,sincenotallfruitsexhibitanethylene-inducedclimacteric onripening,
and ethylene canalso elicit arespiratory response without concomitant ripening.This
makes Laties (1995) admit that 'the course and nature of respiration in ripeningfruit,
whether in or out of cold storage, remains of paramount interest'.
Modelling gas exchange
Traditionally instudiesonqualitychangesoffruits andvegetables underchangedgas
conditionsthefocuswaslaidonrespiration.Thefocusoftheresearchdescribedwithin
this thesis, however, was more and more directed towards the role of fermentation,
anditsrelationwithrespiration.Questionsaroselike'whendoesfermentationoccur?',
118
Generaldiscussion
'does itstart at aspecific 0 2 concentration asisoftenthought?', 'what happens inthe
energy balance when bothprocesses areactive?'.Theonlywaytogetanywherewas
to quantify fluxes. To estimate fermentation rates, first respiration rates had to be
accurately calculated: how much oxygen was consumed, how much carbon dioxide
produced, at which concentrations. Then models were needed to integrate the data
and interpolate between gas concentrations without gas exchange measurements.
Oncehavingthegasexchange models,itbecamepossibletoestimateenergyfluxes,
and relate these fluxes to storage behaviour.
Michaelis-Menten kinetics
Although Chevillotte used Michaelis-Menten kinetics already in 1973 to describe
respiration rates in relation to 0 2 concentrations, only recently the advantages of this
type of equation have been recognized (Banks et al., 1989;Andrich et al., 1991; Lee
et al., 1991;Peppelenbos et al., 1993).This approach seems more logical because it
describes the enzymatic rate of 0 2 uptake in plant tissues (Cameron et al., 1995). 'It
should be remembered, however, that this isasingle enzyme/single substrate model
and will only be appropriate to whole plant tissues and organs when a response is
dependent uponasinglecritical reactant actingatasingleenzymesite'(Knee,1980).
This is often thought about the simple models as used throughout the thesis.
Chevillotte (1973), however, already mentionedthat although the kinetics seemtobe
that of the terminal enzyme,the maximum rate of the reaction is limited by the other
components of the respiratory chain (cushioning effect). Which means that the
calculated'overall'ratesarerelatedtothetotalchainofallenzyme reactionsinvolved.
The inhibitory effect of C0 2
Lee et al. (1991) modelled the inhibitory effect of C0 2 on 0 2 uptake by an extension
ofthe Michaelis-Menten equation.Cameron et al. (1995)findthisalogical application
ofthe inhibitor concept, butfindhardly anydatainthe literatureto support a universal
inhibition of C0 2 on 0 2 uptake. 'Thus,a negative effect of C0 2 partial pressure on 0 2
uptake cannot be assumed without adequate confirmation' (Cameron et al., 1995).
Using the Michaelis-Menten model, Dadzie et al. (1993) also made the simplifying
assumption that variation incarbon dioxide concentrations inthe model systems has
noeffect onthe respiration rate.The experiments described in Peppelenbos andvan
't Leven (1996;chapter2), however, didshowaninhibitory effect of increased C0 2 on
119
Chapter9
0 2 uptakeofbroccoli,asparagus,mungbeanandchicory.Aftercomparingthedifferent
possiblemechanismstodescribethisinhibition,theso-callednon-competitivetypewas
preferred, confirming the choice of Lee et al. (1991). For the different products,
however, the inhibitory action of C0 2 seemed to be different. This seems to confirm
the statement of Knee (1980) that 'increased knowledge of respiratory metabolism
does not suggest an obvious mechanism for C0 2 effects. Very likely not just one
mechanism is involved.This was accommodated by combining both the competitive
anduncompetitivetypeofinhibition intoonemodel,thesocalled'combinedinhibition'.
This latter model showed equal results as the best models using only one type of
inhibition. Although the inhibitory effect of C0 2 seems to be well described by an
extension of the enzyme kinetics model, it is not clear yet whether only a MichaelisMententypeof kinetics isinvolved.Research ontheenzymes inthe respiratory chain
should reveal this information.
Temperature and model functioning
WhenControlledAtmosphere (CA) isappliedtostoreproducts,afixedtemperature is
used.ModifiedAtmosphere (MA) packages,however,canbesubjectedtochanges in
temperature during the distribution from packing houses to retailers. These changes
can influencethe gascomposition withinthepackages (Dadzieet al., 1993;Cameron
etal., 1994).Thereforetherelationbetweentemperatureandgasexchangeratesmust
be known. For every product studied the metabolic rates increase with temperature.
Dadzie et al. (1993) andJoies etal.(1994) modelledthis influence oftemperature by
multiplying the maximum uptake rate (Vm02) as measured at 0°Cwith aspecific Q10
value.Gasexchange dataofseveral authors,onblueberry and raspberry fruits,show
the Km02 to increase with temperature (Beaudry et al., 1992;Cameron et al., 1994).
Peppelenbos et al. (1993), however, found a decrease in the Km with increasing
temperature for mushrooms. The Michaelis-Menten approach requires an accurate
description of the Km (Km02), preferably over a range of conditions (Cameron et al.,
1995).
Cameron et al.(1994) modelled both Vm02 aswell as Km02 as exponential functions
of the temperature. This approach needs per variable (like Vm02) two additional
variables to estimate the influence of the temperature (Cameron et al., 1994). To
describe gas exchange rates with the models described within this thesis, using
maximally 7variables (Vm02, Km02> KmC02, RQ0X,VmfC02, Kmf02 and KmfC02), it could
120
Generaldiscussion
mean14additionalvariablestoestimate.Thisseemslikeare-introductionofextensive
empirical research.The risk is that 'something that started as an explanatory model
degenerates progressively into a cumbersome descriptive model' (Rabbinge and de
Wit, 1989).Therefore amorefundamental approach seems necessary. Since models
are used based on enzyme kinetics, the focus should be on the relation between
temperature and enzyme functioning. Also the influence of temperature on diffusion
characteristics might contribute to the changes observed in experiments.
Modelling fermentative C0 2 production
In chapter 3 several models, based on enzyme kinetics, were tested on describing
oxidative and non-oxidative C0 2 production. After statistical analysis two models
appearedtofunctionwell. Basedonphysiologicalconsiderations nochoice infavorof
one ofthem could be made. Nevertheless inthe otherchapters ofthisthesis (4,5,6,
7 and 8) only one model is used;the one which uses 0 2 as an inhibitor of alcoholic
fermentation.Thiswasonly basedonthefactthatthis modelwasslightly simpler and
easier totest thanthe one usingoxidative ATP production asan inhibitor of alcoholic
fermentation.
Anaerobic metabolism in plants appears much less diverse than it did 10years ago.
Although other pathways than ethanol fermentation exist, they remain quantitatively
minor (Ricard et al., 1994). Therefore calculating C0 2 from ethanolic fermentation
seems to cover most of the non-respiratory C0 2 production. Duringthe first hours of
anoxia, it is necessary to determine the sum of the main products accumulated
(ethanol, lactate and alanine), andthis gives a mean fermentation ratefor the period
considered. The determination of the rate of accumulation of ethanol alone may be
acceptable for later times of anoxia (Ricard et al., 1994). The assumption, based on
the C0 2 production model, that ethanolic fermentation is active at higher 0 2
concentrations, seems correct.The model used,however,does not seemto describe
fermentation only.Resultsfromchapter8suggestanadditionalC0 2 source,especially
at hypoxia. An excess of C0 2 production over ethanol production has been reported
before (Leshuk and Saltveit, 1991;Ricard et al., 1994;Kennedy et al., 1992; Bertani
andReggiani,1991).Althoughseveraltheoriesareposedtoexplainthisphenomenon,
thephysiologyremainsunclear.WhentotalC0 2productionrateshavetobeestimated,
forapplicationssuchasModifiedAtmospherepackagingoffruitsandvegetables,there
appear to be no problems since the model fits to total C0 2 production including the
121
Chapter9
additional source (chapter 8). When the model is used to estimate other processes
than gas exchange, one has to be cautious. In chapter 7 for instance, fermentative
rates were used to estimate ATP production. Fermentative C0 2 production was
estimatedfromthe increase inC0 2 production relativeto0 2 uptake.Ifpartofthis C0 2
production cannot be attributed to fermentation, the estimated contribution of
fermentation tototalATP production isoverestimated.Tocalculatetheenergystatus,
alsothe contribution ofthe additional proces(ses) haveto be quantified. Ricardetal.
(1994), however, state that in higher plants the synthesis of succinate is a
quantitativelyminorpathwayofanaerobicmetabolismintermsofATPproduction.Also
other processes than succinate synthesis, like amino butyric acid synthesis (Bertani
and Reggiani, 1991), could occur during hypoxia contributing to ATP production. If
energy status is actually related to disorders occurring during CA storage, as was
hypothised in chapter 7, a better insight in and quantification of these processes
occurring during hypoxia areneeded.
Diffusion resistances and gas exchange rates
So far most gas exchange models have used the level of 0 2 outside the fruit as a
value of substrate availability; yet, it isthe level of 0 2 insidethe product that limits 0 2
uptake by enzyme systems (Cameron et al., 1995). Fruits themselves can be
comparedwithmodifiedatmospherepackageswithinwhichtheirtissuesreside(Dadzie
etal., 1993).Thisconceptconsidersthefruitskinasthemajorbarrierforgasdiffusion.
Cameron and Yang (1982) developed an elegant method of measuring this specific
diffusion resistance by using ethane: 'We chose ethane for preloading because it is
neither produced or metabolized to a significant degree bythe tissue, it should have
properties similarto ethylene,anditcanbequickly andaccurately determined at low
concentrations by gas chromatography'. Nowadays ethane production is commonly
associated with membrane damage and cell death,and is increasing with increasing
injury of plant tissues (Abeles et al., 1992). Specially when research isfocused ona
relationbetweenchanges indiffusion resistanceoffruitsduringstorageandtheonset
of storage disorders, this ethane production might influence the measurements.
Another disadvantage of ethane or other hydrocarbon gases in tissues with high fat
content istheirhighsolubility inlipids.Forinstance,avocadosgiveunrealistically high
intercellular volume when ethane is used for measurement (Solomos, 1987). These
twoarguments questionthe useof ethane.Neonseemsagoodalternative,since itis
122
Generaldiscussion
not being produced in any metabolic process.The solubility, however, still has to be
tested to prevent the same mistakes as mentioned by Solomos (1987).
After deriving resistance values for neon diffusion in plant tissues, and for ethane
diffusion as well, it is important to knowthe relationwith resistance values for 0 2 and
C0 2 . This issue was not addressed by Cameron and Yang (1982) or Knee (1991a).
Banks (1985) suggests that ethane diffusion is probably similar to 0 2 and ethylene
diffusion. UsingGraham's law,predictions onthe relationship betweenthediffusionof
the various gasses can be made, which is done in chapter 6. Based on this law the
diffusion ratesof0 2 ,ethaneandethyleneshouldbecomparable,butthediffusion rate
of neon should be 18%higher andof C0 2 20%lower. Thediffusion routes, however,
ofneon,ethane,0 2 andC0 2 arenotnecessarily equal.Themovementof0 2 isthought
to be restricted to stomata or lenticels, but C0 2 may also diffuse directly through the
cuticle of fruits (Banks, 1985). Also biochemical processes are involved when for
instance C0 2 from the gas phase dissolves into the water phase of the fruit cells
(Brown, 1985). This makes the overall use of Graham's law questionable. A real
comparisonofresistancevalues isnecessary,andforthispurposeonemightcombine
the method of Rajapakse et al. (1990) andthe ethane (Cameron and Yang, 1982) or
the neon method.
Another possible drawback of the method of loading or preloading with an inert gas,
isthattheapproach uses Fick's lawtocalculatediffusion.This,however, canonly be
doneiftheskinisthemajor barrierfordiffusion (Knee,1991a,b),andiftherateof C0 2
production is uniform throughout the tissue (Solomos, 1987). From research by
Rajapakse et al. (1990) it is known that for some products diffusivity inflesh tissues
must be taken into consideration. In apples, however, the percentage of the total 0 2
gradient betweentheexternalatmosphereandtheinternalcorecavitycausedbyflesh
was found to be only 4.5% in Cox's Orange Pippin and 11% in Braeburn apples
(Rajapakse, 1990).This indicatesthatthevaluesfoundforthethree applecultivars in
chapter 5 are very likely close to the overall diffusion resistance to gas diffusion. For
products other than apple the contribution of flesh resistance can add up to 30% in
Asianpearsand56%innectarines(Rajapakseetal., 1990).Thereforeboththeethane
andtheneonmethodcannot besimplyappliedtoalltypesofcommodities. Forapple,
the most important product for CA storage,the methods seem appropriate.
123
Chapter9
The experimental setup
Chevillotte (1973) concluded that the single enzyme model isthe only representation
whichleadstoasatisfactory studyatthecytochrome oxidase-oxygen reaction levelin
vivo, whenpossiblechanges brought about bydiffusion aretaken intoaccount.When
thecurrent resultsareanalyzed,differences inKmvaluescanbeattributedtodiffusion
limitations. The result that the models show aworse functioning inthe case of Elstar
andCox'sOrangePippinapplesismoredifficulttounderstand.Iftheresistancevalues
obtained arecorrect,the main reasonfortheworse model behaviour might bedueto
theexperimental setup.Beforethiscanbeexplained,ithastobenotedthat Elstarand
Cox's Orange Pippin apples showed higher resistance values, lower porosity than
Golden Delicious apples,incombinationwithequalgasexchange rates inthecaseof
Cox'sOrangePippin.Usingheadspacetechniquestoquantifygasexchangerates,the
assumption wasthat gasexchange rateswere inequilibriumwithgasconcentrations.
With gas concentrations changing 0.3% at ambient air and 0.1%maximally at 0 2
concentrations lower than 5%, this assumption seems correct. When, however, the
internal0 2concentrationswerecalculatedatoptimalexternal0 2concentrations (Table
3), the internal 0 2 concentration of Cox's Orange Pippin apples was 0%. A small
change of 0.1% inanexternal 0 2 concentration closeto 1% therefore canchangethe
internal atmosphere from hypoxia to anoxia. That surely cannot be regarded as a
stable equilibrium situation. It also confirms the idea posed by Pfister-Sieber and
Brandie (1994),that changes intolerance of plant tissues to low 0 2 concentrations is
probably amatter of minor changes inmetabolic rates.Theconclusion to bedrawn is
that alsofor experimental setups,whereoften different temperatures are used,some
precalculations usinggasexchangeanddiffusion resistances will helptooptimizethe
methods.
Gas exchange characteristics and tolerance to low oxygen concentrations
Duringoxygen limitation inhigherplants,energy metabolismswitchesfrom respiration
to fermentation (Bûcher et al., 1994). Although postharvest studies often regard
fermentation asaprocesstobeavoided(seelater),otherstudiesseefermentationas
another source for ATP, necessary to survive periods of anoxia (Good and Muench,
1993; Bûcher et al., 1994; Fox et al., 1994). Nevertheless there is also no simple
relationship betweensurvivalandtheactivityoffermentative metabolism(Ricardetal.,
1994).ThisbecomesstrikinglyclearwhentheminimumATPneed,necessaryforplant
124
Generaldiscussion
tissues to stay alive, is unknown. Infact the energy balance and energy use innongrowingtissues-theso-calledmaintenanceenergy requirement-areoftencalculated,
but in terms of cell biology are poorly understood (Brady, 1987). In theory in one
tissue a highfermentation ratestilldoes notcoverthese maintenance needs,whilein
anothertissueshowinglowfermentation ratestheATPproduction issufficient. Ricard
et al.(1994) dooffer oneobservation infavor ofthe roleofATP:the decrease inATP
was suggested to be the main cause for the rapid acidification of the cytosol found
aftertransfer oftissues toanoxia.The remarkof Bradyalsoaddresses another issue:
energy use innon-growingtissues (like most harvestedfruits andvegetables) is often
completely regarded asformaintenance.AlsoZhangandGreenway (1994) assumed
that the plant tissue they studied used all the energy produced for maintenance,
irrespective of gas conditions. It is unclear, however, if the division of energy use
between growth or maintenance inthis case issufficient. Apples after harvest do not
show 'growth', but do show processes related to ripening (maturation) which require
energy. Infactthe basis ofthe storage under lowoxygenconcentrations offruits and
vegetables isthat ripening is reduced (Kader et al., 1989).Asituation without growth
isnotnecessarily asituationwithonlymaintenance.Therefore itisproposedthattotal
ATPproduction isdividedbetweengrowth,ripeningandmaintenance processes.The
Maintenance Energy Requirements levelused inthisthesis,can be referredtoasthe
minimum ATP production necessary to maintain cell viability.
Optimum concentrations for storage
Throughout the years optimum 0 2 concentrations for storage were thought to be
relatedtospecific points;theExtinction Point (EP),theAnaerobic Compensation point
(ACP) or the Respiration Quotient Breakpoint (RQB). The EP was defined by
Blackman (1928) as the highest 0 2 concentration with no anaerobic metabolism,
measured asethanol oracetaldehyde production. In 1933,however, Fidler measured
40 u.g of ethanol pergram of appletissue stored inair. Nevertheless the EPtheory is
still being used, for instance by Knee (1991b) who states that 'the minimum safe
concentration for oxygen can be checked by measuring the concentration at which
ethanol is first detected as oxygen is lowered. Ethanol is now detected as a normal
constituent of apples andmanyotherfruits held underaerobic conditions,andtheEP
is, therefore, an untenable concept based on archaic analytical methods (Boersig et
al., 1988). For products such as apples and pearsthe C0 2 production was observed
125
Chapter9
to be minimal at the EP, and therefore C0 2 production was also used for the
determination of the EP. However, products with low fermentation rates will show a
minimal C0 2 production atalower0 2 concentration thanthe EP,sometimes resulting
inaminimal C0 2 production at0%0 2 (see broccoli,mungbean inchapter 3). In1951
TurnerthereforestressedthattheEPshouldbedeterminedbyanaerobicproductslike
ethanolandlactateandnotbyC0 2 production.Nevertheless in 1988another concept
was proposed, the Anaerobic Compensation Point (ACP), defined as the 0 2
concentration atwhich C0 2 production isminimal(Boersigetal., 1988).TheACP can
beexplained asthe 0 2 concentration where anincrease inanaerobic C0 2 production
compensates forthe decrease inaerobic C0 2 production.Although notmentionedby
the authors, this implies anaerobic metabolism at higher 0 2 concentrations than the
ACP,andagradualshiftfrom aerobictoanaerobic metabolism.Butasforthe EPthe
ACP can only be used for products forming ethanol. The RQB is, like the EP, also
based on a sudden start of anaerobic metabolism. It is described as the 0 2
concentrationwheretheRQisstartingtoincreasewhen0 2 isfurtherlowered.Alsothe
RQB is thought to be useful for establishing the lowest 0 2 concentration for storage
(GranandBeaudry, 1993).Basedonchapter7thisassumptionseemsjustifiedwhen
one measurement is carried out before storage, and a better definition is used to
establishthe RQlimitabovewhichthe RQBshouldrise.TheACP,however, doesnot
showarelationshipwithoptimalstorageconditionsofthreeapplecultivars.Sinceapple
is the product stored in highest quantities under CA, this is a strong practical
disqualification oftheACPconcept.ItalsoraisesquestionsonthehypothesisofWollin
et al. (1985), who assumed that if the product is kept at the 0 2concentration with
minimal C0 2 production (equalto the ACP), no low 0 2 injury was to be found.They
suggested that this specific 0 2 concentration should be continuously monitored and
adjusted if necessary. Consideringthe datafoundtheACP ischanging indeed,butto
other0 2 concentrationsthanareexpectedtobebeneficial.UsingtheACPorthe RQB
for dynamic control could lead to severe problems. A combination of gas exchange
rates and models which enable the calculation of ATP production might reduce that
risk. This confirms the conclusions of Chervin et al. (1996), that there is a need for
morefundamental studies ofenergy metabolism inhorticultural products subjectedto
CA conditions. Energy metabolism is more related to cell functioning than gas
exchange rates, and it is expected that research on energy metabolism will help to
clarify the occurrence of disorders inproduce subjected to extreme gas conditions.
126
Generaldiscussion
Fermentation in normoxia
Although ethanol and acetaldehyde are often measured in plant tissues innormoxia,
it was never measured in the gas phase surrounding the tissues. The two products
may be immediately re-metabolized (Bûcher et al., 1994). This leaves unanswered
whether fermentation actually exists at normoxia. The main argument to explain
fermentation inambient air isthe existence of 0 2 gradients inside bulky plant tissues
such as apples. Ricard et al. (1994) explain this phenomenon by (partial) hypoxia
within these tissues, because oxygen diffusion was hampered by a bulky tissue.
Although the 0 2 concentration surrounding the apples equals normoxia, part of the
internal gas phase could become hypoxic or even anoxic (Brandie, 1968). It would
explain the ethanol production found in ambient air (Knee, 1991b). This diffusion
aspect slightly modifiedthethinking onfermentation asoptimal oxygen concentration
is then defined as the internal 0 2 concentration where the respiration is minimized
without development of fermentation (Banks et al., 1993). Nevertheless one has to
consider that this was found for apples at the climacteric peak, when gas exchange
ratesreachmaximumlevels.Forpreclimactericapples,liketheapplesusedinchapter
8,internalconcentrationsfoundrangebetween 16.1%to18.9%(Burton,1974),12.7%
to 14.8% (Solomos, 1987) or 11.7% to 15.1% directly under the skin and 10.6%to
14.8% atthe center of thefruit (Rajapakse et al., 1990).Alsothe research described
inchapter6doesnotfindinternal0 2concentrations lowerthan 16.5%inapplesstored
inambient air. Although these internal 0 2 concentrations areconsiderably lower than
theexternalones,theycannot beconsideredto resemble hypoxia.With acetaldehyde
andethanol production measured attheseconditions itwould meanthat fermentation
is a constitutive process in plant tissues, but increasing in importance when 0 2
concentrations are lowered.
Fermentation in postharvest studies
When harvested plant products are stored at very low 0 2 or very high C0 2
concentrations, increased fermentation rates are found together with necrotic and
discolored tissues (Kader et al., 1989). Therefore it is often assumed that a direct
relationexists betweenfermentationandtheoccurrenceofdisorders.Kader(1986)for
instance stated that the decarboxylation of pyruvate to form acetaldehyde, C0 2 and
ultimately ethanol,results inthedevelopment ofoff-flavours andtissuebreakdown.In
this line of thinking research on Controlled Atmosphere (CA) storage was always
127
Chapter9
focused on avoiding fermentation. With increasing accuracy of detection techniques,
and ethanol and acetaldehyde beingdetected inambient air (chapter 8), a complete
avoidance of fermentation seems impossible. Also the possible relation between
increasedethanol levelsanddecreasedcellviabilitywasnotfoundbyPerataandAlpi
(1991).The only influence of ethanol on quality seems therefore the induction of offtaste and off-odours. This changes the view upon ethanolic fermentation during the
storage of harvested planttissues. Instead of avoiding fermentation,the optimization
ofstorageconditionscouldbecomethebalancingbetweenpossiblebeneficialaspects
ofincreasedfermentation (intermsofenergyproduction) anddetrimentalaspects (offodours and off-taste). This implies the introduction of dynamic optimal gas
concentrations instead of static ones,which are used now.Storagefacilities couldbe
improvedbytheincorporationofmonitoringandfeed-backsystemsthatrespondtothe
actual physiology of the stored product. The gas exchange models described within
this thesis could be used as a basisfor the calculation of energy production (chapter
7),whileethanol,the maincauseforoff-odours andoff-taste,canbedetected directly
intheatmosphere surroundingthestoredproduce.Indoingthis,two important criteria
havetwo beknown:the minimum energy production necessary for maintenance,and
the ethanol level that should beavoided.
Major conclusions
TheinfluenceofC0 2 on0 2 uptakewasinvestigated,andtheknownMichaelis-Menten
equation given by Chevillotte (1973) was extended with the type of inhibition
adequately describing this influence (chapter 2). Models describing fermentative C0 2
productionweredevelopedandcombinedwithoxidativeC0 2 production.Althoughthe
mechanisminhibitingalcoholicfermentationremainsunclear,C0 2 productionofvarious
products can bedescribed under a range ofcombinations of 0 2 andC0 2 (chapter 3).
Two parameters ofthe models, Kmf02andVmfC02,couldonly bedetermined if 0% 0 2
wasoneoftheconditions usedtomeasuregasexchange.Thisunusualgascondition,
not optimal forthe storage of any product known,is being used since afew years in
everygasexchangeexperiment conductedatATO-DLO andbyinstitutes cooperating
in several EUfinanced research programmes. Although gas exchange of mungbean
and microbial growth on it could not be distinguished, a model was developed
describing the total gas exchange of mungbean and microbial growth (chapter 4),
making it possible to estimate mungbean respiration in MA packages. A methodwas
128
Generaldiscussion
derived enabling the simultaneous measurement of metabolic gas exchange andthe
resistance to gas diffusion (chapter 5). Results of these measurements showed
limitations to experimental setups using headspace techniques, and indicated that
optimal 0 2 concentrations arevery likely limitedtoaspecific temperature (chapter6).
AlthoughotherC0 2 sources arelikelytoexistinhypoxia,themodelscanalsobeused
to estimate other metabolic aspects, such as ATP fluxes. In chapter 7 it was shown
that ATP fluxes, in combination with maintenance requirements, very likely help to
understand tolerance of plant tissues to low oxygen conditions. Finally research was
carried out to investigate whether predictions of the models describing fermentative
C0 2 production,that fermentation isnot limitedto low0 2 concentrations,was correct.
Measurements onacetaldehyde and ethanol seemtoconfirm this prediction (chapter
8). If correct, these results mean that the traditional view upon fermentation used in
postharveststudiesisincorrect.Nottheavoidanceoffermentationshouldthanbecome
themainfocusofresearch,butthepossiblefunctionoffermentation.Itwashypothised
that one role offermentation duringstorage isthecontribution tothe energy statusof
the products subjected to CA conditions.
Future outlook
Models will become increasingly important to guide future research in postharvest
studies, instead of fitting data after all measurements have been carried out. This
confirmstheideasofBanksetal. (1989).Basedonresultsandideaswithinthisthesis,
future research seems necessary on several aspects.
a. Beforecarryingoutexperimentsongasexchange,someprecalculationsusinggas
exchange anddiffusion resistances will helpto optimize the methods.
b. Because changes in temperature duringthe distribution from packing houses to
retailers can influence the gas composition within MA packages, the relation
between temperature and gas exchange rates must be known. Because the
models used are based on enzyme kinetics,the focus should be on the relation
between temperature and enzyme activity.
c. Itisexpectedthatmoreresearchontherelationshipbetweenmaintenanceenergy
requirements and cell injury will clarify an important part of the changes in
tolerance to low 0 2 concentrations (or optimal 0 2 concentrations) during ageing
ormaturationofharvestedplanttissues.Studiesoncellculturescouldhelptogain
more knowledge on fundamental aspects as energy metabolism in relation to
129
Chapter9
storage needs (Zhang and Greenway, 1994; Chervin et al., 1996). Cell studies
might also help to avoid the variance between individual products caused by
diffusion resistances.
The possible relation between energy status and storage disorders in products
subjectedtoCAconditions,alsoraisesquestionsontheirpretreatments.Andrews
et al. (1994) showed that the extent to which the mRNAs for PDC and ADH
increased in maize seedlings subjected to anoxia depended on whether the
seedlings had been previously acclimated to hypoxia or anoxia. Pretreatments
might improve storability ofcertain products by increasingtheirfermentative ATP
production capacity.
Optimalgasconditionsforstorageofproducearenotfixedvaluesbutchangewith
temperature and,more important, alsoduringthestorage period.Usingfixedgas
conditions for long term storage, which is the common procedure, could lead to
problems and loss of stored produce. Interactive storage facilities, responding to
physiology ofthe storedmaterial,couldhelpto reducethe riskofstorage losses.
Processes that should be quantified are energy metabolism and fermentation
rates. Parameters related to these processes are gas exchange rates and
acetaldehydeandethanolproduction.Forthecalculationofenergyproductionthe
gasexchangemodelsdescribedwithinthisthesiscouldbeused(chapter7),while
ethanol,the main causefor off-odours and off taste, can be detected directly in
the atmosphere surrounding the stored produce. In doing this, two important
criteria, presently unknown, have two be established: the minimum energy
production necessary for maintenance, and the ethanol level that should be
avoided. The first criterium can be obtained in cell studies, when energy
metabolism and cell viability under various gas conditions is measured. The
second criterium can be obtained by sensoric analysis. This type of knowledge,
incombination withsensorsandadequatesoftware,willhelptoimprovestaticCA
facilities to dynamic storage systems.
130
10
Summary
Oxygen consumption as influenced by carbon dioxide
High carbon dioxide (C02) concentrations can reduce the oxygen (02) consumption
rate of a number of fruits and vegetables. This reduction can be modelled by
incorporating an inhibitionterm inan Michaelis-Menten type of model,describing the
overall respiration process as a single enzyme reaction. Four types of inhibition can
be distinguished: 1. the competitive type,2.the uncompetitive type,3. a combination
of both previous types and4.thenon-competitivetype (after Chang, 1981).Usingthe
inhibitiontermsagoodestimationof0 2 consumptioncouldbeobtained.Thissupports
the use of Michaelis-Menten kinetics for modelling 0 2 consumption.
Dependingontheproductthestatisticalanalysisgavegoodresultsforthecompetitive
and the uncompetitive type of inhibition. Based on gas exchange data only, no
distinctionbetweenthecompetitiveanduncompetitivetypeofinhibitioncouldbemade.
The datasuggest thesimultaneous existence of bothtypes of inhibition.However, for
reasons of simplicity the non-competitive type of inhibition is preferred, giving good
results for all the products tested. This non-competitive inhibition term, evaluated in
chapter 2, is used inother chapters whenever an influence of C0 2 on respiration was
found.
Oxidative and fermentative carbon dioxide production
BecausethemainmetabolicsourcesforC0 2 emission byhigher plantsare respiration
andfermentation,both processes haveto be incorporated inamodeldescribing total
C0 2 production. Forthis purpose one existing model (Peppelenbos et al., 1993) was
adjusted and,based on different theories,two models were developed.The adjusted
model used 0 2 as an inhibitor of fermentative C0 2 production,whereas the two new
models usedtheATPproduction rate,representingATPconcentration.The difference
131
Chapter 10
between the latter two models isthat inthefirst one ATP production iscalculated by
usingonly oxidative processes,while inthesecond oneATP production is calculated
by a combination of oxidative and fermentative processes. All models allow for
increased C0 2 production at low 0 2 concentrations, as is often found for several
products. The best performance was found for the adjusted model and the new one
which used oxidative ATP.The results do not clarify whether increased fermentation
rates can be attributed to decreased 0 2 levels or decreased energy fluxes. The
approach used,however, enablesthe calculation of C0 2 production rates of different
types of commodities stored under various gas conditions. This facilitates a better
prediction of C0 2 conditions inside storage rooms and MA packages.
Alcoholic fermentation as influenced by carbon dioxide
NotonlyrespirationcanbeinfluencedbyhighC0 2concentrations. Inseveralproducts
thisinfluenceisalsofoundonfermentation.Thisinfluencewasincorporatedinthe C0 2
productionmodelbasedontheinhibitionofalcoholicfermentation by0 2 (the'adjusted'
model). Gas exchange rates of mungbean sprouts under various 0 2 and C0 2
concentrations were used to validate the model. With the modification applied, C0 2
production rates were described better. Although C0 2 production at low 0 2
concentrationswasreducedbyhighC0 2concentrations,thedatashowednoinfluence
on ethanol and acetaldehyde levels.
The data obtained indicate largedifferences between gas exchange ratesof different
batches of mungbean sprouts. It is suggested that microbial metabolism attributes
substantially tototalC0 2 production ratesfound,andmight explainthese differences.
The simultaneous measurement of gas exchange and diffusion resistance
Amethodwasdevelopedtomeasuremetabolic gasexchange ratesandgas diffusion
resistanceofapplessimultaneously, undervariousgasconditions.Forthispurposethe
trace gas neonwas selected.After closing aflask containing anapplealready keptat
a specific gas condition,the neon partial pressure was brought to 110 Pa. Changes
in oxygen and carbondioxide concentration in the flask were used to calculate gas
exchange,andthedecrease inneonconcentrationwasusedtocalculategas diffusion
resistance.Thecalculated resistance values were compared with data obtainedfrom
literature, and estimations of 0 2 and C0 2 resistance values were made.The method
worked well on apples, but this will not necessarily be the case when products are
132
Summary
measured with small internal gasvolumes.
Functioningofgasexchangemodelsusinginternalandexternal concentrations
Based ongasexchange rates anddiffusion resistance, internalgasconcentrations of
apple cultivars Golden Delicious, Elstar and Cox's Orange Pippin were calculated.
Internal0 2 concentrations were2.3 kPalowerat anexternal 0 2 concentration of 20.7
kPa for Golden Delicious apples, and about 4.5 kPa lower at 20.1 and 20.4 external
0 2 for Elstar and Cox's apples respectively. Internal C0 2 concentrations substantially
exceedednormalexternalconcentrations of50Pa.TheKmvaluesfoundforthethree
apple cultivars remained significantly different when internal instead of external
concentrations wereused.Thisindicatesthattheapplecultivarsmeasureddonotonly
show biophysical differences (resistance, porosity), but also differences at the
biochemical level.
For Golden Delicious apples no difference in model functioning was found when
internalorexternalconcentrations wereused.Incontrast,forElstarandCox's Orange
Pippin apples the 0 2 uptake and C0 2 production models showed better results
(expressed as R2) when fitted on external concentrations. It is arguedthat this might
beexplained bythe experimental setup. For instance the internal 0 2 concentration of
Cox's Orange Pippin calculated at the optimal external Oz concentration (1.2%)
reached 0.01%. A small change of 0.1% inanexternal 0 2 concentration closeto1%
therefore can change the internal atmosphere from hypoxia to anoxia, which cannot
be regarded as an equilibrium situation. The conclusion to be drawn is that also for
experimental setups some precalculations using gas exchange rates and diffusion
resistances will help to optimize the methods.
Gas exchange characteristics and prediction of optimal gas conditions for CA
storage
The applicability of respiratory characteristics to determine optimal 0 2 concentrations
forthestorageofappleswastested.Acomparisonwasmadebetweengasexchange
rates of apples directly after harvest and after a period of storage. Optimal 0 2
concentrations were basedongasexchangedataandgasexchange modelsfittedon
thedata,usingtheAnaerobicCompensationPoint(ACP)andtheRespiratoryQuotient
Breakpoint (RQB).Athirdtoestablishoptimalgasconcentrations waywas comparing
total ATP production with estimated maintenance energy requirements, revealingthe
133
Chapter 10
Maintenance OxygenConcentration (MOC).ATPproductionwascalculatedusinggas
exchange models. MOC was defined as the oxygen concentration with the minimal
ATP production rate necessary for maintaining cell viability. The optimal 0 2
concentrations asestablishedbyACP,RQBandMOCdifferedconsiderably. Because
ACPvaluesdifferedfromnormallyadvisedvalues,theACPwasunsuitableforaquick
determination oftheoptimal 0 2 concentration oftheapples used.The RQB,however,
might be suitable, but than the limit used to establish the RQB should be more than
0.5 units higher than the RQ measured in ambient air. The ACP and the RQB were
decreased to lower 0 2 concentrations after storage, suggesting that the optimal
concentrations decrease during storage. In contrast the MOC was increased after
storage, which was in agreement with data as found in the literature. Model
calculations indicated the lowest optimal 0 2 concentration for the second (optimal)
harvest using the ACP, the RQB and the MOC. It is suggested that research on the
relationship between Maintenance Energy Requirements andcell injury will clarify an
important part ofthechanges inoptimal 0 2 concentrations (orthetolerance to low 0 2
concentrations) during ageing or maturation of harvested plant tissues.
Fermentation at high oxygen concentrations
Apples were stored at various 0 2 concentrations, ranging between normoxia and
anoxia. Gas exchange rates and the production of acetaldehyde and ethanol was
measured. A gas exchange model, which distinguishes oxidative from fermentative
C0 2 production, was fitted to the data. The results indicate alcoholic fermentation to
be active at all the 0 2 concentrations used, and increasing in importance when 0 2
concentrations are lowered.After calculating the amount of metabolites inthe apple
tissue from the data measured in air, a close relationship was found between model
predictions of alcoholic fermentation rates and measured metabolite production in
normoxiaandanoxia.Inhypoxia,however,themodelpredictedhigherC0 2 production
rates in comparison to the metabolites actually found. Because the model was fitted
toC0 2 production data,this indicates another sourceorC0 2 inhypoxiathan alcoholic
fermentation.
Conclusions
TheinfluenceofC0 2 on0 2 uptakewasinvestigated,andtheknown Michaelis-Menten
equation given by Chevillotte (1973) was extended with the type of inhibition
134
Summary
adequately describing this influence. Models describing fermentative C0 2 production
weredevelopedandcombinedwithoxidativeC0 2 production,enablingthe calculation
of C0 2 production of various products under a range ofcombinations of 0 2 and C0 2 .
Although gas exchange of mungbean and microbial growth on it could not be
distinguished,amodelwasdevelopeddescribingthetotalgasexchangeof mungbean
and microbial growth, enabling the calculation of mungbean gas exchange in MA
packages.Amethodwasderivedenablingthesimultaneousmeasurementofmetabolic
gas exchange and the resistance to gas diffusion. Results of these measurements
showedlimitationstoexperimentalsetups usingheadspacetechniques,andindicated
that optimal 0 2 concentrations are very likely limited to a specific temperature.
Measurements on acetaldehyde and ethanol confirm the prediction of the models
describing fermentative C0 2 production, and show that fermentation is not limited to
low 0 2 concentrations.
Optimal gas conditions for storage of produce are not fixed values but change with
temperature and, more important, also during the storage period. Using fixed gas
conditionsfor longtermstorage,thiscouldleadtoproblemsandthe lossofthestored
produce. Interactivestoragefacilities, respondingtophysiology ofthestoredmaterial,
willhelptoreducethisrisk.Processesthatshouldbequantifiedareenergymetabolism
andfermentationrates.Parametersrelatedtotheseprocessesaregasexchangerates
andacetaldehyde andethanolproduction.Forthecalculationofenergyproductionthe
gas exchange models described within this thesis could be used. ATP fluxes, in
combination with maintenance requirements, very likely help to understand the
tolerance of plant tissues to low oxygen conditions.
135
136
11
Samenvatting
De invloed van kooldioxide op zuurstofconsumptie
In een omgeving met een verlaagde zuurstofconcentratie neemt de ademhalingssnelheid van groenten en fruit af. De relatie tussen zuurstofconcentratie en
zuurstofopname kan worden beschreven in een model gebaseerd op de MichaelisMenten kinetiek, waarbij het totale ademhalingsproces beschreven wordt als een
enkele enzymreactie. Ook een hoge kooldioxideconcentratie kan bij een aantal
Produktendeademhalingssnelheid verlagen.Dezeverlaging kanworden beschreven
worden door een zogenaamde inhibitieterm inte bouwen in hetgenoemde model.Er
kunnen vier soorten inhibitie onderscheiden worden (naar Chang, 1981): 1. het
'competitive' type; 2. het 'uncompetitive' type; 3. het 'non-competitive' type, dat een
combinatie vantype 1en2iswaarbij beidetypeneenevensterke invloedhebben,en
4. een nieuwe beschrijving van decombinatie vantype 1en2 waarbij dezetypen in
verschillende mateeen rolspelen.Doorgebruikte makenvan inhibitietermen konhet
zuurstofverbruik goed beschreven worden. Dit ondersteunt het gebruik van de
Michaelis-Menten-kinetiek voorhetmodellerenvandeademhaling.Afhankelijkvanhet
product geeft de statistische analyse de beste resultaten voor het 'competitive', het
'uncompetitive' type of de nieuwe combinatie (type 4). Gebaseerd opgegevens over
alleen gasuitwisseling is het niet mogelijk een voorkeur voor één van deze
inhibitietypen aan te geven. Het suggereert dat beidetypen inhibitie gelijktijdig naast
elkaarvoorkomen,zoalsbeschrevenintype3en4.Omredenenvanvereenvoudiging
wordtvooralgemeengebruiktochdevoorkeurgegevenaanhet'non-competitive'type,
dat voor alle geteste producten goede resultaten gaf.
Oxidatieve en fermentatieve kooldioxideproductie
Ademhaling en fermentatie zijn de belangrijkste metabolische bronnen voor C0 2 137
Chapter 11
emissies door hogere planten. Daarom moeten in een model voor de totale C o productie beide processen worden opgenomen. Er bestond echter geen model met
parameters die voor deze processen relevant zijn. Voor dit doel zijn daarom
verschillende modellen ontwikkeld en getest. Allereerst is een bestaand model
aangepast, dat zuurstof gebruikt als remmer van fermentatieve C02-productie.
Daarnaast zijn ertwee modellen ontwikkeld die deATP-productiesnelheid gebruiken
als remmer van fermentatieve C02-productie. Deze twee 'ATP-modellen' verschillen
in de berekeningswijze van de ATP-productie: één model gebruikt alleen oxidatieve
processen,terwijl het andere model een combinatie van oxidatieve en fermentatieve
processen gebruikt.
De drie modellen zijn in staat de toename van de C02-productie bij lage 0 2 concentraties te beschrijven,zoals vaak gevonden wordt bij producten zoals appels.
Hetaangepaste modelenhetATP-modelmetalleenoxidatieve processen komenhet
meest overeen met de metingen. De resultaten maken echter niet duidelijk of een
toename infermentatiesnelheid het gevolg isvan verlaagde 02-concentratiesof van
verlaagde energiefluxen. Degebruikte benadering maakt het inelkgevalmogelijk om
C02-productiesnelheden van diverse producten te berekenen bij bewaring onder
verschillende gascondities. Dit maakt een betere voorspelling van C02-condities in
bewaarcellen en MA-verpakkingen mogelijk.
Alcoholische fermentatie onder invloed van kooldioxide
Niet alleen de ademhaling kan beïnvloed worden door hoge C02-concentraties. In
verschillendeproductenisookeeninvloedvanC0 2 opdefermentatiegevonden.Deze
invloed is ingebouwd in het C02-productiemodel gebaseerd op remming van
alcoholische fermentatie door 0 2 . Gegevens over gasuitwisseling bij taugé onder
verschillende 0 2 - en C02-conditieszijn gebruikt om het modeltevalideren. Met deze
aanpassingwordendeC02-productiesnelhedenbeter beschreven.Ofschoonde C0 2 productie bij lage 02-concentraties gereduceerd werd, wat te verklaren is door een
verlaagde fermentatiesnelheid, is er geen verlaging van de ethanol- en
aceetaldehydeconcentraties gevonden.Verderzijnerbijdeverschillendeexperimenten
grote verschillen gevonden in gasuitwisselingssnelheid. Gezien de grote maar
wisselende hoeveelheid micro-organismen op taugé, zou een verklaring voor de
verschillenkunnenzijndathetmicrobiëlemetabolismeeenaanzienlijkebijdrage levert
aan detotale C02-productiesnelheid.
138
Samenvatting
Gelijktijdige meting van gasuitwisselingen diffusieweerstand
Een methode is ontwikkeld om gelijktijdig gasuitwisselingssnelheden als gevolg van
metabole processen en de gasdiffusieweerstand in appels onder verschillende
gascondities te meten.Voor dit doel is hetspore-gas neon gebruikt. Naafsluitingvan
een cuvet, met daarin een onder specifieke gascondities bewaarde appel,werd aan
decuvet neon toegevoegd tot een partiële drukvan 110Pa. Deveranderingen in 0 2
en C0 2 in de cuvet werden gebruikt om de gasuitwisseling te berekenen, terwijl de
afname inneonconcentratie werdgebruikt omdegasdiffusieweerstand teberekenen.
Deberekende waarden voordeweerstand zijnvergeleken met literatuurgegevens en
metderesultatenzijndediffusieweerstanden voor0 2 enC0 2 geschat. Deze methode
werktegoedbijappels.Hetisechtervanbelangoptemerkendatditwaarschijnlijkniet
het geval zal zijn bij producten met een klein intern gasvolume.
Het functioneren van gasuitwisselingsmodellen bij gebruik van externe en
interne gasconcentraties
Internegasconcentraties vanGolden Delicious, ElstarenCox's Orange Pippin appels
werden berekend op basis van gasuitwisselingssnelheden en diffusieweerstanden.
HieruitvolgdedatvoorGoldenDeliciousdeinternezuurstofconcentratie 2.3kPalager
was dan de externe concentratie van 20.7 kPa. Bij Elstar en Cox werden interne
zuurstofconcentraties berekenddie4.5kPalagerwarendandeomgevingsconcentratie
(gemiddeld 20.1 kPa en 20.4 kPa respectievelijk). Interne kooldioxideconcentraties
waren aanmerkelijk hoger dan50 Pazoals ingewone luchtwordt gevonden.Als naar
demodellenwordtgekeken,danblijktdatdeKmwaardensignificantverschillentussen
dedrieappelcultivars,ookalserinterneconcentratieswordengebruikt. Ditsuggereert
dat er tussen de drie gemeten appelcultivars niet allen biofysische, maar ook
biochemischeverschillenbestaan.VoorGoldenDeliciousfunctioneerdendemodellen
even goed als er interne in plaats van externe gasconcentraties werden gebruikt.
Daarentegen werden er voor Elstar en Cox's Orange Pippin betere resultaten
gevonden (uitgedrukt in R2) als de externe concentraties gebruikt werden. Als
verklaring wordt aangevoerd dat dit waarschijnlijk te wijten is aan de proefopzet. Als
bijvoorbeeld de interne zuurstofconcentratie van Cox-appels wordt berekend bij de
optimale externe concentratie (1.2%), dan wordt een waarde van 0.01% gevonden.
Een verandering in de externe concentratie van 0.1%, zoals wordt gebruikt voor de
gasuitwisselingsmetingen,kandanbetekenendatdeinterneatmosfeerverandertvan
139
Chapter 11
hypoxia naar anoxia. Dit komt niet overeen met een evenwichtssituatie. Deconclusie
is dan ook dat proefopzetten verbeterd kunnen worden met behulp van enkele
berekeningen vooraf, waarbij schattingen van gasuitwisselingssnelheden en
diffusieweerstanden gebruikt worden.
Voorspelling van optimale gascondities met behulp van gasuitwisseling
Onderzocht is in hoeverre ademhalingskarakteristieken toepasbaar zijn om optimale
02-concentraties voor het bewaren van appels te bepalen. Hiertoe zijn metingen van
gasuitwisseling van appels van drie oogsttijdstippen, direct na de oogst en na een
bewaarperiode van 4 maanden, vergeleken. Optimale 02-concentraties zijn bepaald
op basis van deze metingen en op basis van modellen gefit op de metingen. Hierbij
is gebruik gemaakt van drie karakteristieken; het 'Anaerobic Compensation Point of
ACP, de zuurstofconcentratie waar de kooldioxideproductie minimaal is, en het
Respiration Quotiënt Breakpoint of RQB,dezuurstofconcentratie waar de RQsnel in
waarde stijgt. Daarnaast zijn optimale 02-concentraties bepaald door de totale ATPproductie te vergelijken met de geschatte energiebehoefte voor onderhoud, wat de
MaintenanceOxygenConcentrationofMOCopleverde.DeATP-productieisberekend
metbehulpvaneerderbeschrevengasuitwisselingsmodellen. DeMOCisgedefinieerd
als de zuurstofconcentratie met de minimale ATP-productiesnelheid die nodig is om
een cel in levente houden. Degevonden optimale 02-concentraties op basis van de
drie berekeningswijzen (ACP, RQB of MOC) verschillen aanzienlijk. Omdat deACPwaarden afwijken van de in het algemeen geadviseerde waarden, lijken deze
ongeschiktvooreensnellebepalingvandeoptimale02-concentratievandegebruikte
appels.Het RQBlijktmeergeschikt, mitsdelimietdiegebruiktwordtomhet RQBvast
te stellen meer dan 0.5 eenheid hoger isdan het RQzoals in normale lucht gemeten
wordt. Het ACP en het RQB daalden naar lagere 02-concentraties na bewaring,wat
zouwijzen opeenverlagingvandeoptimale concentraties tijdens de bewaarperiode.
DeMOCdaarentegenwastoegenomennabewaring,watovereenkomt met resultaten
die in de praktijk gevonden worden. Modelberekeningen laten de laagste optimale
zuurstofconcentraties zien bij de tweede (optimale) oogst, zowel bij gebruik van het
ACP en het RQB als van de MOC. Verwacht wordt dat onderzoek naar de relatie
tussen deenergiebehoefte vooronderhoudencelschade voor een belangrijk deelde
veranderingen in optimale zuurstofconcentraties (of de tolerantie voor lage
zuurstofconcentraties) gedurendeverouderingofrijpingvangeoogste plantenweefsels
140
Samenvatting
zal kunnen verklaren.
Fermentatie bij hogezuurstofconcentraties
In een experiment zijn appels bewaard bij verschillende zuurstofconcentraties,
variërend van normoxia tot anoxia. Hierbij zijn gasuitwisselingssnelheden en de
productie van aceetaldehyde en ethanol gemeten. Een gasuitwisselingsmodel dat
oxidatieveCOz-productieonderscheidt vanfermentatieve C02-productie isgefitopde
data. De resultaten tonen alcoholische fermentatie aan bij alle gebruikte
zuurstofconcentraties,toenemendinbelangbijdalendezuurstofconcentraties.Tevens
zijn de hoeveelheden metabolieten in het appelweefsel berekend met behulp van de
gegevens gemeten in lucht. Er blijkt een duidelijke relatie te bestaan tussen de
modelvoorspellingen van alcoholische fermentatiesnelheden en de gemeten
metabolietproductie bij normoxia en anoxia. Bij hypoxia echter voorspelt het model
hogereC02-productiesnelhedendanopbasisvandewerkelijkgevonden metabolieten
verwacht kanworden.Omdat het model gefit is op gegevens over deC02-productie,
geeft hetvoorgaande aandaterinhypoxiaeenandereC02-bron isnaast ademhaling
en alcoholische fermentatie.
Conclusies
De invloed van C0 2 op de opname van 0 2 is onderzocht. De bekende MichaelisMenten-vergelijking zoals gegeven door Chevillotte (1973) is uitgebreid met het type
inhibitie dat deze invloed goed beschrijft.
Er zijn enkele modellen ontwikkeld die fermentatieve C02-productie beschrijven, die
gecombineerd zijn met oxidatieve C02-productie. Dit maakte het mogelijk de C0 2 productievanverschillende productenteberekenenbinneneenserievancombinaties
van 0 2 en C0 2 .
Alhoewel gasuitwisseling vantaugé en microbiële groei optaugé niet onderscheiden
kon worden, is een model ontwikkeld voor de totale gasuitwisseling van taugé en
microbiële groei. Hierdoor is het mogelijk gemaakt de ademhaling van taugé in MAverpakkingen te schatten.
Er is een methode ontwikkeld die het mogelijk maakt gelijktijdig metabolische
gasuitwisseling en de weerstand voor gasdiffusie te meten. Resultaten van deze
metingen tonen beperkingen aan experimentele opzetten waarbij gebruik gemaakt
wordt van zogenaamde head-spacetechnieken.Tevens geven de resultaten aan dat
141
Chapter 11
optimale (Deconcentraties zeer waarschijnlijk beperkt zijn tot een specifieke
temperatuur.
Deontwikkelde modellen kunnengebruikt worden omandere metabolische aspecten
zoals ATP-fluxen te berekenen. ATP-fluxen gecombineerd met de energiebehoefte
vooronderhoudhelpenzeerwaarschijnlijk omdetolerantievanplantweefselvoorlage
zuurstofcondities te begrijpen. Metingen aan aceetaldehyde en ethanol lijken te
bevestigendatfermentatienietbeperkt istotlage02-concentraties,zoalsdemodellen
die fermentatieve C02-productie beschrijven voorspellen.
142
References
Abeles F.B., Morgan P.W., Saltveit M.E., 1992. Ethylene in Plant Biology. Academic Press Inc., San
Diego, USA: 53-55.
Amir J., Kahn V., Unterman M., 1977. Respiration,ATP level,and sugar accumulation inpotato tubers
during storage at 4°. Phytochemistry, 16: 1495-1498.
Andrews D.L., Cobb B.G., Johnson J.R., Drew M.C., 1993. Hypoxic and anoxic induction of alcohol
dehydrogenase in roots and shoots of seedlings of Zea mays. Plant Physiol., 101:407-414.
Andrews D.L., MacAlpine D.M., Johnson J.R., Kelley P.M., Cobb B.G., Drew M.C., 1994. Differential
induction of mRNAsforthe glycolytic and ethanolic fermentative pathways by hypoxia and anoxia
in Maize seedlings. Plant Physiol., 106: 1575-1582.
Andrich G., Fiorentini R., Tuci A., Zinnai A., Sommovigo G, 1991.A tentative model to describe the
respiration of stored apples. J.Amer. Soc. Hort. Sei., 116: 478-481.
Andrich G., Zinnai A., Balzini S., Silvestri S., Fiorentini R., 1994. The kinetic effect of PC0 2 on the
respiration rate of Golden Delicious apples. Acta Hort., 368: 374-381.
Banks N.H. 1985. Estimating skin resistance to gas diffusion in apples and potatoes. J. Exp. Bot., 36:
1842-1850.
Banks N.H., HewettE.W., Rajapakse N.C., ClelandD.J.,Austin P.C.,StewartT.M., 1989.Modellingfruit
response to modified atmospheres. In: Fellman J.K. (ed.), Proc. 5th Int. Contr. Atm. Res. Conf.,
June 14-16 1989, Wenatchee, Washington USA: 359-366.
Banks N.H., Dadzie B.K., Cleland D.J., 1993. Reducing gas exchange of fruits with surface coatings.
Posth. Biol. Techn., 3: 269-284.
Baumann H., Henze J., 1983. Intercellular space volume of fruit. Acta. Hort. 138: 107-111.
Beaudry R.M., Cameron A.C., Shirazi A., Dostal-Lange D.L., 1992. Modified-atmosphere packaging of
blueberry fruit: effect of temperature on package 0 2 and C0 2 . J.Amer. Soc. Hort. Sei., 117: 436441.
Beaudry R.M., 1993. Effect of carbon dioxide partial pressure on blueberry fruit respiration and
respiratory quotient. Posth. Biol. Technol., 3: 249-258.
Beaudry R.M., Uyguanco E.R., Lennington T.M., 1993. Relationship between headspace and tissue
ethanol levels of blueberry fruit and carrot roots in sealed LDPE packages. In: Blanpied G.D.,
BartschJ.A., Hicks,J.R. (eds),6,hProc. Int.Contr.Atm.Res.Conf., Ithaca,NewYork, USA:87-94.
Bendall D.S., Ranson S.L., Walker D.A., 1960. Effects of carbon dioxide on the oxidation of succinate
and reduced diphosphopyridine nucleotide by Ricinus mitochondria. Biochem. J.,76: 221-225.
Bennik M.H.J., Smid E.J., Rombouts F.M., Gorris L.G.M., 1995. Growth of psychotrophic foodborne
pathogens in a solid surface model system under the influence of carbon dioxide and oxygen.
Food Microbiol., 12: 509-519.
Berard J.E., 1819. Memoire sur la maturation des fruits. Ann. Chim. Phys., 16: 152-251.
143
Bertani A., Reggiani R., 1991.Anaerobic metabolism in rice roots. In: Jackson M.B., Davies D.D.,
Lambers H., Plant life under oxygen deprivation. SPB Academic Publishing bv., The Hague, The
Netherlands: 187-199.
Bijnen F., 1995. Refined laser photoacoustic trace gas detection; observation of anaerobic processes
in insects soil and fruit. PhD thesis, Katholieke Universiteit Nijmegen.
Blackman F.F., 1928. Formulation of a catalytic system for the respiration of apples and its relation to
oxygen. Proc. Royal Soc. London, B, 103:491-523.
Blanpied G.D., Silsby K.J., 1989. Usefulness of CA survey data to improve storage practices and
technology for apples. In: Fellman J.K. (ed.), Proc. 5,h Int. Contr. Atm. Res. Conf., June 14-16
1989, Wenatchee, Washington USA: 367-373.
Boersig M.R., Kader A.A., Romani R.J., 1988.Aerobic-anaerobic respiratory transition in pearfruit and
cultured pear fruit cells. J. Amer. Soc. Hort. Sei., 113: 869-873.
Brady C.J., 1987. Fruit ripening. Ann. Rev. Plant Physiol.,38: 155-178.
BramlageW.J.,Drake M., LordW.J.,1980.The influence of mineral nutritiononthequality and storage
performance of pome fruits grown in North America. Acta Hort., 92: 29-39.
Brandie R., 1968. DieVerteilung der Sauerstoff-konzentrationen infleischigen Speicherorganen (Apfel,
Bananen und Kartoffelknollen). Berichte der Schweiz. Bot. Gesellschaft, 78: 330-364.
Brash D.W., Charles C M . , Wright S., Bycroft B.L., 1995. Shelf-life of stored asparagus is strongly
related to postharvest respiratory activity. Posth. Biol. Technol., 5: 77-81.
Brown A.W., 1985. C0 2 and intracellular pH. Plant, Cell and Environm., 8: 459-465.
Bûcher M., Brandie R., Kuhlemeier C , 1994. Ethanolic fermentation intransgenic tobacco expressing
Zymomonas mobilis pyruvate decarboxylase. The EMBO J., 13: 2755-2763.
Burg S.P., Burg E.A., 1965. Gas exchange in fruits. Physiol. Plant., 18: 870-884.
Burton W.G., 1974. Some biophysical principles underlying the controlled atmosphere storage of plant
material. Ann.Appl. Biol., 78: 149-168.
Cameron A.C., Yang S.F., 1982.A simple method for the determination of resistance to gas diffusion
in plant organs. Plant Physiol.,70:21-23.
Cameron A.C., Boylan-Pett W., Lee J., 1989. Design of modified atmosphere packaging systems:
modelling oxygen concentrations within sealed packages of tomato fruits.J. Food Sei., 54: 14131416.
CameronA.C., 1989.Modifiedatmosphere packaging,anovelapproachforoptimizing package oxygen
and carbon dioxide. In: FellmanJ.K. (ed.), Proc. 5th Int. Contr. Atm. Res. Conf., June 14-16 1989,
Wenatchee, Washington USA: 197-208.
Cameron A.C., Beaudry R.M., Banks N.H., Yelanich M.V., 1994. Modified-atmosphere packaging of
blueberry fruit: modeling respiration and package oxygen partial pressures as a function of
temperature. J. Am. Soc. Hort. Sei., 119: 534-539.
Cameron A.C., Talasila P.C., Joles D.W., 1995. Predicting film permeability needs for modified
atmosphere packaging of lightly processed fruits and vegetables. HortSci., 30: 25-34.
Chang R., 1981. Physicalchemistrywithapplicationstobiologicalsystems.2ndedition,MacMillan Publ.
Co., INC., New York, USA.
Chang L.A., Hammett L.K., Pharr D.M., 1983. Carbon dioxide effects on ethanol production, pyruvate
decarboxylase, and alcohol dehydrogenase activities in anaerobic sweet potato roots. Plant
Physiol., 71:59-62.
144
References
Chen P.M., Borgic D.M., Sugar D., Mellenthin W.M., 1986. Influence of fruits maturity and growing
district on brown core disorder of Bartlett pears. HortSci., 21;1172-1173.
Chervin C , Brady C.J., Patterson B.D., Faragher J.D., 1996. Could studies on cell responses to low
oxygen levels provide improved options for fruit storage and disinfestation? Posth. Biol.Technol.,
7: 289-299.
Chevillotte P., 1973. Relation between the reaction cytochrome oxidase-oxygen and oxygen uptake in
cells in vivo. J.Theor. Biol., 39: 277-195.
Chinnan M.S., Pendalwar D.S., 1990. Modeling modified atmosphere packaging of tomatoes. Food
Engineer., 2: 349-361.
ColelliG.,MitchellF.G., KaderA.A., 1991. Extensionof postharvest lifeof'Mission'figsbyCCyenriched
atmospheres. HortSci., 26: 1193-1195.
Curry E.A., 1989. Effect of harvest date and oxygen level on storability of late season apple cultivars.
In: Fellman, J.K. (ed.), Proc. 5,h Int. Contr. Atm. Res. Conf., June 14-16 1989, Wenatchee,
Washington USA: 103-109.
Dadzie B.K., Banks N.H., Cleland D.J., Hewett E.W., 1993. Role of skin resistance to gas diffusion in
the response of fruits to modified atmospheres. Acta Hort., 343: 129-134.
Davies D.D., Grego S., Kenworthy P., 1974. The control of the production of lactate and ethanol in
higher plants. Planta, 118: 297-310.
Dixon N.M., Bell D.B., 1989. The inhibition by C0 2 of the growth and metabolism of micro-organisms.
J. Appl. Bact., 67: 109-136.
Draper N.R., Smith H., 1981. Applied Regression Analysis. 2nd edition,Wiley, New York: 484-485.
Emond J.P., Castaigne F., Desilets D., Toupin C , 1989. Mathematical modelling of gas exchange in
modified atmosphere package. Trans. ASAE: 1-18.
Fidler J.C., 1933.The accumulation of zymasis products inapples during senescence. BiochemJ.,27:
1614-1621.
Fidler J.C., North C.J., 1967. The effect of conditions of storage on the respiration of apples. J. Hort.
Sei., 42: 189-206.
Floras J.D., 1990. Controlled and modified atmospheres infood packaging and storage. Chem. Engin.
Progr., 6: 25-32.
Fox T.C., Kennedy R.A., Rumpho M.E., 1994. Energetics of plant growth under anoxia: metabolic
adaptations of Oryza sativa and Echinochloa phyllopogon. Ann. Bot., 74: 445-455.
Fox G.G., McCallan N.R., Ratcliffe R.G., 1995. Manipulating cytoplasmatic pH under anoxia: A critical
test of the role of pH in the switch from aerobic to anaerobic metabolism. Planta, 195: 324-330.
Frenkel C , Patterson M.E., 1973. Effect of carbon dioxide on activity of succinic dehydrogenase in
'Bartlett' pears during cold storage. HortSci., 8: 395-396.
Good A.G., Muench D.G., 1993. Long-term anaerobic metabolism in root tissue. Plant Physiol.,101:
1163-1168.
Gosselink R.J.A.,VanDamJ.E.G.,Zomers F.H.A.,1995.CombinedHPLCanalysisoforganicacidsand
furans formed during organosolv pulping of fiber hemp. J.Wood Chem.Techn., 15: 1-25.
Gran CD., Beaudry R.M., 1993. Determination of the low oxygen limit for several commercial apple
cultivars by respiratory quotient breakpoint. Posth. Biol. Techn., 3: 259-267.
Greenwood N.N., Earnshaw A. 1984. Chemistry of the elements. Pergamon Press.
145
Harren F.J.M., Reuss J., Woltering E.J, Bicanic D.D., 1990. Photoacoustic measurements of
agriculturally interesting gases and detection of C2H4 below the PPB level. Appl. Spectrosc, 44:
1360-1368.
Hayakawa K., Henig Y.S., Gilbert S.G., 1975. Formulae for predicting gas exchange of fresh produce
in polymeric film. J. Food Sei., 40: 186-191.
Hess B., Ke D., Kader A.A., 1993. Changes in intracellular pH,ATP, and glycolytic enzymes in 'Hass'
avocado in response to low 0 2 and high C0 2 stresses. In: Blanpied G.D., Bartsch J.A., Hicks J.R.
(eds), Proc. 6,h Int. Contr. Atm. Res. Conf., June 15-17 1993, Ithaca, New York USA: 1-9.
Isenberg F.M.R., 1979. Controlled atmosphere storage of vegetables. Hort, rev., 1:337-394.
Jameson J., 1995. CA storage technology - Recent developments and future potential. Eccher Zerbini
P., Woolfe M.L, Bertolini P., Haffner K., Hribar J., Höhn E., Somogyi Z. (eds), Proc. of COST94
workshop, 22-23 april 1993, Milan, Italy: 1-12.
Joles D.W., Cameron A.C., Shirazi A., Petracek P.D., Beaudry R.M., 1994. Modified-atmosphere
packaging of 'Heritage' red raspberry fruit: respiratory response to reduced oxygen, enhanced
carbon dioxide, and temperature. J.Amer. Soc. Hort. Sei., 119: 540-545.
Kader A.A., 1986. Biochemical and physiological basis for effects of controlled and modified
atmospheres on fruits and vegetables. Food Technol., 40: 99-104.
Kader A.A., 1989. Mode of action of oxygen and carbon dioxide on postharvest physiology of 'Bartlett
pears'. Acta Hort., 258: 161-167.
KaderA.A.,Zagory D., Kerbel E.L., 1989.Modifiedatmosphere packaging offruits andvegetables. Crit.
Rev. Food Sei. Nutr., 28: 1-30.
Kader A.A., 1993. A summary of CA requirements and recommendations for fruits other than pome
fruits. In: Blanpied G.D., Bartsch J.A., Hicks J.R. (eds), Proc. 6lh Int.Contr. Atm. Res. Conf., June
15-17 1993, Ithaca, New York USA: 859-887.
Kays S.J., 1991. Postharvest physiology of perishable plant products. An AVI book, Van Nostrand
Reinhold, New York.
Ke D., Van Gorsel H., Kader A.A., 1990. Physiological and quality responses of 'Bartlett' pears to
reduced0 2 andenhanced C0 2 levels andstoragetemperature.J.Amer. Soc.Hort.Sei., 115:435439.
Ke D., Rodriguez-Sinobas L, Kader A.A., 1991. Physiology and prediction of fruit tolerance to lowoxygen atmospheres. J. Amer. Soc. Hort. Sei., 116: 253-260.
Ke D., Mateos M., Kader A.A., 1993. Regulation of fermentative metabolism infruits and vegetables by
controlled atmospheres. In: Blanpied G.D., BartschJ.A., Hicks J.R. (eds), Proc.6lhInt.Contr.Atm.
Res. Conf., June 15-17 1993, Ithaca, New York USA: 63-77.
Ke D.,Yahia E., Hess B.,Zhou L, KaderA.A., 1995.Regulation offermentative metabolism inavocado
fruit under oxygen and carbon dioxide stresses. J. Amer. Soc. Hort. Sei., 120: 481-490.
Kennedy R.A., Rumpho M.E., FoxT.C., 1992.Anaerobic metabolism inplants. Plant Physiol., 100:1-6.
Kerbel E.L., Kader A.A., Romani R.J., 1990.Respiratory andglycolytic responseof suspension-cultured
'Passe Crassane' pear fruit cells to elevated C0 2 concentrations. J.Amer.Soc.Hort.Sei., 115:111114.
Kidd F., 1917. The retarding effect of carbon dioxide on respiration. Proc. Royal. Soc. London, B, 87:
36-156.
146
References
Kidd F., West C , 1923. Brown heart, afunctional disease of apples and pears. Special report no. 12,
Food inv. Board, Dep. Sei. Ind. Res.: 1-54.
Kidd F., West C , 1949. Resistance of the skin of the apple fruit to gaseous exchange. Rep. Food
Invest. Board 1939: 59-64.
KimmererT.W.,KozlowskiT.T., 1982.Ethylene,ethane,acetaldehyde,andethanolproductionbyplants
under stress. Plant Physiol., 69:840-847.
Kimmerer T.W., MacDonald R.C., 1987. Acetaldehyde and ethanol biosynthesis in leaves of plants.
Plant Physiol., 84: 1204-1209.
Knee M., 1980. Physiological responses of apples fruits to oxygen concentrations. Ann.Appl. Biol., 96:
243-253.
Knee M., Hatfield S.G.S., Farman D., 1990. Sources of variation and ester content of 'Cox' apples
stored in 2% oxygen. Ann.Appl. Biol., 116: 617-623.
Knee M., 1991a. Rapid measurement of diffusion of gas through the skin of apple fruits. HortSci.,26:
885-887.
Knee M., 1991b. Fruit metabolism and practical problems offruit storage under hypoxia and anoxia.In:
Jackson M.B., Davies D.D., Lambers H. (eds), Plant life under oxygen deprivation, pp 229-243.
SPB Academic Publ. b.v., The Hague, The Netherlands.
LarsenM.,Watkins C.B., 1995.Firmnessandconcentrations ofacetaldehyde,ethylacetateandethanol
in strawberries stored in controlled and modified atmospheres. Posth. Biol. Techn., 5: 39-50.
Laties G.G., 1995. Review Franklin Kidd, Charles West and F.F. Blackman: the start of modern
postharvest physiology. Posth. Biol. Technol., 5: 1-10.
Lebermann K.W., Nelson A.I.,Steinberg M.P., 1968.Postharvest changes of broccolistoredin modified
atmospheres. I Respiration of shoots and color of flower heads. Food Techn.,22: 487-518.
Lee D.S., Haggar P.E., Lee J., Yam K.L., 1991. Model for fresh produce respiration in modified
atmospheres based on principles of enzyme kinetics. J. Food Sei., 56: 1580-1585.
Lee L., Arul J., Lencki R., Castaigne F., 1995. A review on Modified Atmosphere Packaging and
preservation of freshfruits andvegetables: Physiological basis and practical aspects-Part I. Pack.
Technol. Sei., 8: 315-331.
Leshuk J.A., Saltveit M.E., 1991.Effects of rapid changes in oxygen concentration on the respiration
of carrot roots. Physiol. Plant., 82:559-568.
Li C , Kader A.A., 1989. Residual effects of controlled atmospheres on postharvest physiology and
quality of strawberries. J.Amer. Soc. Hort. Sei., 114:629-634.
LidsterP.D.,BlanpiedG.D.,LougheedE.C., 1985.Factorsaffectingtheprogressivedevelopmentoflowoxygen injury inapples. In: Blankenship S.M.(ed.),Proc.4lh Nat.Contr.Atm. Res.Conf.,Raleigh,
USA, Hortic. Rep. no 126: 57-69.
Lidster P.D., 1990. Storage humidity influences fruit quality and permeability to ethane in Mcintosh
apples stored in diverse controlled atmospheres. J.Am. Soc. Hort. Sei., 115: 94-96.
Little CR., Peggie I.D., 1987. Storage injury of pome fruit caused by stress levels of oxygen, carbon
dioxide, temperature, and ethylene. HortSci.22:783-790.
LougheedE.C., 1987.Interactionsofoxygen,carbondioxide,temperatureandethylenethatmayinduce
injuries in vegetables. HortSci., 22:791-794.
Luton M.T., Holland D.A., 1986.The effects of preharvest factors on the quality of stored Conference
pears. I. Effects of orchard factors. J. Hort. Sei., 61; 23-32.
147
Mannapperuma J.D., Zagory D., Kader A.A., 1989. Design of polymeric packages for modified
atmosphere storage of fresh produce. In: Fellman J.K. (ed.), Proc. 5th Int. Contr. Atm. Res. Conf.,
June 14-16 1989, Wenatchee, Washington USA: 225-233.
Mateos M., Ke D., Cantwell M., Kader A.A., 1993. Phenolic metabolism and ethanolic fermentation of
intact and cut lettuce exposed to C0 2 enriched atmospheres. Posth. Biol. Techn., 3: 225-233.
Meheriuk M., 1993. CA storage conditions for apples,pears and nashi. In: Blanpied G.D., Bartsch J.A.,
Hicks J.R. (eds), Proc. 6lh Int. Contr. Atm. Res. Conf., June 15-17 1993, Ithaca, New York USA:
819-858.
Meyer P.L., Sigrist M.W., 1990. Atmospheric pollution monitoring using CCylaser photoacoustic
spectroscopy and other techniques. Rev. Sei. Instrum., 61:1779-1807.
Nanos G.D., Romani R.J., Kader, A.A., 1992.Metabolic and other responses of 'Bartlett' pear fruit and
suspension-cultured 'Passe Crassane' pear fruit cells held in 0.25% 0 2 . J.Amer. Soc. Hort. Sei.,
117: 934-940.
North C.J., Cockbum J.T., 1975. Ethyl alcohol levels in apples after deprivation of oxygen and the
detectionofalcoholvapour inControlledAtmospherestoresusingindicatortubes.J.Sei.FdAgric,
26: 1155-1161.
North C.J., Bubb M., Cockbum J.T., 1977. Storage of Cox's Orange Pippin apples in low levels of
oxygen: effects of picking date. Ann. Rep. East Mailing Res. Stat, for 1976: 90-91.
ParkY.M., BlanpiedG.D.,Jowziak Z.,LiuF.W., 1993.Postharvest studies of resistancetogas diffusion
in Mcintosh apples. Posth. Biol. Technol. 2: 329-339.
Patterson M.E., NicholsW.C., 1988.Metabolic responseof'Delicious'applestocarbondioxide inanoxic
and low-oxygen atmospheres. HortSci., 23: 866-868.
Peppelenbos H.W., Van 't Leven J.,Van Zwol B.H., Tijskens, L.M.M., 1993. The influence of 0 2 and
C0 2 onthequality offreshmushrooms. In: BlanpiedG.D.,BartschJ.A., HicksJ.R. (eds),Proc.6th
Int. Contr. Atm. Res. Conf., June 15-17 1993, Ithaca, New York USA: 746-758.
Peppelenbos H.W., 1995. A systematic approach to research on Modified Atmosphere packaging of
produce. Proc. workshop COST94, October 1-2 1992, Istanbul,Turkey: 51-63.
Peppelenbos H.W., Van 't Leven J., 1996. Evaluation of four types of inhibition for modelling the
influence of carbon dioxide on oxygen consumption of fruits and vegetables. Posth. Biol.Techn.,
7: 27-40.
Peppelenbos H.W., Tijskens L.M.M., Van 't Leven J.,Wilkinson E.C., 1996. Modelling oxidative and
fermentative carbon dioxide production of fruits and vegetables. Posth. Biol. Techn., 9 (in press).
Peppelenbos H.W., JeksrudW.K., 1996.Amethodforthesimultaneous measurement of gas exchange
and diffusion resistance under various gas conditions. Acta Hort, (in press).
Perata P., AlpiA., 1991. Ethanol induced injuryto carrot cells.The roleof acetaldehyde. Plant Physiol.,
95: 748-752.
Perata P., Alpi A., 1993. Plant responses to anaerobiosis. Plant Sei., 93: 1-17.
Pesis E.,NgT.J., 1984.The roleofanaerobic respiration ingerminatingmuskmelonseeds.J.Exp.Bot.,
35: 356-365.
Pfister-Sieber M., Brandie R., 1994. Aspects of plant behaviour under anoxia and post-anoxia. Proc.
Royal Soc. Edinb., 102B: 313-324.
Pirt S.J., 1965. The maintenance energy of bacteria in growing cultures. Proc. Roy. Soc. London, B,
163: 224-231.
148
References
Platenius H., 1943. Effectof oxygenconcentrationontherespirationofsomevegetables.PlantPhysiol.,
18: 671-684.
Pradet A., Raymond P., 1983. Adenine nucleotide ratios and adenylate energy charge in energy
metabolism. Ann. Rev. Plant Physiol., 34: 199-224.
Rabbinge R., DeWitCT., 1989.Systems,modelsandsimulation.In:Rabbinge R.,WardS.A., VanLaar
H.H. (eds), Simulation and systems management in crop protection, Pudoc, Wageningen, The
Netherlands: 3-15.
Rajapakse N.C., Banks N.H., Hewett E.W., Cleland D.J., 1990. Development of oxygen concentration
gradients in flesh tissues of bulky plant organs. J.Amer. Soc. Hort. Sei., 115: 793-797.
Raymond P., Pradet A., 1980. Stabilization of adenine nucleotide ratios atvariousvalues byan oxygen
limitation of respiration in germinating lettuce (Lactuca sativa) seeds. BiochemJ., 190: 39-44.
Ricard B.,Couée I.,Raymond,P.,Saglio,P.H.,Saint-Ges,V., Pradet,A., 1994.Plantmetabolism under
anoxia. Plant Physiol. Biochem., 32: 1-10.
Rodriguez L , Zagory D., Kader A.A., 1989. Relation between gas diffusion resistance and ripening in
fruits. In: Fellman J.K. (ed.), Proc. 5,h Int. Contr. Atm. Res. Conf., June 14-16 1989, Wenatchee,
Washington USA: 1-7.
Ross G.J.S., 1990. Nonlinear Estimation, Springer Verlag, New York: 10.
Rubinow S.I., Segel L.A., 1991.Fundamental concepts in biochemical reaction theory. In: Biological
kinetics. Edited by L.A. Segel. Cambridge Univ. Press, Cambridge: 1-7.
Salisbury F.B., Ross C.W., 1985. Plant physiology. Third edition. Wadsworth Publ. Co., Belmont
California, USA.
Saltveit M.E., Ballinger W.E., 1983. Effects of anaerobic nitrogen and carbon dioxide atmospheres on
ethanol production and postharvest quality of 'Carlos' grapes.J.Amer. Soc. Hort. Sei., 108:462465.
Saltveit M.E., 1993. A summary of CA and MA requirements and recommendations for the storage of
harvested vegetables. In: Blanpied G.D., Bartsch J.A., Hicks J.R. (eds), Proc. 6th Int. Contr. Atm.
Res. Conf., June 15-17 1993, Ithaca, New York USA: 800-818.
Shipway M.R., Bramlage W.J., 1973. Effects of carbon dioxide on activity of apple mitochondria. Plant
Physiol., 51:1095-1098.
Smock R.M., 1977. Nomenclature for internal storage disorders of apples. HortScL, 12: 306-308.
Smock R.M., 1979. Controlled atmosphere storage of fruits. Hortic. Rev., 1:301-336.
Solomos T., 1987. Principles of gas exchange in bulky plant tissues. HortSci., 22: 766-771.
Song Y., Kim H.K., Yam K.L., 1992. Respiration rate of blueberry in modified atmosphere at various
temperatures. J.Amer. Soc. Hort. Sei., 117: 925-929.
Stoll K., 1975.The storage of vegetables incontrolled atmospheres. A review paper. Bull, de I'lnst. Int.
du Froid, 54: 1302-1324.
Stow J., 1989. The response of apples cv. Cox's Orange Pippin to different concentrations of oxygen
in the storage atmosphere. Ann. Appl. Biol., 114: 149-156.
Streif J., 1983. Experiences with ripening tests for apples. Acta Hort., 138: 63-67.
Stryer L. 1981.Biochemistry. 2nd edition, Freeman W.H. and Co., San Fransisco: 266-268.
Sun Chen A.-R., Chase T., 1993. Alcohol dehydrogenase 2 and pyruvate decarboxylase induction in
ripening and hypoxic tomato fruit. Plant Physiol. Biochem., 31:875-885.
149
Talasila P.C., Chau K.V., Brecht J.K., 1992. Effects of gas concentrations and temperature on 0 2
consumption of strawberries. Trans. ASAE, 35:221-224.
Talasila P.C., Cameron A.C., Joles D.W., 1994. Frequency distribution of steady-state oxygen partial
pressures inmodified-atmospherepackagesofcutbroccoli.J.Amer.Soc.Hort.Sei., 119:556-562.
Tesnière C , Romieu C , Dugelay I., Nicol M.Z., Flanzy C , Robin J.P., 1994. Partial recovery of grape
energy metabolism upon aeration following anaerobic stress. J. Exp. Bot., 45: 145-151.
Thomas M., 1925. A quantative study of the production of ethyl alcohol and acetaldehyde by cells of
the higher plants in relation to concentration of oxygen and carbon dioxide. BiochemJ., 19: 927947.
Thomas M., Fidler J.C, 1933.Zymasis by apples in relation to oxygen concentration. Biochem J.,27:
1629-1642.
Thornley J.H.M., 1970. Respiration, growth and maintenance in plants. Nature, 227:304-305.
Thornton N.C., 1933.Carbondioxidestorage. III.Theinfluence ofcarbondioxide onthe oxygen uptake
by fruits and vegetables. Contr. from Boyce Thompson Inst., 5: 371-402.
Tucker M.L., Laties G.G., 1985. The dual role of oxygen in avocado fruit respiration: Kinetic analysis
and computer modelling of diffusion-affected respiratory oxygen isotherms. Plant Cell Environ.,8:
117-127.
Turner J.S., 1951. Respiration. The Pasteur effect in plants. Ann. Rev. Plant. Physiol., 2: 145-168.
Trippi V.S., Gidrol X., Pradet, A., 1989. Effects of oxidative stress caused by oxygen and hydrogen
peroxide on energy metabolism and senescence in oat leaves. Plant Cell Physiol., 30: 157-162.
Varoquaux P., Albagnac G., Nguyen The C , Varoquaux F., 1996. Modified atmosphere packaging of
fresh beansprouts. J. Sei. Food Agric, 70:224-230.
Verbeek W., 1988. Physical and physiological data of fruits and vegetables. In:Product datafruits and
vegetables (in Dutch). Greidanus P., Verhoeven M.A. (eds), Announcement no. 30, Sprenger
Institute, Wageningen, The Netherlands.
Watada A.E.,Hemer R.C., KaderA.A., Romani R.J., Staby G.L., 1984.Terminology forthe description
of developmental stages of horticultural crops. HortSci., 19: 20-21.
Waters I., Morrell S., Greenway H., Colmer T.D., 1991. Effects of anoxia on wheat seedlings. II.
Influence of 0 2 supply prior to anoxia on tolerance to anoxia, alcohol fermentation, and sugar
levels. J. Exp. Bot., 42: 1437-1447.
Weichmann J., 1977. Physiological response of root crops to controlled atmospheres. In:Dewey D.H.
(ed.), Proc.2ndNat.Contr.Atm. Res.Conf., April5-7 1977,EastLansing,USA, Hort. Rep.28:667136.
Weichmann J., Brückner B., 1989. Measurement of oxygen partial pressure in stored plant organs by
Polarographie method.Acta Hort., 258: 169-176.
Wollin A.S., Little CR., Packer J.S., 1985. Dynamic control of storage atmospheres. In: Blankenship
S.M. (ed.): Proc. 4,h Nat. Contr. Atm. Res. Conf., Raleigh, USA., Hortic. Rep. 126: 308-315.
Woltering E.J.,HarrenF., Boerrigter H.A.M., 1988.Useofalaser-drivenphotoacousticdetection system
for measurement of ethylene production in Cymbidium flowers. Plant Physiol., 88: 506-510.
Yang C.C., Chinnan M.S., 1988. Modeling the effect of 0 2 and C0 2 on respiration and quality of stored
tomatoes. Trans. ASAE, 31:920-925.
Yang Y-S.,Chu D-C, Aizawa M„ Kim M., YamamotoT., 1995. Ethanol metabolism bytobacco callus
in vitro. Plant Sei., 104: 147-151.
150
References
Yearsly C.W., Banks N.H., Ganesh S., Cleland D.J., 1996. Determination of lower oxygen limits for
apple fruit. Posth. Biol. Techn.,8: 95-109.
Zhang Q., Greenway H., 1994. Anoxia tolerance and anaerobic catabolism of aged beetroot storage
tissues. J. Exp. Bot., 45: 567-575.
151
152
Publications relatedtothethesis
Peppelenbos H.W., 1995.Asystematic approachto researchonmodifiedatmosphere
packaging of produce. Proceedings European Concerted Action Cost94. 1-2
October 1992, Istanbul,Turkey:51-63.
Peppelenbos H.W., Leven J. van 't, 1996. Evaluation of four types of inhibition for
modellingthe influence ofcarbon dioxide onoxygen consumption offruits and
vegetables. Postharvest Biology and Technology, 7:27-40.
Peppelenbos H.W., Tijskens L.M.M.,van 't LevenJ.,Wilkinson E.C., 1996. Modelling
oxidative andfermentative carbon dioxide production of fruits andvegetables.
Postharvest Biology andTechnology, (in press).
Peppelenbos H.W., Rabbinge R., 1996. Relating respiratory characteristics of apples
and maintenance energy requirements to the tolerance to low oxygen
conditions. Journal of Horticultural Science,71 (6): (in press).
Peppelenbos H.W., JeksrudW.K., 1996.Amethodforthesimultaneous measurement
ofgasexchangeanddiffusion resistanceoffruitsandvegetables undervarious
gas conditions. Acta Horticulturae, (in press).
Peppelenbos H.W., Oosterhaven J., 1996. A theorethical approach on the role of
fermentation infruits and vegetables. Acta Horticulturae, (in press).
153
Other publications
GorrisL.G.M., Peppelenbos H.W., 1992.Modifiedatmosphereandvacuum packaging
to extendthe shelf life of respiring food products. HortTechnology, 2: 303-309
Marecek J., Peppelenbos H.W., Behlohlavek T., 1992. Comparing two different
methodsformeasuringthefirmnessofchampignons,in:Proceedingstrendsin
agricultural engineering, University of Agriculture, Prague: 336-341.
Gorris L.G.M., Peppelenbos H.W., 1993. Verlängerte Haltbarkeit von Obst und
Gemüse durch MA- oder Semi-Vakuum-Verpacken. Die Zeitschrift für die
Lebensmittlewirtschaft (ZFL),44:239-244.
Kooten O. van, Peppelenbos H.W., 1993. Predicting the potential to form roots on
chrysanthemumcuttingsduringstorageincontrolledatmospheres.Proceedings
ofthe6thInternationalControlledAtmosphere ResearchConference,14-16June
1993, Ithaca, New York.: 610-619.
Peppelenbos H.W., Leven J. van 't, Zwol B.H. van, Tijskens L.M.M., 1993. The
influence of0 2 andC0 2 onthequality offresh mushrooms. Proceedings ofthe
6th International Controlled Atmosphere Research Conference: 746-758.
Peppelenbos H.W.,van'tLevenJ., 1993.Luchtsamenstellinginverpakking beïnvloedt
bolkwaliteit. Bloembollencultuur, 7:34-35.
Peppelenbos H.W., 1994. Gassamenstelling beïnvloedt kwaliteit van groente en
fruit. Gewas, 1: 26-29.
Peppelenbos H.W., 1994. Gassamenstelling beïnvloedt de kwaliteit van geoogste
champignons. DeChampignoncultuur, 38:31-33.
Peppelenbos H.W., van 't Leven J., 1995. Lucht in bewaarcel beïnvloedt kwaliteit.
Groenten + Fruit, 24: 11.
BennikM.H.J.,Peppelenbos H.W., Ngyuen-TheC , CarlinF.,SmidE.J.,GorrisL.G.M.,
1996. Microbiology of minimally processed, modified atmosphere packaged
chicory endive. Posth.Biol. Techn., (in press).
154
Nawoord
Een onderdeel van het boekje dat een promoveren begeleidt is het duidelijk maken
aan de lezer dat de promotie, het boekje of het onderzoek onmogelijk was geweest
zonder hulp. Het is het moment bij uitstek om aan te geven dat de bijdrage van de
genoemdemensenweldegelijkgewaardeerdwordt.Bijkomendvoordeelisbovendien
dat het de prestatie van de promovendus wat relativeert.
Allereerst wil ikJolijn bedanken voor alletijd en ruimte die ze geboden heeft om mij
zoveel energie te laten besteden aan groente en fruit. Ze was en is een onmisbare
steunvoormij.Ookdelaatsteloodjesheeftzehelpendragen,dooraldietekstenwaar
ik inmiddels woordblind voor was geworden nog eens te corrigeren, en de layout te
verfraaien.
Mijnouders hebbenmijdekansgebodenengestimuleerdomtelerenentestuderen.
Hierbij wil ik ze dan ook bedanken voor de mogelijkheden die ze mij gunden en zelf
nooit hebben gehad.
Voor mijn promotor Rudy Rabbinge heb ik alle bewondering dat hij voor zo'n
stimulerende omgeving heeft gezorgdopTPE.Inhetbeginvanmijnonderzoek sprak
ik hem nauwelijks,wat mij de mogelijkheid gaf een andere richting opte gaan dan ik
eerst van plan was. Eenmaal die richting opgeslagen,wilde hij mij ineens veel vaker
zien, en wist hij het geheel zo te sturen dat er inderdaad iets promoveerbaars uit
voortkwam.
Mijnhoofdafdelingshoofd,OlafvanKooten,enmijnafdelingshoofd,KoosOosterhaven,
wilikhierbijhartelijkdankenvooralleinspanningendiezijvoorenachterdeschermen
hebben gepleegd om voor mij de ruimte te creëren die noodzakelijk was voor het
bedrijven van wetenschap. Koos was al eerder van plan om te promoveren en het
enthousiasme waarmee hijaandeslagging,werkte erg inspirerend. Ineens leek een
proefschrift toch wel een mooie afsluiting van een stuk onderzoek, in plaats van
gewoon een verplicht nummer.
Johanvan 't Leven heeft veeltijd gestopt invrijwel alle onderdelen van dit werk. Niet
alleenhetmetenvangasuitwisselingendiffusieweerstanden,maarookhetonderhoud
van demeetapparatuur, het uitwerken,het geduldig aanhorenvan dommeen slimme
155
theorieën, teveel om op te noemen. Als ik weer veel tijd moest stoppen in
proefvoorstellen, offertes, subsidieregelingen, potentiële opdrachtgevers,
vergaderingen,telefoontjes, rondleidingen enmeervandat productieve werk, ging hij
onverstoorbaardoormethetproducerenvanprachtigedataovergasuitwisseling.Even
langslopen bij hem in Q4 en ik kon er weer eventegen.
Sandra Robat nameind 1995dietaak moeiteloos over, enbleef maarademhalen (en
dataproduceren) waardoor iknaast alhet lopende praktische onderzoek ruimtebleef
houden voor werk zoals beschreven in dit proefschrift.
Mijn discussiegroepje op TPE wil ik hierbij bedanken voor het doorworstelen van de
eersteconceptenvanartikelen.Zonderaldieaanwijzingen,endelessendieik leerde
doorzelf artikelenkritischtemoetenbeoordelen,washetschrijvennogveel moeilijker
geweest.
Dankzij vele gesprekken en discussies, achter het bureau of in de wandelgangen,
hielpen mensen als Marjon Bennik, Leon Gorris, Alex van Schaik, Siem Schouten,
Eddy Smid,PolTijskens enClareWilkinson bijde interpretatie van alle gegevens die
uit het onderzoek voortkwamen.
Hierbij wil ik al ook mijn collega's op het ATO bedanken die ervoor gezorgd hebben
dat ik het ATO niet alleen als werkplek heb ervaren, maar ook als een prettige
omgeving, zoals Henry Boerrigter, Gerardvan den Boogaard, Harmannus Harkema,
Erik Koppenaal, Els Otma, Anneke Polderdijk en Chris van der Schoot.
I would also like to thank some foreigners who helped me throughout the years. In
1991 Honza Marecek did his best to teach me something on the physics of texture
measurements on mushrooms. In 1993 Olga Cardoso measured ethanol in different
treated apples. Willy Jeksrud came in 1993 without much knowledge of fruits and
vegetables, and developed himself as an expert on gas exchange and diffusion
resistance. Laure Brien developed in 1995 a method on the HPLC for measuring
fermentative metabolites,anddidherownresearchwithinafewmonths.Finallyatthe
end of 1995 I met Hanna Zuckermann, and was introduced in the world of
measurements attheppblevel. Thecooperationgavegoodresultsandformedabasis
for a lot of new (and nice) research.
Herman Peppelenbos
Ede,4 oktober 1996
156
Curriculum vitae
Herman (Willem) Peppelenbos werdgeboren op24mei 1963te Raalte,Overijssel.In
1981deedhijeindexamenAtheneum-BaanhetFlorensRadewijnsz.CollegeteRaalte,
waarnahij metdestudie Biologie begonaandetoenmalige Landbouw Hogeschoolte
Wageningen. In 1988 studeerde hij af, met als doctoraalvakken Hydrobiologie,
Luchthygiëne en-verontreinigingenInformatica.Eenstageperiodewerddoorgebracht
op het 'Aquatic Weed Lab' van de University of California in Davis. Tot juni 1990
vervuldehijzijnvervangendedienstbijden.v. KEMAteArnhem.Vanafjuli 1990werkt
hij bij het instituut voor AgroTechnologisch Onderzoek (ATO) te Wageningen. In de
eerste jaren verrichtte hij onderzoek dat gericht was op de invloed van gascondities
op de kwaliteit van groente, fruit, champignons en leliebollen. In 1992 werd dit werk
uitgebreid metonderzoek naardebeïnvloedingvanademhalingenfermentatie,ende
modellering daarvan. Dit proefschrift is een weergave van dat laatste.
157
© Copyright 2026 Paperzz