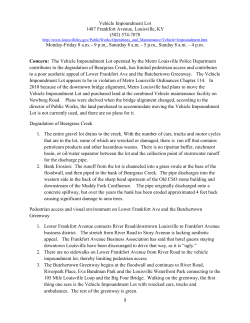
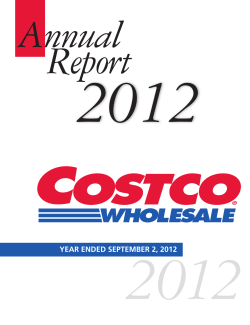
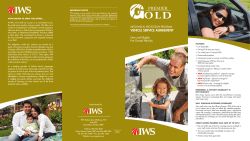
FISCAL YEAR 2005 CARMAX, INC. ANNUAL REPORT THE CARMAX ADVANTAGE® C A R M A X , I N C . I S T H E N AT I O N ’ S L A R G E S T R E TA I L E R O F U S E D V E H I C L E S . AT F E B R UA R Y 2 8 , 2 0 0 5 , C A R M A X O P E R AT E D 58 USED CAR SUPERSTORES IN 27 MARKETS, AS WELL AS SEVEN NEW CAR FRANCHISES, ALL OF WHICH WERE INTEG R AT E D O R C O - L O C AT E D W I T H I T S U S E D C A R S U P E R S T O R E S . C A R M A X R E TA I L E D 2 5 3 , 1 6 8 U S E D V E H I C L E S I N F I S C A L 2 0 0 5 , R E P R E S E N T I N G 9 2 % O F T H E TOTA L 2 7 3 , 8 0 4 V E H I C L E S R E TA I L E D BY T H E C O M PA N Y D U R I N G T H E Y E A R . ■■■■■1 2 3 4 5 6 COMPELLING MARKET SKILLED, D E D I C AT E D PEOPLE UNIQUE CONSUMER OFFER P R O P R I E TA R Y PROCESSES AND SY S T E M S STRONG R E S U LT S S O L I D G R OW T H OPPORTUNITY Huge Stable Non-Commodity Fragmented Competition Consumer Need See page 4. ■■Training and Development Above & Beyond Award Program ■See page 6. ■■■■Low, No-Haggle Prices Broad Selection Great Quality Customer-Friendly Service carmax.com® See page 8. ■■■■Information Systems Purchasing and Inventory Management Reconditioning Finance Originations ■■■■Revenues Earnings Return on Invested Capital Return on Shareholders’ Equity ■■■Growth Plan Defensible Competitive Advantage Outlook See page 14. See page 13. See page 10. C A R M A X M A R K E T S (as of May 1, 2005) A L A BA M A NEW MEXICO Birmingham Albuquerque CALIFORNIA NORTH CAROLINA Los Angeles (5) Sacramento Charlotte (2) Greensboro (2) Raleigh (2) F L O R I DA Jacksonville Miami (4) Orlando (2) Tampa (2) SOUTH CAROLINA Columbia Greenville TENNESSEE GEORGIA Atlanta (4) Knoxville Memphis Nashville ILLINOIS Chicago (8) U S E D C A R S U P E R S TO R E S � LARGE MARKETS (8) � MID-SIZED MARKETS (20) INDIANA Indianapolis K A N SA S Kansas City KENTUCKY Cover photo: CarMax’s Duarte used car superstore in Los Angeles, California. The company has opened three superstores in Los Angeles in the last 12 months, bringing to five the total number of superstores currently operated in this large market. Louisville N E VA DA Las Vegas (2) TEXAS Austin Dallas/Fort Worth (4) Houston (4) San Antonio VIRGINIA Richmond (2) WA S H I N GTO N , D . C . / BA LT I M O R E ( 4 ) FINANCIAL HIGHLIGHTS PERCENT CHANGE �04 TO �05 2005 OPERATING RESULTS Net sales and operating revenues Net earnings Separation costs* Net earnings excluding separation costs 14 % (3)% nm (3)% $5,260.3 $ 112.9 $ — $ 112.9 $4,597.7 $ 116.5 $ — $ 116.5 $3,969.9 $ 94.8 $ 7.8 $ 102.6 $3,533.8 $ 90.8 $ 0.4 $ 91.2 $2,758.5 $ 45.6 $ — $ 45.6 PER SHARE DATA Diluted earnings Separation costs* Diluted earnings excluding separation costs (3)% nm (3)% $ $ $ 1.07 — 1.07 $ $ $ 1.10 — 1.10 $ $ $ 0.91 0.07 0.98 $ $ $ 0.87 0.01 0.88 $ $ $ 0.44 — 0.44 (70)% 18 % $ 44.7 58 $ 148.5 49 $ 72.0 40 $ 42.6 35 $ 18.0 33 (Dollars in millions except per share data) OTHER INFORMATION Cash provided by operating activities Used car superstores, at year-end FISCAL YEARS ENDED FEBRUARY 28 OR 29 2004 2003* 2002* 2001 * Results for fiscal 2003 and fiscal 2002 include costs related to the October 2002 separation of CarMax from Circuit City Stores, Inc. nm = not meaningful COMPARABLE STORE USED UNIT SALES USED VEHICLES SOLD 132,868 13 253,168 224,099 190,135 1 6 8 $45.6 164,062 24 $112.9 05 $94.8 04 $2.76 $90.8 $116.5 (Percentage change) $5.26 $4.60 (In millions) $3.97 NET EARNINGS (In billions) $3.53 REVENUES 01 02 03 04 05 01 02 03 01 02 03 04 05 01 02 03 04 05 Forward-Looking Statements: Statements in this annual report about the company’s future business plans, operations, opportunities, or prospects, including without limitation any statements or factors regarding expected sales, margins, or earnings, are forward-looking statements made pursuant to the safe harbor provisions of the Private Securities Reform Act of 1995. Such forward-looking statements are based on management’s current knowledge and assumptions about future events and involve risks and uncertainties that could cause actual results to differ materially from anticipated results. For more details on factors that could affect expectations, see “Management’s Discussion and Analysis of Financial Condition and Results of Operations” contained in this annual report and the reports that the company files with or furnishes to the Securities and Exchange Commission. Separation: On October 1, 2002, CarMax, Inc. was separated from Circuit City Stores, Inc. and became an independent, separately traded public company. Details of the separation are discussed in the company’s Annual Report on Form 10-K for the fiscal year ended February 28, 2005. The consolidated financial statements and related information contained in this annual report are presented as if CarMax existed as a separate entity during all periods presented. STORE MANAGEMENT TEAMS TO OUR SHAREHOLDERS Austin Ligon, President and Chief Executive Officer WHERE WE ARE Fiscal 2005 was the most challenging year we have experienced since we curtailed growth in 1999 to concentrate on improving our business operations after three years of extremely rapid growth.Though total sales increased 14%, comparable store used unit sales increased only 1%, and net earnings declined 3%. In contrast to 1999, however, our performance measures indicate that the sales volatility and weakness that occurred from April through August were caused by market factors — not by execution deficiencies in our superstores or the pressures of growth. Even during the second fiscal quarter, our most difficult of the year, our analysis showed that we continued to gain market share. All our superstores, both established and new, experienced renewed sales and earnings strength beginning in the third quarter.The fourth quarter was a terrific finish for the year, with total sales up 25%, comparable store used unit sales up 12%, and net earnings up 32%. Our accomplishments in fiscal 2005 were many. ■Store Growth: Based on our confidence in our business model, we did not waiver from our plan to grow our store base 15% to 20% per year.We opened nine superstores in fiscal 2005, adding 18% to our store base. ■Consumer Finance: In August, after nine months of testing in a limited group of stores, we rolled out DRIVE Financial Services company-wide. DRIVE is a third-party finance provider focused on subprime customers.Though DRIVEfinanced cars provide us only 40% to 50% of the net margin contribution per car that other car sales do, we know that DRIVE-financed sales are truly incremental because these customers have been turned down by all our other finance providers.We estimate that DRIVE sales will be roughly 3% to 5% of annual used unit sales in the future. CarMax Auto Finance’s portfolio continued to be solidly prime-rated, highly unusual for a used car portfolio. Throughout fiscal 2005, CAF faced challenging income comparisons in an environment where funding costs rose more rapidly than consumer finance rates. Consequently, 2 CARMAX 2005 ■■CAF’s income was 3% below the fiscal 2004 level. CAF continues to adhere to its stringent credit requirements. As a result, the quality of its portfolio remains strong. Great Place to Work: Fortune magazine named CarMax to its prestigious “100 Best Companies to Work For” list for 2005.We are particularly pleased with this honor. Our customers have long known that CarMax is a great place to buy a car, and now they also know that CarMax is a great place to work. New Cars: We reached our goal to reduce our new car franchises to a core group of seven franchises with four major manufacturers: Toyota, DaimlerChrysler, Nissan, and General Motors. For the foreseeable future, we plan to operate these seven franchises to continue developing our strategic understanding of the new car business and to maintain our positive relationships with major manufacturers. O P E R AT I O N A L G OA L S The three broad operational goals we outlined last year continue to be areas of central focus for CarMax. We made significant progress in each this year: ■Quality: Further systematize our efforts at continuous quality improvement, with a particular emphasis on our reconditioning process. During fiscal 2005, we developed and launched the CarMax Quality Structure (CQS), a systematic framework and philosophy for analyzing, developing, and executing process improvement in our service and reconditioning operations. CQS is based on extensive analysis of the quality improvement processes of leading quality-focused companies, including Toyota, Nissan, Herman-Miller, and Viking.We have launched several initiatives under this framework. We also made significant ongoing process improvements in other areas of the business, including a new ■■in-store system to help sales consultants deliver more information consistently during the appraisal presentation to customers and a new sales management support system that helps sales managers monitor the most significant measures of customer service and sales performance on a real-time basis. Associate Development: Systematically identify, hire, train, and continuously develop a broadly diverse group of talented associates to support both our new store growth and continued operational improvement. During the year, we successfully generated more than 140 new managers to support growth, as well as more than 1,500 other talented associates. We also further developed the tracking process that is allowing us to plan, develop, and monitor the bench of talent we are building for the next four years of growth. Company Culture: Maintain an enthusiastic, down-to-earth, non-hierarchical business culture that treats every associate and every customer with the respect and personal attention they deserve, and lets us all have fun doing it. Being named to the Fortune “100 Best Companies to Work For” list was significant recognition of what we’ve achieved here. We also initiated a company-wide discussion of what should be retained, what should be discarded, and what should be added to the CarMax culture to keep us a healthy, effective, competitive company for the next decade. C O M M U N I T Y I N VO LV E M E N T We believe it’s important for CarMax to contribute to the communities where we live and work. Shortly after becoming independent, we formed the CarMax Foundation and began analyzing where and how we could have the most effective impact on our communities. In fiscal 2005, we made our first grants, totaling just over $1 million and focusing on three primary areas: ■At the national level, family automotive safety: We selected three organizations for focus in fiscal 2005: Mothers Against Drunk Driving (MADD), to expand the program to 15 college campuses; Safe, Smart Women (S2W), to expand car care and safety clinics aimed at young women ages 16 through 24; and Healthy Mothers, Healthy Babies, to expand booster seat education programs and to form a coalition to help develop uniform booster seat safety laws across the U.S. ■Richmond, education and youth development: Our hometown efforts in Richmond,Virginia, target organizations that focus on education and youth development, particularly among economically disadvantaged inner city youth.We provided grants to 29 organizations including Big Brothers, Big Sisters;The William Byrd Community Center;The Central Virginia Food Bank; and Voices for Virginia’s Children. ■Local, matching gifts and volunteer grants: Approximately one-third of our funds are reserved to support matching gifts by our associates to charitable organizations.We have also begun providing Teambuilding Volunteer grants to support groups of our associates who volunteer for local efforts such as Habitat for Humanity and Meals on Wheels, and we make significant grants to local charities as part of each CarMax grand opening. WHERE WE’RE GOING Growth Program Our growth plan calls for adding new superstores at an annual rate of 15% to 20%. Our focus since resuming growth in late fiscal 2002 has been to add fill-in stores in established markets and standard stores in new, mid-sized markets.These represent the lowest risk, highest early return opportunities, which have helped to offset the expense penalties of our growth program buildup. At year-end, we had opened 25 new superstores since resuming growth. In fiscal 2006, we will be completing our fourth full year of growth, and by mid-year fiscal 2007, we should be at a point of roughly “steady-state” growth as we begin to see each year a full annual cohort of stores reaching the appropriate sales and profit levels of basic maturity, which we define as 48 months.We then would no longer be suffering the added profit penalty of our growth ramp-up. Fiscal 2006 also marks the beginning of our entry into additional large multi-store markets with the launch of marketwide advertising in Los Angeles. Our growth program’s success to date, and a solid base of five stores with the opening of our Ontario and Irvine stores in April 2005, gives us confidence L.A. is the right place to restart our large market growth program.We’re very excited about building a full presence in the world’s largest auto retail market. Going forward, our growth program will include a mix of stores each year designed to balance the opening load across our regions and the risk and rewards of new versus established, and large versus small, markets. THANKS On behalf of myself, our shareholders, and our board of directors, I want to thank all 11,000+ CarMax associates for the tremendous job they did during the last year.They remained focused on executing the business and delivering for the customer despite the difficulties presented by the used car market overall. Ultimately, it is only through their efforts that we succeed as a company. Austin Ligon President and Chief Executive Officer March 30, 2005 CARMAX 2005 3 COMPELLING MARKET C A R M A X B E G A N W I T H A S E A R C H F O R A C O M P E L L I N G R E TA I L I D E A . W E L O O K E D F O R A L A R G E 1 R E TA I L C AT E G O R Y W I T H N O S I G N I F I C A N T N AT I O N A L C O M P E T I T O R S A N D P L E N T Y O F U N M E T CONSUMER NEEDS. EXTENSIVE RESEARCH SHOWED AN EXCELLENT OPPORTUNITY EXISTED IN AU TO M OT I V E R E TA I L I N G , E S P E C I A L LY I N U S E D C A R S . ■HUGE ■■■■With annual sales of approximately $367 billion, used vehicles comprise nearly half of the U.S. auto retail market, the largest retail segment of the economy. In 2004, there were an estimated 42.5 million used vehicles sold compared with 16.9 million new vehicles. CarMax’s primary focus—1- to 6-year-old vehicles—is a market estimated at $265 billion in annual sales and 20 million units per year. The used vehicle market is substantially bigger than other large retail categories such as the school and office products market ($199 billion in estimated annual sales) and the home improvement market ($271 billion in annual sales). The market for late-model used cars is generally resistant to typical economic cycles. As the economy improves, buyers who move from late-model used cars to new cars are replaced by buyers who move from older, higher mileage used cars to later model used cars. This stability provides the foundation for CarMax’s market share growth strategy in both existing and new markets. ■USED VEHICLE SALES STABILITY (Percentage change) 15 10 5 0 S TA B L E ■4 -5 Only twice in the last 20 years has the volume of used unit sales fluctuated by more than 3% from one year to the next, far less volatile than the annual change in new car units sold. CARMAX 2005 -10 -15 1986 1988 1990 1992 1994 % Change Used Vehicle Unit Sales Source: Manheim Auctions STORE MANAGEMENT TEAMS 1996 1998 2000 2002 2004 % Change New Vehicle Unit Sales F R AG M E N T E D C O M P E T I T I O N STABILITY PROVIDED BY CONSISTENT TURNOVER OF VEHICLES IN OPERATION ■Source: Manheim Auctions and ADESA, Inc. The U.S. used car marketplace is highly fragmented and includes about 21,650 franchised new car dealers and 49,900 independent dealers, as well as millions of private individuals. Our primary competitors are the 21,650 franchised new car dealers who sell the majority of late-model, 1- to 6-year-old used vehicles.These dealers focus primarily on new cars and secondarily on financing and service. Used car retailing is often a lower priority business for them. Independent dealers predominantly sell older, higher mileage cars than does CarMax. To date, there have been no successful, large-scale attempts to replicate the CarMax used car superstore model. NON-COMMODITY CONSUMER NEED (Percent annual turnover*) 25 20 ■15 10 5 0 93 94 95 96 97 98 99 00 01 02 03 04 ■1 out of 5 vehicles in operation in the U.S. changes hands annually. *Total used vehicle sales divided by total vehicles in operation ■■■Unlike new cars, every used car is unique, reflecting differences in mileage, condition, and age.This uniqueness provides CarMax the opportunity to add value. We carefully select the vehicles we offer for retail sale. Our choices are driven by our high quality standards and our exceptional understanding of consumer buying preferences at each of our superstores. Every retail vehicle undergoes a rigorous reconditioning process to ensure it meets our high quality standards. ■■■■Our consumer research confirms that most consumers dislike the traditional high-pressure sales tactics employed by many auto retailers. For more than 20 years, “car salesmen” have ranked last in the annual Gallup survey on the honesty and ethics of various professions. The CarMax customer-friendly consumer offer is unique in auto retailing.We eliminate the traditional adversarial relationship and let customers shop for cars the same way they shop at other “big-box” retailers. STORE MANAGEMENT TEAMS CARMAX 2005 5 SKILLED, DEDICATED PEOPLE C A R M A X ’ S S U C C E S S D E P E N D S O N T H E S K I L L E D A N D D E D I C AT E D P E O P L E W H O D E L I V E R O U R 2 C O N S U M E R O F F E R , E X E C U T E O U R P R O C E S S E S , A N D D E V E L O P O U R S Y S T E M S . T H E A S S O C I AT E S PICTURED THROUGHOUT THIS REPORT INCLUDE MEMBERS OF OUR STORE, REGION, AND C O R P O R AT E M A N AG E M E N T T E A M S , A N D T H E Y R E P R E S E N T T H E A P P R OX I M AT E LY 1 1 , 0 0 0 C A R M A X A S S O C I AT E S W H O C O N T R I B U T E T O O U R S U C C E S S E V E R Y D AY. TRAINING AND DEVELOPMENT ■■■■A B OV E & B E YO N D AWA R D P R O G R A M In any complex retail business, the primary challenge and limitation to growth is the ability to acquire, train, and develop people. We believe that the integrity and transparency of the CarMax consumer offer allows us to attract managers and associates with much more diverse backgrounds than the traditional auto retailer. We recruit the majority of our superstore managers from the top big-box retailers across the country, focusing on individuals with a broad, general management background and a successful career progression. We have formal training programs that span each of our four functional areas—sales, operations, buying, and business office.These programs include classroom and online training as well as formal mentoring assignments. Standardized training, procedures, and processes facilitate transfers between stores and regions. A B OV E & B E YO N D AWA R D W I N N E R S ■■■■In 2003, we created the Above & Beyond Award to recognize store associates who deliver exceptional customer service, “above & beyond” even CarMax’s high standards. Above & Beyond Award winners are selected each month based on customer feedback or nominations by co-workers or management.Winners receive a monetary award and company-wide recognition. This program is one example of the many ways that we are fostering an environment grounded in providing unparalleled service to our customers. The associates pictured at right represent a few of the Above & Beyond Award recipients for calendar 2004. ( C A L E N DA R 2 0 0 4 ) Adem Ahmed Amy Deleonardis Angel Gibson Tracy Gordon Jamell Love Sales Norcross (Atlanta) Business Office Greenville Operations Kansas City Business Office Houston North Customer Service Fayetteville Renae Angeloro Larry Fuller Ryan Gill Alina Henry Kelli McCray Customer Service South Boulevard (Charlotte) Service San Antonio Service Columbia Sales Naperville (Chicago) Sales South Boulevard (Charlotte) Will Dean Kyle Geist Jessica Gonzalez-Vega Bryan Jackson Delmy Melchor Service White Marsh (D.C./Baltimore) Sales Laurel (D.C./Baltimore) Business Office Orlando Service Louisville Sales Cypress Fair (Houston) 6 CARMAX 2005 JAMELL LOVE ADDIE RIZO E R I K S H AT Z E R NEHAD NAGEEB TIM SAJ TRACY GORDON ADEM AHMED RAFAEL SANABRIA JESSICA GONZALEZ-VEGA Mike Messer Stephene Payne Addie Rizo Ryan Schumacher George Smith Service Winston-Salem Service Dulles (D.C./Baltimore) Business Office Fort Lauderdale Sales South Boulevard (Charlotte) Sales Raleigh Sam Morales Juan Perez Tim Saj Ken Sexton Joe Williams Service Tinley Park (Chicago) Service Orlando Service South Boulevard (Charlotte) Service Nashville Sales Nashville Nehad Nageeb Dale Proctor Rafael Sanabria Erik Shatzer Sales Plano (Dallas/Fort Worth) Service Greenville Sales Charlotte Sales Kenosha (Chicago) CARMAX 2005 7 UNIQUE CONSUMER OFFER O U R B U S I N E S S I S N O T U N L I K E A N I C E B E R G . O U R U N I Q U E C O N S U M E R O F F E R I S W H AT D R AW S 4 3 CT H U ES TCOAMREMRAS XT O FOF EURR ISST OS R S ;C TI U T RIESD WAHRAT CA B ER SC EOERNE “A E .G”S HWOEWOE FVFEERR, T RE U OUN D NO U E QB UOI TVIEE ST H —E TWAT H O SEER TLHI N IN O USRTOKM E YE RPSR TOHC AT, E S S ETA S KAENNDTO S YGSETTEHME SR , “M BA E LKOE WU ST HUEN IWAT E ”TOA R E TA WIHLAT CU Q U EE RI LNI N AU I N GM. A K E O U R B U S I N E S S SUCCESSFUL. L OW, N O - H AG G L E P R I C E S ■■■■■8 B R OA D S E L E C T I O N We offer our best price up front and never haggle on any element of the sales transaction. The price of the vehicle is competitively low and clearly posted on the car, in the store, and on carmax.com. The price of the extended service plan is competitive and fixed, based primarily on the repair record of similar vehicles and the length of coverage. The price of the financing is competitive and no-haggle and is based on the finance company’s assessment of credit risk. Customers see each finance offer as it is made directly from the finance company and may choose among competing offers. The price offered on a “trade-in” is a written cash offer, based on the wholesale value of the vehicle, and our offer is good whether the customer buys from us or not.The offer is good for 7 days or 300 miles. CARMAX 2005 ■■■The average CarMax superstore has between 300 and 400 vehicles for sale, compared with approximately 90 used vehicles at the average new car dealer. Our primary focus is vehicles that are 1 to 6 years old, with fewer than 60,000 miles. For the most cost-conscious consumer, we also offer older, higher mileage ValuMax® cars that meet our same quality standards.ValuMax vehicles comprise approximately 15% of our inventory. Each store’s inventory is tailored to the buying preferences of the consumers in that store’s trade area. STORE MANAGEMENT TEAMS ■G R E AT Q UA L I T Y ■■■Every used vehicle we retail must meet stringent mechanical, electrical, and safety standards. Every used vehicle we retail is put through a thorough, 125-point inspection. Needed repairs are made and the car is thoroughly detailed inside and out to make it look and feel as close to new as possible. We stand behind our quality standards with our 5-day, 250-mile, money-back guarantee and our industryleading, 30-day limited warranty. We also offer extended service plans on every vehicle we retail that provide up to 6 years of coverage. ■CARMAX.COM® ■C U S TO M E R - F R I E N D LY S E R V I C E ■■We designed the CarMax offer to give consumers what they asked for: no-haggling on any aspect of the sale, broad selection, high quality, and a customerfriendly process. To ensure that sales consultant objectives are completely aligned with those of the customer, we base sales consultant commissions on a fixed dollars-per-unit standard. Consequently, the sales consultant’s only objective is to help customers find the right cars for their needs at prices they can afford. Our computerized inventory system makes it easy to search our vehicle inventory at each store or company-wide. There is no hand-off of customers to a finance manager or sales manager.The sales consultant helps the customer through the entire sales process. ■■■Carmax.com is a valuable marketing and research tool that allows customers to see a car’s photo, price, and specifications, as well as to make side-by-side vehicle comparisons, all from the comfort of home.We have sales consultants dedicated to caring for customers who contact us through the Internet. Using carmax.com, customers can browse our nationwide inventory of approximately 20,000 vehicles.This web-accessible inventory will continue to expand as we grow geographically. Virtually any used vehicle in our nationwide inventory can be transferred at customer request to their local superstore.Transfers are free within a market; longer-distance transfers include a charge to cover transportation costs. Currently, between 15% and 20% of our vehicles sold are transferred at customer request, and approximately 20% of retail sales are initiated through our Internet sales process. STORE MANAGEMENT TEAMS CARMAX 2005 9 PROPRIETARY PROCESSES AND SYSTEMS OUR BUSINESS IS NOT UNLIKE AN ICEBERG. OUR UNIQUE CONSUMER OFFER IS WHAT DRAWS CUSTOMERS 4 T O O U R S T O R E S ; I T I S W H AT C A N B E S E E N “A B O V E T H E WAT E R L I N E . ” H O W E V E R , O U R A S S O C I AT E S ’ D E V E L O P M E N T A N D U S E O F K E Y P R O C E S S E S A N D SY S T E M S “ B E L OW T H E WAT E R L I N E ” A R E W H AT M A K E OUR BUSINESS SUCCESSFUL — SOPHISTICATED PURCHASING AND INVENTORY MANAGEMENT, RECONDITIONING, AND FINANCE ORIGINATIONS, ALL SUPPORTED BY PROPRIETARY INFORMATION SYSTEMS. I N F O R M AT I O N SY S T E M S PROPRIETARY PROCESSES AND SYSTEMS ■Consumer Offer ■Purchasing/ Inventory Management Reconditioning IN 10 CARMAX 2005 FO RMA ■Finance Originations TION S E YST ■MS Our systems capture data on every aspect of our business. We collect data on activities such as: • Customer visits. • Sales consultant/customer engagements. • Appraisals. • Extended service plan sales. • Financings. Every retail vehicle is electronically tracked through its CarMax life from purchase through reconditioning and test drives to ultimate sale.We also capture data on vehicles we wholesale, helping us track market pricing changes. This information is used to continually enhance and refine our processes and systems, as well as to provide the basis for managing our associates’ performance. We believe our processes and systems provide us with a key competitive advantage.These enabling technologies have been developed over our more than 11-year history, and we are dedicated to their continuous improvement to maintain this competitive edge. STORE MANAGEMENT TEAMS P U R C H A S I N G A N D I N V E N TO R Y M A N AG E M E N T ■■■More than half the cars we retail are purchased directly from consumers, an excellent source of quality, highdemand vehicles. Customer vehicle purchases that do not meet our retail standards are sold at our own in-store auctions, which are an economic and efficient means of disposal. We have built a team of approximately 600 skilled buyers. The team includes 154 buyers who have each completed more than 10,000 appraisals and an additional 11 buyers who have surpassed the 20,000appraisal mark. Our buyers have online access to information on current inventory and recent sales, as well as wholesale industry information. Our high volume of in-store appraisals and outside auction purchases provides a great training ground that gives us an advantage compared with other used car retailers. Our inventory and pricing models help us: • Buy the mix of makes, models, age, mileage, and price points tailored to the buying preferences at each superstore. • Recommend pricing adjustments based on complex algorithms that take into account factors including sales history, consumer interest, and seasonal patterns. • Optimize inventory turns to help maintain gross margin dollars per unit and minimize the depreciation risk inherent in used cars. RECONDITIONING ■■■■■The majority of our service operation resources are used in vehicle reconditioning, which supports our used vehicle sales. We employ state-of-the-art production techniques, and we focus on balancing quality, speed, and cost. Our production planning process allows us to match reconditioning capacity and inventory demand across multiple stores. We are maximizing our service bay utilization by implementing 24/7 shift scheduling where appropriate. Over the past several years, we have reduced our work-in-process cycle time by 50% through our improved process and production techniques. Automotive technicians are in short supply in the U.S. We are able to attract and retain skilled technicians by offering a superior working environment, including air conditioned bays, a corporate benefit program, and the opportunity for career advancement. We also have developed an extensive in-house apprentice program. STORE MANAGEMENT TEAMS CARMAX 2005 11 ■F I N A N C E O R I G I N AT I O N S ■CarMax has created a unique finance origination process that provides significant customer benefits and competitive advantages. • The sales consultant collects the customer’s credit information and electronically submits the credit application to CarMax Auto Finance (“CAF”) and a third-party prime finance company. Applications are automatically rerouted to third-party nonprime finance companies and then to a subprime finance company if there are no other credit offers made. • Customers see each offer directly from the finance company, and, where multiple offers exist, they may choose the offer that best suits their needs. • We provide a 3-day payoff option, which gives customers up to three business days to replace the financing with cash or an alternative lending source, free of penalty or interest. • The sales consultant receives no commission on the finance process. ■12 CARMAX 2005 This structure reduces or eliminates two of the three risks inherent in used car lending. • The consumer risk—the customer’s willingness and ability to pay—is the basic risk borne by all lenders. • The collateral risk—the risk of the vehicle—is minimized by the consistent, high quality of our cars, the large percentage of vehicles covered by extended service plans, and the consistency of the relationship between wholesale and retail values for CarMax vehicles. CAF and our third-party finance companies have found they can rely on CarMax information to determine true vehicle worth. • The “intermediary” risk—the risk introduced by the person between the customer and the finance source— is eliminated at CarMax.There is no commission-driven finance manager to distort the facts on the price or quality of the vehicle or the consumer credit information.With the price of all components fixed, value-oriented, and non-negotiable at CarMax, both CAF and third-party finance companies benefit from superior information quality in making financing decisions. Having our own finance operation also reduces the sales risk associated with changes in third-party credit availability. REGION MANAGEMENT TEAMS STRONG RESULTS S I N C E O P E N I N G O U R F I R S T S T O R E I N S E P T E M B E R 1 9 9 3 , W E H AV E G R O W N T O M O R E T H A N 5 $ 5 B I L L I O N I N A N N U A L S A L E S I N T H E S H O R T S PA N O F 1 1 Y E A R S . O U R E C O N O M I C R E T U R N S A R E S I M I L A R T O M A N Y I N D U S T R Y - L E A D I N G , B I G - B O X R E TA I L E R S A N D S I G N I F I C A N T LY B E T T E R $5,260.3 10.8% 12.4% 8.5% (5.3)% (0.8)% (0.8)% (4.1)% 18.9% 15.2% 12.4% REGION MANAGEMENT TEAMS (6.7)% (9.1)% FY00 FY01 FY02 FY03 FY04 FY05 (4.9)% $(23.5) $(34.2) FY05 0.3% $1.1 FY97 FY98 FY99 FY00 FY01 FY02 FY03 FY04 $(9.3) $(5.2) FY95 FY96 FY97 FY98 FY99 18.2% RETURN ON SHAREHOLDERS’ EQUITY 20.7% $112.9 $116.5 FY00 FY01 FY02 FY03 FY04 FY05 $45.6 (In millions) $94.8 $90.8 EARNINGS (0.5)% FY95 FY96 FY97 FY98 FY99 FY95 FY96 FY97 FY98 FY99 FY00 FY01 FY02 FY03 FY04 FY05 $(4.1) 12.1% (Unleveraged) 12.7% $4,597.7 RETURN ON INVESTED CAPITAL 3.5% $2,758.5 $2,201.2 $1,607.3 $950.7 $566.7 $327.1 $93.5 (In millions) $3,533.8 REVENUES $3,969.9 T H A N T H E P U B L I C LY T R A D E D N E W C A R D E A L E R G R O U P S . ROE calculations not meaningful for periods prior to fiscal 1997. CARMAX 2005 13 SOLID GROWTH OPPORTUNITY B Y F O C U S I N G O N U S E D C A R S , C A R M A X C A N G R O W O R G A N I C A L LY, U N R E S T R A I N E D B Y F R A N C H I S E 6 L AW O R M A N U F A C T U R E R R E S T R I C T I O N S . A T T H E E N D O F F I S C A L 2 0 0 5 , W E H A D 5 8 U S E D C A R S U P E R S TO R E S I N 2 7 U . S . M A R K E T S , C OV E R I N G A P P R OX I M AT E LY 3 0 % O F T H E U . S . P O P U L AT I O N . W E B E L I E V E T H E C O M B I N AT I O N O F C O N T I N U E D G E O G R A P H I C E X PA N S I O N A N D M A R K E T S H A R E G A I N S R E S U LT I N G F R O M O U R C O N S U M E R - P R E F E R R E D C O N C E P T C A N F U E L G R OW T H F O R Y E A R S TO C O M E . ■G R OW T H P L A N ■■■We resumed our growth plan at the end of fiscal 2002, following a 2-year hiatus during which we focused on improving sales and profits. At the end of fiscal 2005, we had opened 25 superstores since resuming growth. These newer stores represent more than 40% of our total superstore base. We plan to open stores at an annual rate of approximately 15% - 20% of our used car superstore base. In the near term, the majority of our store openings will be superstores in new mid-sized markets and satellite superstores in existing markets. We define mid-sized markets as those with television viewing populations ranging from 1 million to 2.5 million.These markets are the easiest to enter from a real estate and advertising perspective, and historically they are where we have experienced 1 the fastest store ramp-up and profitability. We are adding satellite stores both in under-served trade areas in existing large markets and in established mid-sized markets to increase market share. Satellite stores are highly efficient because they are built on smaller sites and require little-to-no 58 incremental advertising. 49 STORE EXPANSION (Number of used car superstores) 40 33 CARMAX 2005 35 18 7 2 4 FY94 FY95 FY96 FY97 FY98 FY99 FY00 14 33 29 CORPORATE MANAGEMENT TEAM FY01 FY02 FY03 FY04 FY05 FY06 FY07 ■■■In fiscal 2006, we expect to open nine superstores, including five standard-sized stores and four satellite stores.We are adding two stores in Los Angeles, bringing our total store count in this large market to five and reaching, we believe, sufficient critical mass to support a full L.A. television advertising program. We estimate that we have an 8%-10% market share of late model, 1- to 6-year-old used cars within the trade areas of our most mature stores.This benchmark implies a $20 billion to $25 billion sales potential in today’s dollars as our stores reach maturity and we achieve full national scope. Our market share is significantly higher within a 5- to 10-mile radius of our most mature stores. Our satellite store additions will help us to determine incremental market share opportunities and optimal storing densities and patterns, and to identify opportunities in smaller markets. DEFENSIBLE COMPETITIVE A DVA N TAG E ■There have been numerous unsuccessful attempts to replicate the CarMax model. Competitors who have tried to copy our concept have typically failed because they focused only on our consumer concept.They ignored the hidden danger of failing to build strong operating processes early in concept development. ■■■At present, we are fortunate to have no similar-format, multi-market challengers.This advantageous competitive landscape is allowing us to expand on our own timetable, following our own strategic priorities. CarMax has a more than 11-year development advantage over any challenger who attempts to copy our business. Building an organization, developing specialized processes and systems, refining execution…all take time. CarMax intends to stay ahead of any potential competition through relentless attention to people, processes, and execution. OUTLOOK ■■For the forseeable future, we believe we can achieve average comparable store used unit growth in the range of 4% to 8% per year. This range assumes modest overall market growth, continued CarMax market share gains, and the effect of higher sales growth rates at stores that have not yet reached basic maturity. In fiscal 2006, we expect comparable store used unit growth in the range of 5% to 9% and earnings in the range of $1.20 to $1.30 per share. Our earnings growth is expected to be fueled by incremental gross profit contribution from both comparable and new store sales growth. CORPORATE MANAGEMENT TEAM CARMAX 2005 15 SELECTED FINANCIAL DATA FY05 FY04 FY03 FY02 FY01 FY00 FY99 FY98 FY97 FY96 Net sales and operating revenues $5,260.3 $4,597.7 $3,969.9 $3,533.8 $2,758.5 $2,201.2 $1,607.3 $950.7 $566.7 $327.1 Net earnings (loss) $ 112.9 $ 116.5 $ 94.8 $ 90.8 $ 45.6 $ 1.1 $ (23.5) $ (34.2) $ (9.3) $ (5.2) Basic $ 1.09 $ 1.13 $ 0.92 $ 0.89 $ 0.45 $ 0.01 $ (0.24) $ (0.35) $ (0.10) N/A Diluted $ 1.07 $ 1.10 $ 0.91 $ 0.87 $ 0.44 $ 0.01 $ (0.24) $ (0.35) $ (0.10) N/A (Dollars in millions except per share data) Net earnings (loss) per share: Total assets $1,293.0 $1,047.9 $ 917.6 $ 720.2 $ 711.0 $ 675.5 $ 571.2 $448.3 $427.2 $102.6 Long-term debt, excluding current installments $ 128.4 $ 100.0 $ 100.0 $ $ 83.1 $ 121.3 $ 139.7 $ 27.4 $ — $ 78.5 Used units sold 253,168 224,099 190,135 164,062 132,868 111,247 96,915 56,594 31,701 19,618 New units sold 20,636 21,641 22,360 24,164 20,157 17,775 6,152 4,265 2,799 — Comparable store used unit growth (%) 1 6 8 24 13 (8) (5) 6 7 12 Comparable store vehicle dollar growth (%) 3 6 6 28 17 2 (2) 6 23 12 Total used unit growth (%) 13 18 16 23 19 15 71 79 62 252 Total net sales and operating revenues growth (%) 14 16 12 28 25 37 69 68 73 250 Used car superstores at year-end 58 49 40 35 33 33 29 18 7 4 Retail stores at year-end 61 52 44 40 40 40 31 18 7 4 10,815 9,355 8,263 7,196 6,065 5,676 4,789 3,605 1,614 903 Associates at year-end 16 CARMAX 2005 — M A N AG E M E N T ’ S D I S C U S S I O N A N D A N A LY S I S The following Management’s Discussion and Analysis of Financial Condition and Results of Operations (“MD&A”) is intended to help the reader understand CarMax, Inc. MD&A is presented in nine sections: Business Overview; Critical Accounting Policies; Results of Operations; Operations Outlook; Recent Accounting Pronouncements; Financial Condition; Contractual Obligations; Market Risk; and Cautionary Information About Forward-Looking Statements. MD&A is provided as a supplement to, and should be read in conjunction with, our consolidated financial statements and the accompanying notes contained elsewhere in this annual report. In MD&A,“we,”“our,”“us,”“CarMax,” and “the company” refer to CarMax, Inc. and its wholly owned subsidiaries, unless the context requires otherwise. Amounts and percents in tables may not total due to rounding. BUSINESS OVERVIEW G e n e ra l CarMax is the nation’s largest retailer of used vehicles. The company was formerly a subsidiary of Circuit City Stores, Inc. (“Circuit City”). On October 1, 2002, the CarMax business was separated from Circuit City through a tax-free transaction and became an independent, separately traded public company. We pioneered the used car superstore concept, opening our first store in 1993. Over the next six years, we opened an additional 32 used car superstores before suspending new store development to focus on improving sales and profits. After a period of concept refinement and execution improvement, we resumed used car superstore growth in fiscal 2002, adding two stores late in the fiscal year, five stores in fiscal 2003, and nine stores in both fiscal 2004 and fiscal 2005. At the end of fiscal 2005, we had 58 used car superstores in 27 markets, including 8 large markets and 19 mid-sized markets. We believe the CarMax consumer offer is unique in the auto retailing marketplace. Our offer gives consumers a way to shop for cars in the same manner that they shop for items at other “big box” retailers. Our consumer offer is structured around four core equities, including low, no-haggle prices; a broad selection; high quality; and customer-friendly service. We generate revenues, income, and cash flows primarily by retailing used vehicles and associated items including vehicle financing, extended service plans, and vehicle repair service. A majority of the used vehicles we retail are purchased directly from consumers. Vehicles purchased through our appraisal process that do not meet our retail standards are sold at on-site wholesale auctions. Sales of new vehicles represented a decreasing percentage of our total revenues over the last four years as we divested new car franchises and added used car superstores. We expect to keep our seven remaining franchises in order to maintain long-term strategic relationships with automotive manufacturers. CarMax provides prime-rated financing to qualified customers through CarMax Auto Finance (“CAF”) and Bank of America. Nonprime financing is provided through three third-party lenders, and subprime financing is provided through a third-party lender under a program rolled out to our entire store base in August 2004. We periodically test additional third-party lenders. CarMax has no recourse liability for loans provided by third-party lenders. Having our own finance operation allows us to limit the risk of reliance on third-party finance sources, while also allowing us to capture additional profit and cash flows. The majority of CAF’s profit contribution is generated by the spread between the interest rates charged to customers and our cost of funds. We collect fixed, prenegotiated fees from the third parties that finance prime- and nonprime-rated customers. As is customary in the subprime finance industry, the subprime lender purchases loans at a discount. We sell extended service plans on behalf of unrelated third parties who are the primary obligors. We have no contractual liability to the customer under these third-party service plans. Extended service plan revenue represents commissions from the unrelated third parties. We are still at an early stage in the national rollout of our retail concept. We believe the primary driver for future earnings growth will be vehicle unit sales growth from comparable store sales increases and from geographic expansion. We target a roughly similar fixed dollar amount of gross profit per used unit, regardless of retail price. Used unit sales growth is our primary focus. In fiscal 2006, we plan to focus our store growth primarily on adding standard superstores in new mid-sized markets, which we define as those with television viewing audiences between 1 million and 2.5 million people, and satellite fill-in superstores in established markets. We also are broadening our store base in the Los Angeles market, with one additional superstore opened in fiscal 2005 and two additional superstores opened early in fiscal 2006, which gives us a total of five stores in the Los Angeles market. We plan to open used car superstores at a rate of approximately 15% to 20% of our used car superstore base each year. For the foreseeable future, we expect used unit comparable store sales increases to average in the range of 4% to 8%, reflecting the multi-year ramp in sales of newly opened stores as they mature and continued market share gains at stores that have reached base maturity sales levels. The principal challenges we face in expanding our store base include: 3 Our ability to procure suitable real estate at reasonable costs. 3 Our ability to build our management bench strength to support the store growth. We staff each newly opened store with an experienced management team, including a location general manager, operations manager, purchasing manager, and business office manager, as well as a number of experienced sales managers and buyers. We must therefore be continually recruiting, training, and developing managers and associates to fill the pipeline necessary to support future store openings. If at any time we believed that the rate of store growth was causing our performance to falter, we would consider slowing the growth rate. CARMAX 2005 17 Fiscal 2005 Highlights 18 3 Net sales and operating revenues increased 14% to $5.26 billion in fiscal 2005 from $4.60 billion in fiscal 2004, while net earnings decreased 3% to $112.9 million, or $1.07 per share, from $116.5 million, or $1.10 per share. 3 We opened nine used car superstores, including four standardsized stores in new markets and one standard-sized store and four satellite stores in existing markets. 3 Total used units increased 13%, primarily reflecting the growth in the store base. 3 Comparable store used units increased 1%. We experienced widespread sales volatility and softness in the first half of the year, caused, we believe, by a variety of external factors. Our business rebounded in the second half of the year, as many of these factors abated and we were able to convert stronger customer traffic levels into renewed sales and earnings growth. In addition, we benefited from the mid-year rollout of a third-party finance provider focused on subprime-rated customers, a segment that previously could not be financed at CarMax. 3 Our total gross profit margin was 12.4%, equal to the prior year, and our gross profit dollars per unit climbed slightly to $2,375 in fiscal 2005 from $2,323 in fiscal 2004. 3 CAF income was $82.7 million, 3% below the prior year, as the benefit of the growth in originations and managed receivables was more than offset by the decline in the gain as a percentage of loans sold (“gain spread”) to 3.8% in fiscal 2005 from 4.7% in fiscal 2004. The gain spread represents the difference between average interest rates charged customers and our cost of funds. 3 Selling, general, and administrative expenses as a percent of net sales and operating revenues (the “SG&A ratio”) increased to 10.4% in fiscal 2005 from 10.2% in fiscal 2004, reflecting the deleveraging effect of our first-half comparable store sales declines and the growing proportion of our store base that is comprised of stores not yet at base maturity. Stores generally have higher SG&A ratios during their first several years of operation. 3 We completed sale-leaseback transactions covering seven stores for total proceeds of $84.0 million. 3 Net cash provided by operations decreased to $44.7 million in fiscal 2005 from $148.5 million in fiscal 2004. The decrease primarily resulted from a $110.5 million increase in inventory in fiscal 2005, which included inventory for the nine stores opened during the fiscal year, three stores opened shortly after the end of the fiscal year, and inventory to support expected comparable store sales growth. In fiscal 2004, inventory levels remained relatively unchanged from those at the start of the year, despite opening nine stores during the year, as we were able to successfully reduce excess inventory that existed at the start of fiscal 2004. The excess inventory resulted from the adverse impact of severe weather on sales at the end of fiscal 2003. CARMAX 2005 CRITICAL ACCOUNTING POLICIES Our results of operations and financial condition as reflected in the company’s consolidated financial statements have been prepared in accordance with accounting principles generally accepted in the United States of America. Preparation of financial statements requires management to make estimates and assumptions affecting the reported amounts of assets, liabilities, revenues, expenses, and the disclosures of contingent assets and liabilities. We use our historical experience and other relevant factors when developing our estimates and assumptions. We continually evaluate these estimates and assumptions. Note 2 to the company’s consolidated financial statements includes a discussion of significant accounting policies. The accounting policies discussed below are the ones we consider critical to an understanding of the company’s consolidated financial statements because their application places the most significant demands on our judgment. Our financial results might have been different if different assumptions had been used or other conditions had prevailed. S e c u r i t i z a t i o n Tra n s a c t i o n s We use a securitization program to fund substantially all of the automobile loan receivables originated by CAF. The securitization transactions are accounted for as sales in accordance with Statement of Financial Accounting Standards (“SFAS”) No. 140, “Accounting for Transfers and Servicing of Financial Assets and Extinguishments of Liabilities.” A gain, recorded at the time of the securitization transaction, results from recording a receivable equal to the present value of the expected residual cash flows generated by the securitized receivables. The fair value of our retained interest in securitization transactions includes the present value of the expected residual cash flows generated by the securitized receivables, the restricted cash on deposit in various reserve accounts, and an undivided ownership interest in the receivables securitized through a warehouse facility and certain public securitizations. The present value of the expected residual cash flows generated by the securitized receivables is determined by estimating the future cash flows using management’s assumptions of key factors, such as finance charge income, default rates, prepayment rates, and discount rates appropriate for the type of asset and risk. These assumptions are derived from historical experience and projected economic trends. Adjustments to one or more of these assumptions may have a material impact on the fair value of the retained interest. The fair value of the retained interest may also be affected by external factors, such as changes in the behavior patterns of customers, changes in the economy, and developments in the interest rate markets. Note 2(C) to the company’s consolidated financial statements includes a discussion of accounting policies related to securitizations. Note 4 to the company’s consolidated financial statements includes a discussion of securitizations and provides a sensitivity analysis showing the hypothetical effect on the retained interest if there were variations from the assumptions used. In addition, see the “CarMax Auto Finance Income” section of this MD&A for a discussion of the impact of changing our assumptions. R eve n u e R e c o g n i t i o n We recognize revenue when the earnings process is complete, generally either at the time of sale to a customer or upon delivery to a customer. The majority of our revenue is generated from the sale of used vehicles. We recognize vehicle revenue when a sales contract has been executed and the vehicle has been delivered, net of a reserve for returns under our 5-day or 250-mile, money-back guarantee. A reserve for vehicle returns is recorded based on historical experience and trends. We also sell extended service plans on behalf of unrelated third parties to customers who purchase a vehicle. Because these third parties are the primary obligors under these programs, we recognize commission revenue on the extended service plans at the time of the sale, net of a reserve for estimated service plan returns. The estimated reserve for returns is based on historical experience and trends. The estimated reserves for returns could be affected if future occurrences differ from historical averages. I n c o m e Ta xe s Estimates and judgments are used in the calculation of certain tax liabilities and in the determination of the recoverability of certain of the deferred tax assets. In the ordinary course of business, many transactions occur for which the ultimate tax outcome is uncertain at the time of the transactions. We adjust our income tax provision in the period in which we determine that it is probable that our actual results will differ from our estimates. Tax law and rate changes are reflected in the income tax provision in the period in which such changes are enacted. We evaluate the need to record valuation allowances that would reduce deferred tax assets to the amount that will more likely than not be realized. When assessing the need for valuation allowances, we consider future reversals of existing temporary differences and future taxable income. We believe that all of our recorded deferred tax assets as of February 28, 2005, will more likely than not be realized. However, if a change in circumstances results in a change in our ability to realize our deferred tax assets, our tax provision would increase in the period when the change in circumstances occurs. In addition, the calculation of our tax liabilities involves dealing with uncertainties in the application of complex tax regulations. We recognize potential liabilities for anticipated tax audit issues in the U.S. and other tax jurisdictions based on our estimate of whether, and the extent to which, additional taxes will be due. If payments of these amounts ultimately prove to be unnecessary, the reversal of the liabilities would result in tax benefits being recognized in the period when we determine the liabilities are no longer necessary. If our estimate of tax liabilities proves to be less than the ultimate assessment, a further charge to expense would result in the period of determination. Information regarding income taxes is presented in Note 7 to the company’s consolidated financial statements. D e f i n e d B e n e f i t R e t i re m e n t P l a n The plan obligations and related assets of our defined benefit retirement plan are presented in Note 8 to the company’s consolidated financial statements. Plan assets, which consist primarily of marketable equity and debt instruments, are valued using current market quotations. Plan obligations and the annual pension expense are determined by independent actuaries using a number of assumptions provided by the company. Key assumptions used to measure the plan obligations include the discount rate, the rate of salary increases, and the estimated future return on plan assets. In determining the discount rate, we use the current yield on high-quality, fixedincome investments that have maturities corresponding to the anticipated timing of the benefit payments. Salary increase assumptions are based upon historical experience and anticipated future board and management actions. Asset returns are estimated based upon the anticipated average yield on the plan assets. We do not believe that any significant changes in assumptions used to measure the plan obligations are likely to occur that would have a material impact on the company’s financial position or results of operations. R E S U LT S O F O P E R AT I O N S Certain prior year amounts have been reclassified to conform to the current year’s presentation. N e t S a l e s a n d O p e ra t i n g R eve n u e s The components of net sales and operating revenues are presented in Table 1. TA B L E 1 — N E T SA L E S A N D O P E R AT I N G R E V E N U E S (In millions) Used vehicle sales New vehicle sales Wholesale vehicle sales Other sales and revenues: Extended service plan revenues Service department sales Third-party finance fees, net Appraisal purchase processing fees Total other sales and revenues Total net sales and operating revenues Years Ended February 28 or 29 2004 % 2005 % 2003 % $3,997.2 492.1 589.7 76.0 9.4 11.2 $3,470.6 515.4 440.6 75.5 11.2 9.6 $2,912.1 519.8 366.6 73.4 13.1 9.2 84.6 82.3 14.4 — 1.6 1.6 0.3 — 77.1 69.1 19.6 5.3 1.7 1.5 0.4 0.1 68.1 58.6 16.2 28.5 1.7 1.5 0.4 0.7 181.3 3.4 171.1 3.7 171.4 4.3 $5,260.3 100.0 $4,597.7 100.0 $3,969.9 100.0 CARMAX 2005 19 Retail vehicle sales changes were as follows: Years Ended February 28 or 29 2005 2004 2003 Vehicle units: Used vehicles New vehicles Total 13 % (5)% 11 % 18 % (3)% 16 % 16 % (7)% 13 % Vehicle dollars: Used vehicles New vehicles Total 15 % (5)% 13 % 19 % (1)% 16 % 17 % (7)% 12 % Comparable store used unit sales growth is one of the key drivers of our profitability. A CarMax store is included in comparable store sales in the store’s fourteenth full month of operation. Comparable store retail sales changes were as follows: Years Ended February 28 or 29 2005 2004 2003 Vehicle units: Used vehicles New vehicles Total 1% 8% 1% 6% (1)% 5% 8% (3)% 6% Vehicle dollars: Used vehicles New vehicles Total 3% 8% 3% 7% 1% 6% 8% (3)% 6% Used Vehicle Sales. The increases in used vehicle sales of 15% in fiscal 2005 and 19% in fiscal 2004 primarily reflect the opening of used car superstores not yet in our comparable store base. We opened five used car superstores in fiscal 2003, nine in fiscal 2004, and nine in fiscal 2005. During the first half of fiscal 2005, we experienced widespread volatility and softness in our used car business during the peak spring and summer selling season. We believe the soft market environment was the result of economic and other factors such as high gas prices; the intense competition and unpredictable incentive behavior among new car manufacturers; higher wholesale vehicle prices resulting, in part, from fewer off-lease vehicles; and severe weather in the southeastern United States. In the second half of fiscal 2005, used vehicle sales growth increased as many of the factors that appeared to cause the first half weakness abated. We experienced the strongest sales growth of the fiscal year in the fourth quarter, reinforcing our belief that the softness experienced during the first half of the year was due to external factors and was not indicative of issues related to the execution of our consumer offer, nor to the pressures of geographic expansion. 20 CARMAX 2005 Following a nine-month test in selected stores, in August 2004 we added DRIVE Financial Services to our group of third-party lenders. DRIVE provides subprime financing. DRIVE-financed sales added approximately 3% to our total used unit sales in fiscal 2005. We believe these were incremental sales that we previously would not have been able to finance. DRIVE-financed sales were highest in our fourth fiscal quarter, coinciding with the income tax-refund season. The fiscal 2004 used vehicle sales increase was due to the growth in comparable store used unit sales that resulted from strong sales execution and marketing programs, as well as the return to historical levels of nonprime approval rates by thirdparty lenders following the lower approval rates experienced in the fourth quarter of fiscal 2003. New Vehicle Sales. New vehicle sales were generally in line with industry performance for the core brands we represent— Chevrolet, DaimlerChrysler, Nissan, and Toyota. Declines in total new car sales and units are due primarily to the disposition of five new car franchises in fiscal 2005, four in fiscal 2004, and one in fiscal 2003. Wholesale Vehicle Sales. Our operating strategy is to build customer satisfaction by offering high-quality vehicles. Fewer than half of the vehicles acquired from consumers through the appraisal purchase process meet our standards for reconditioning and subsequent retail sale. Those vehicles that do not meet our standards are sold at our on-site wholesale auctions. Total wholesale vehicle units sold at these auctions were 155,393 in fiscal 2005; 127,168 in fiscal 2004; and 104,593 in fiscal 2003. In fiscal 2005, the increase in wholesale vehicle sales as a percentage of total net sales and operating revenues was due in large part to enhancements to the processes that our sales consultants use to deliver appraisals to customers and our systems support for buyers.We believe that these enhancements have contributed to the continuing increase in our rate of appraisal purchases completed per appraisal offers made. Additionally, higher average wholesale prices added to the wholesale vehicle sales increases. In fiscal 2004, the growth in wholesale vehicle sales reflected in part an increase in wholesale appraisal traffic resulting from increased consumer response to our vehicle appraisal offer. Other Sales and Revenues. Other sales and revenues include extended service plan revenues, service department sales, thirdparty finance fees, and, through the second quarter of fiscal 2004, appraisal purchase processing fees collected from customers on the purchase of their vehicles. During the second quarter of fiscal 2004, the appraisal purchase processing fees were replaced with an alternative method for recovering the costs of our appraisal and wholesale operations. Under the revised appraisal cost recovery (“ACR”) method, instead of charging the customer the appraisal purchase processing fee, we adjust the price of our purchase offer to allow for full recovery of our costs, thereby reducing the acquisition costs of used and wholesale vehicles and increasing used vehicle and wholesale vehicle gross profit margins. The intent of the revised ACR method is to recover all costs, including the related costs of land where we hold vehicles before their sale at the wholesale auctions. Overall, other sales and revenues growth is attributed to increases in extended service plan revenues, service department sales, and third-party nonprime finance fees. In fiscal 2005, the cost of providing subprime financing offset some of these increases. As is customary in the industry, subprime finance contracts are purchased from the company at a discount. We record this discount as an offset to third-party finance fees. Impact of Inflation. Inflation has not been a significant contributor to results. Profitability is based on achieving targeted unit sales and gross profit dollars per vehicle rather than on average retail prices. Seasonality. Most of our superstores experience their strongest sales in the spring and summer fiscal quarters. Supplemental Sales Information. R E TA I L U N I T SA L E S 2005 Years Ended February 28 or 29 2004 2003 Used vehicles New vehicles 253,168 20,636 224,099 21,641 190,135 22,360 Total 273,804 245,740 212,495 R E TA I L V E H I C L E SA L E S M I X 2005 Vehicle units: Used vehicles New vehicles Total Vehicle dollars: Used vehicles New vehicles Total Years Ended February 28 or 29 2004 2003 92% 8 91% 9 89% 11 100% 100% 100% 89% 11 87% 13 85% 15 100% 100% 100% R E TA I L S TO R E S As of February 28 or 29 2005 2004 2003 Mega superstores (1) Standard superstores (2) Satellite superstores (3) Co-located new car stores Standalone new car stores 13 29 16 3 — 13 24 12 3 — 13 19 8 2 2 Total 61 52 44 (1) (2) (3) 70,000 to 95,000 square feet on 20 to 35 acres. 40,000 to 60,000 square feet on 10 to 25 acres. 10,000 to 20,000 square feet on 4 to 7 acres. NEW CAR FRANCHISES AV E R AG E R E TA I L S E L L I N G P R I C E S 2005 Used vehicles New vehicles Total vehicles As of February 28 or 29 2005 2004 2003 Years Ended February 28 or 29 2004 2003 $15,663 $23,671 $16,267 $15,379 $23,650 $16,107 $15,243 $23,183 $16,078 Integrated/co-located new car franchises Standalone new car franchises Total 7 — 12 — 15 2 7 12 17 G ro s s P rof i t The components of gross profit margins and gross profit per unit are presented in Table 2. TA B L E 2 — G R O S S P R O F I T 2005 Years Ended February 28 or 29 2004 $ per unit(1) %(2) 2003 $ per unit(1) %(2) $ per unit(1) %(2) Used vehicle gross profit New vehicle gross profit Wholesale vehicle gross profit Other gross profit $1,817 860 464 366 11.5 3.6 12.2 55.3 $1,742 872 359 472 11.3 3.7 10.4 67.7 $1,648 931 192 534 10.8 4.0 5.5 66.5 Total gross profit $2,375 12.4 $2,323 12.4 $2,201 11.8 (1) (2) Calculated as category gross profit divided by its respective units sold, except the other and total categories, which are divided by total retail units sold. Calculated as a percentage of its respective sales or revenue. CARMAX 2005 21 Used Vehicle Gross Profit. In fiscal 2005, 2004, and 2003, we achieved our targets for gross profit dollars per unit. In fiscal 2005 and fiscal 2004, used vehicle gross profit per unit increased as a result of changing and refining the ACR methodology. New Vehicle Gross Profit. The declines in new vehicle margins in fiscal 2005 and fiscal 2004 reflect the heightened competitive market with strong manufacturers’ incentives, which required more aggressive pricing in order to drive unit sales volume. Wholesale Vehicle Gross Profit. The wholesale vehicle gross profit dollars per unit increased in fiscal 2005 and fiscal 2004 primarily due to the implementation of our revised ACR methodology and continuing refinements to that methodology. Under the revised ACR methodology, the acquisition cost of wholesale vehicles decreased resulting in higher wholesale gross profit. Other Gross Profit. The decline in other gross profit dollars per unit in fiscal 2005 and fiscal 2004 resulted from a combination of factors, including a decrease in fiscal 2005 service profits, the fiscal 2005 rollout of a subprime lender, and the fiscal 2004 elimination of appraisal purchase processing fees as part of the new ACR methodology. Service department sales is the only category within other sales and revenues that has an associated cost of sales. In fiscal 2005, service profits declined, reflecting, in part, the slower used vehicle sales pace and the associated deleveraging of service and reconditioning overhead costs. In fiscal 2005, third-party finance fees declined. Reflected as an offset to third-party finance fees, the discount at which our new subprime lender purchases installment contracts more than offset the growth in fees received from our other thirdparty lenders. C a r M a x Au t o F i n a n c e I n c o m e CAF provides prime auto financing for our used and new car sales. Because the purchase of an automobile is traditionally reliant on the consumer’s ability to obtain on-the-spot financing, it is important to our business that such financing be available to creditworthy customers. While financing can also be obtained from third-party sources, we believe that total reliance on third parties can create an unacceptable volatility and business risk. Furthermore, we believe that our processes and systems, the transparency of our pricing, and our vehicle quality provide a unique and ideal environment in which to procure high-quality auto finance receivables, both for CAF and for third-party lenders. CAF provides us the opportunity to capture additional profits and cash flows from auto loan receivables while managing our reliance on third-party finance sources. CAF income does not include any allocation of indirect costs or income. We present this information on a direct basis to avoid making arbitrary decisions regarding the indirect benefit or costs that could be attributed to this operation. Examples of indirect costs not included are retail store expenses, retail financing commissions, and corporate expenses such as human resources, administrative services, marketing, information systems, accounting, legal, treasury, and executive payroll. The components of CarMax Auto Finance income are presented in Table 3. TA B L E 3 — C A R M A X AU TO F I N A N C E I N C O M E 2005 (In millions) Gains on sales of loans % Years Ended February 28 or 29 2004 % 65.1 4.7 1.0 0.8 21.8 16.0 43.7 1.8 Direct CAF expenses: CAF payroll and fringe benefit expense Other direct CAF expenses 9.0 10.3 Total direct CAF expenses (1) $ 5.8 1.0 0.8 17.3 11.5 1.0 0.7 37.8 1.8 28.8 1.7 0.4 0.4 8.2 9.7 0.4 0.5 7.0 7.6 0.4 0.4 19.3 0.8 17.9 0.9 14.6 0.9 82.7 1.6 85.0 1.8 82.4 2.1 3.8 Other CAF income: Servicing fee income Interest income 24.7 19.0 Total other CAF income $ % 68.2 58.3 $ 2003 (2) (2) CarMax Auto Finance income $ Loans sold Average managed receivables Net sales and operating revenues Ending managed receivables balance $1,534.8 $2,383.6 $5,260.3 $2,494.9 (3) Percent columns indicate: (1) Percent of loans sold. (2) Percent of average managed receivables. (3) Percent of net sales and operating revenues. 22 CARMAX 2005 $ $1,390.2 $2,099.4 $4,597.7 $2,248.6 $ $1,185.9 $1,701.0 $3,969.9 $1,878.7 CAF originates automobile loans to CarMax customers at competitive market rates of interest. The majority of the profit contribution from CAF is generated by the spread between the interest rates charged to customers and our cost of funds. Substantially all of the loans originated by CAF each month are sold in securitization transactions as described in Note 4 to the company’s consolidated financial statements. A gain, recorded at the time of the securitization transaction, results from recording a receivable approximately equal to the present value of the expected residual cash flows generated by the securitized receivables. The cash flows are calculated taking into account expected prepayment and default rates. CarMax Auto Finance income declined 3% to $82.7 million in fiscal 2005, reflecting the decline in the gain spread to 3.8% in fiscal 2005 from 4.7% in fiscal 2004. As anticipated, this decrease in CAF income resulted primarily from a return to more normal gain spread levels, as CAF’s cost of funds increased more rapidly than consumer loan rates during the fiscal year. In fiscal 2004, CarMax Auto Finance income increased 3% to $85.0 million from $82.4 million in fiscal 2003, while the gain spread decreased to 4.7% from 5.8% in fiscal 2003. The increase in total CAF income was attributed to an increase in other CAF income, partially offset by gain spreads returning to more normalized levels during the second half of fiscal 2004. During fiscal 2003 and the first half of fiscal 2004, we benefited from higher-than-normal gain spreads resulting from consumer loan rates falling more slowly than our cost of funds. The increases in total other CAF income and total direct CAF expenses were proportionate to the increase in the managed receivables for all fiscal years presented. CAF’s fiscal 2005 gains on sales of loans include favorable impacts from both the May 2004 repurchase and subsequent sale into the warehouse facility of the remaining receivables related to the 2001–1 securitization, and the November 2004 adjustment in the valuation of the retained interest in securitized receivables. Excluding the impact of both of these items, the fiscal 2005 gain as a percent of loans sold was 3.7%. We exercised our option to repurchase the receivables outstanding in the 2001–1 securitization when the remaining balance of the receivables fell below 10% of the original pool balance. These loan balances carried relatively high interest rates that, combined with a relatively low short-term funding cost, resulted in an earnings benefit of approximately $0.01 per share. The favorable adjustment in the valuation of the retained interest reflected lower loss assumptions on certain newer pools of securitized receivables, contributing approximately $0.01 to earnings per share. We believe that the lower loss rates were the result of a combination of factors, including improved general economic conditions, the implementation of a new credit scorecard in the third quarter of fiscal 2003, and operational efficiencies resulting from systems enhancements. We are at risk for the performance of the managed securitized receivables to the extent that we maintain a retained interest in the receivables. Supplemental information on the portfolio of managed receivables is as follows: 2005 (In millions) Loans securitized Loans held for sale or investment As of February 28 or 29 2004 2003 $2,427.2 $2,200.4 $1,859.1 67.7 48.2 19.6 Ending managed receivables $2,494.9 $2,248.6 $1,878.7 Accounts 31+ days past due $ Past due accounts as a percentage of ending managed receivables $ $ (In millions) 31.1 1.24% 31.4 1.40% 27.6 1.47% Years Ended February 28 or 29 2005 2004 2003 Average managed receivables $2,383.6 $2,099.4 $1,701.0 Credit losses on managed receivables $ 19.5 $ 21.1 $ 17.5 Credit losses as a percentage of average managed receivables 0.82% 1.01% 1.03% We believe the decrease in credit losses as a percentage of average managed receivables in fiscal 2005 was due to a combination of factors, including improved general economic conditions, the implementation of a new credit scorecard in the third quarter of fiscal 2003, and operational efficiencies resulting from system enhancements. The recovery rate was 46% in fiscal 2005, 42% in fiscal 2004, and 43% fiscal 2003. The recovery rate represents the average percentage of the outstanding principal balance CarMax receives when a vehicle is repossessed and liquidated. If the managed receivables do not perform in accordance with the assumptions used in determining the fair value of the retained interest, earnings could be impacted. As previously discussed, in November 2004, we lowered our cumulative loss assumptions for certain newer pools of receivables, resulting in a favorable adjustment in the valuation of the retained interest and contributing approximately $0.01 to earnings per share. In fiscal 2004, we increased the cumulative loss assumptions for certain pools of older receivables and new originations. These changes had no material impact on fiscal 2004 earnings or the fair value of the retained interest. CARMAX 2005 23 S E L E C T E D Q UA R T E R LY F I N A N C I A L DATA ( U N AU D I T E D ) First Quarter 2005 2004 (In thousands except per share data) Net sales and operating revenues Gross profit CarMax Auto Finance income Selling, general, and administrative expenses Gain (loss) on franchise dispositions Net earnings Net earnings per share: Basic Diluted Second Quarter 2005 2004 Third Quarter 2005 2004 Fourth Quarter 2005 2004 Fiscal Year 2005 2004 $1,324,990 $1,172,835 $1,323,507 $1,236,457 $1,215,711 $1,071,534 $1,396,054 $1,116,865 $5,260,262 $4,597,691 $ 167,230 $ 147,771 $ 163,200 $ 163,105 $ 145,446 $ 126,242 $ 174,320 $ 133,770 $ 650,196 $ 570,888 $ 21,816 $ 25,748 $ 20,744 $ 22,677 $ 20,439 $ 17,649 $ 19,657 $ 18,889 $ 82,656 $ 84,963 $ 130,688 $ 115,553 $ 134,726 $ 120,714 $ 137,170 $ 114,282 $ 143,993 $ 117,825 $ 546,577 $ 468,374 $ $ — $ 35,330 $ — $ 35,260 $ (11) $ 29,859 $ (460) $ 39,610 $ 692 $ 18,045 $ 1,207 $ 19,053 $ (48) $ 29,694 $ $ $ 0.34 $ 0.33 $ 0.34 $ 0.34 $ 0.29 $ 0.28 $ 0.38 $ 0.37 $ 0.17 $ 0.17 $ 0.18 $ 0.18 $ 0.28 $ 0.28 $ S e l l i n g , G e n e ra l , a n d Ad m i n i s t ra t i ve E x p e n s e s The SG&A ratio was 10.4% in fiscal 2005, 10.2% in fiscal 2004, and 9.9% in fiscal 2003. As anticipated, the fiscal 2005, 2004, and 2003 SG&A ratios were adversely affected by the continuation of our store growth plan. During these three years, newer stores comprised an increasing percentage of our store base. New stores typically experience higher SG&A ratios during their first several years of operation. Additionally, the increase in the fiscal 2005 SG&A ratio reflects the deleveraging impact of lower comparable store unit sales experienced during the first half of the fiscal year. The increases in the fiscal 2005, fiscal 2004, and fiscal 2003 SG&A ratios also reflect the expected higher level of operating expenses associated with being a standalone company following the October 1, 2002, separation from Circuit City. We estimate standalone costs were approximately $3.0 million to $4.0 million higher in fiscal 2005 than in fiscal 2004, and approximately $13.5 million higher in fiscal 2004 than in fiscal 2003. A majority of these costs related to employee benefits and insurance. The SG&A ratio for fiscal 2003 also included costs of $7.8 million associated with the separation of CarMax from Circuit City. Excluding these costs, the SG&A ratio would have been 9.7% in fiscal 2003. 1,580 $ 633 $ 2,327 22,526 $ 112,928 $ 116,450 0.22 $ 0.21 $ 1.09 $ 1.07 $ 1.13 1.10 equipment of approximately $17.3 million. The impact on our consolidated financial statements for fiscal 2005 and prior fiscal years was immaterial. I n c o m e Ta xe s The effective income tax rate was 38.8% in fiscal year 2005, 38.5% in fiscal 2004, and 39.5% in fiscal 2003. The fiscal 2005 increase resulted from geographic expansion into states with higher income tax rates, including having a larger percentage of stores located in unitary tax states. The higher fiscal 2003 effective tax rate included the impact of non-tax-deductible costs associated with the October 1, 2002, separation from Circuit City. O P E R AT I O N S O U T L O O K C h a n g e s i n S t o re B a s e During the fiscal year ending February 28, 2006, we plan to expand our used car superstore base by approximately 16%, opening nine used car superstores. Planned entries into new mid-sized markets include Jacksonville, Fla.;Wichita, Kans.; Salt Lake City, Utah; and Virginia Beach, Va. Satellite superstore additions are planned for Miami, Fla.; Kansas City, Mo.; and Nashville, Tenn. In early fiscal 2006, we added a standard superstore and a satellite superstore in the Los Angeles market. Ac c o u n t i n g fo r L e a s e s In February 2005, the Securities and Exchange Commission (“SEC”) issued an open letter addressing issues regarding public companies’ accounting for leases and leasing activities. Of specific concern to the SEC were the appropriate accounting for the amortization of leasehold improvements, periods of free or reduced rents (“rent holidays”), and incentives provided by a lessor related to leasehold improvements. CarMax has reviewed its accounting for leases with regard to the SEC’s specific concerns and compliance with generally accepted accounting principles. As a result of our review, in the fourth quarter of fiscal 2005, we recognized cumulative expenses of $1.5 million before tax, or $0.01 per share, and recorded capital lease obligations and property and 24 CARMAX 2005 Fiscal 2006 Expectations The fiscal 2006 expectations discussed below are based on historical and current trends in our business and should be read in conjunction with the “Cautionary Information About Forward-Looking Statements” section of this MD&A. Fiscal 2006 Comparable Store Used Unit Growth. Assuming continuing healthy sales performance, we expect fiscal 2006 comparable store used unit growth in the range of 5% to 9%. We expect that the growth will be stronger in the first half of the fiscal year due to the relatively low level of comparable store used unit sales performance in the first half of fiscal 2005. Some of the economic and market factors that may have affected our sales in the first half of fiscal 2005 are still present in the market, including rising gasoline prices, increasing interest rates, wholesale vehicle prices rising somewhat faster than seasonal norms, and the potential for unpredictable new car manufacturer incentive behavior. Fiscal 2006 Earnings Per Share. We currently expect fiscal 2006 earnings per share in the range of $1.20 to $1.30. We expect CAF income to increase only slightly from the fiscal 2005 level, as projected continuing interest rate increases will likely cause our cost of funds to once again rise more rapidly than consumer rates. Consequently, we expect CAF’s gain spread for fiscal 2006 to be slightly below the normalized range of 3.5% to 4.5%. Our earnings expectations also reflect the cost to roll out marketwide advertising in Los Angeles for the first time as we open our fifth L.A. store. Finally, we expect between $2 million and $3 million in incremental costs related to separating our data center operation from Circuit City—the last cost expected to be added as a result of the separation. As a consequence of these higher costs, we would expect to see modest SG&A leverage only if we achieve the upper end of our expected comparable store used unit growth range. We currently expect our effective tax rate in fiscal 2006 to be approximately 38.4%. We plan to adopt SFAS 123R, “Share-Based Payment,” which modifies SFAS 123, “Accounting for Stock-Based Compensation,” in fiscal 2007, beginning March 1, 2006. This revised accounting standard requires that all stock-based compensation, including grants of employee stock options, be accounted for using a fair-value-based method and recorded as a charge to earnings. The company is in the process of determining the effect of adopting SFAS 123R. $181.3 million in fiscal 2004, and $122.0 million in fiscal 2003. The increase in capital expenditures reflects the increase in our store base associated with our growth plan. Additionally, a portion of the capital spending in fiscal 2005 and fiscal 2004 was associated with the construction of new corporate offices in Richmond, Va. Capital expenditures are funded through sale-leaseback transactions, short- and long-term debt, and internally generated funds. Net proceeds from sales of assets totaled $89.0 million in fiscal 2005, $107.5 million in fiscal 2004, and $41.6 million in fiscal 2003. The majority of the sale proceeds relate to saleleaseback transactions. In fiscal 2005, we entered into saleleaseback transactions involving seven superstore properties valued at approximately $84.0 million. In fiscal 2004, we entered into sale-leaseback transactions involving nine superstore properties valued at a total of $107.0 million. In fiscal 2003, we entered into one sale-leaseback transaction involving three superstore properties valued at approximately $37.6 million. These transactions were structured with initial lease terms of either 15 or 20 years with four, five-year renewal options. At February 28, 2005, we owned six superstores currently in operation, as well as land and construction-in-progress related to several planned superstores. In addition, we have five superstores that have been accounted for as capital leases. In fiscal 2006, we anticipate gross capital expenditures of approximately $250 million. Planned expenditures primarily relate to new store construction, including furniture, fixtures, and equipment; land purchases associated with future year store openings; new corporate offices; and leasehold improvements to existing properties. We expect to open nine used car superstores during fiscal 2006. RECENT ACCOUNTING PRONOUNCEMENTS For a discussion of recent accounting pronouncements applicable to the company, see Note 14 to the company’s consolidated financial statements. FINANCIAL CONDITION O p e ra t i n g Ac t i v i t i e s We generated net cash from operating activities of $44.7 million in fiscal 2005, $148.5 million in fiscal 2004, and $72.0 million in fiscal 2003. The fiscal 2005 decline primarily resulted from an increase in inventory, due to the addition of nine used car superstores during the year, three stores opened shortly after the end of the fiscal year, and inventory to support expected comparable store used unit growth. The fiscal 2004 improvement primarily resulted from the increase in net earnings and a slight decrease in inventory, despite having added nine used car superstores during the year. The decrease in inventory in fiscal 2004 reflected the combined effects of a higher-than-normal inventory balance at the end of fiscal 2003 resulting from weather-impeded sales in February 2003 and the disposal of four new car franchises during the fiscal year. I n ve s t i n g Ac t i v i t i e s Net cash used in investing activities was $141.1 million in fiscal 2005, $73.8 million in fiscal 2004, and $80.4 million in fiscal 2003. Capital expenditures were $230.1 million in fiscal 2005, F i n a n c i n g Ac t i v i t i e s Net cash provided by financing activities was $63.8 million in fiscal 2005. In fiscal 2004, net cash used in financing activities was $47.6 million, compared with net cash provided of $39.8 million in fiscal 2003. In fiscal 2005, we increased short-term debt by $60.8 million primarily to fund increased inventory. In fiscal 2004, we used cash generated from operations to reduce total outstanding debt by $51.6 million. In fiscal 2003, we increased total outstanding debt by $67.6 million and paid a one-time dividend of $28.4 million to Circuit City in conjunction with the separation transaction. The aggregate principal amount of automobile loan receivables funded through securitizations, which are discussed in Notes 3 and 4 to the company’s consolidated financial statements, totaled $2.43 billion at February 28, 2005, $2.20 billion at February 29, 2004, and $1.86 billion at February 28, 2003. During fiscal 2005, we completed two public automobile loan securitizations totaling $1.15 billion. At February 28, 2005, the warehouse facility limit was $825.0 million and unused warehouse capacity totaled $162.5 million. The warehouse facility matures in June 2005. Note 2(C) and Note 4 to the company’s consolidated financial statements include a discussion of the warehouse facility. We anticipate that we will be able to renew, expand, or enter into new securitization arrangements to meet the future needs of the automobile finance operation. CARMAX 2005 25 We maintain a $300 million credit facility secured by vehicle inventory. As of February 28, 2005, the amount outstanding under this credit facility was $165.2 million, with the remainder fully available to the company. See Note 9 to the company’s consolidated financial statements for discussion of expiration, renewals, and covenants associated with this facility. We expect that proceeds from securitization transactions; sale-leaseback transactions; current and, if needed, additional credit facilities; and cash generated by operations will be sufficient to fund capital expenditures and working capital for the foreseeable future. O f f - B a l a n c e S h e e t A r ra n g e m e n t s CAF provides prime auto financing for our used and new car sales.We use a securitization program to fund substantially all of the automobile loan receivables originated by CAF. We sell the automobile loan receivables to a wholly owned, bankruptcyremote, special purpose entity that transfers an undivided interest in the receivables to a group of third-party investors. This program is referred to as the warehouse facility. We periodically use public securitizations to refinance the receivables previously securitized through the warehouse facility. In a public securitization, a pool of automobile loan receivables is sold to a bankruptcy-remote, special purpose entity that in turn transfers the receivables to a special purpose securitization trust. Additional information regarding the nature, business purposes, and importance of our off-balance sheet arrangement to our liquidity and capital resources can be found in the CarMax Auto Finance Income, Financial Condition, and Market Risk sections of this MD&A, as well as in Notes 3 and 4 to the company’s consolidated financial statements. MARKET RISK Au t o m o b i l e I n s t a l l m e n t L o a n R e c e i va b l e s At February 28, 2005, and February 29, 2004, all loans in the portfolio of automobile loan receivables were fixed-rate installment loans. Financing for these automobile loan receivables is achieved through asset securitization programs that, in turn, issue both fixed- and floating-rate securities. Interest rate exposure relating to floating-rate securitizations is managed through the use of interest rate swaps. Receivables held for investment or sale are financed with working capital. Generally, changes in interest rates associated with underlying swaps will not have a material impact on earnings. However, changes in interest rates associated with underlying swaps may have a material impact on cash and cash flows. Credit risk is the exposure to nonperformance of another party to an agreement. Credit risk is mitigated by dealing with highly rated bank counterparties. The market and credit risks associated with financial derivatives are similar to those relating to other types of financial instruments. Refer to Note 5 to the company’s consolidated financial statements for a description of these items. The total principal amount of managed receivables securitized or held for investment or sale was as follows: As of February 28 or 29 2005 2004 (In millions) Fixed-rate securitizations Floating-rate securitizations synthetically altered to fixed Floating-rate securitizations Held for investment(1) Held for sale(2) $1,764.7 $1,647.9 662.1 0.4 45.5 22.2 551.8 0.7 29.4 18.8 Total $2,494.9 $2,248.6 (1) (2) The majority is held by a bankruptcy-remote special purpose entity. Held by a bankruptcy-remote special purpose entity. C O N T R AC T UA L O B L I GAT I O N S Total (In millions) As of February 28, 2005 1 to 3 Years Revolving loan Term loan Capital leases(1) Operating leases(1) Purchase obligations(2) $ 65.2 100.0 64.6 890.3 71.4 $ 65.2 — 3.2 61.3 41.2 $ Total $1,191.5 $170.9 $250.7 (1) (2) 26 Less than 1 Year — 100.0 6.7 120.8 23.2 3 to 5 Years $ — — 6.9 122.0 7.0 $135.9 More than 5 Years $ — — 47.9 586.1 — $634.0 See Note 12 to the company’s consolidated financial statements. Purchase obligations include certain enforceable and legally binding obligations related to the purchase of real property, third-party outsourcing services, construction services related to our new corporate offices, and certain automotive reconditioning products. CARMAX 2005 I n t e re s t R a t e E x p o s u re We also have interest rate risk from changing interest rates related to our outstanding debt. Substantially all of the debt is floating-rate debt based on LIBOR. A 100-basis point increase in market interest rates would not have had a material effect on our fiscal 2005 results of operations or cash flows. C AU T I O N A R Y I N F O R M AT I O N A B O U T F O R WA R D - L O O K I N G S TAT E M E N T S The provisions of the Private Securities Litigation Reform Act of 1995 provide companies with a “safe harbor” when making forward-looking statements. This safe harbor encourages companies to provide prospective information about their business without fear of litigation.The company wishes to take advantage of the safe harbor provisions of the Act. Company statements that are not historical facts, including statements about management’s expectations for fiscal 2006 and beyond, are forward-looking statements and involve various risks and uncertainties. Forward-looking statements are estimates and projections reflecting our judgment and involve a number of risks and uncertainties that could cause actual results to differ materially from those suggested by the forward-looking statements. Although we believe that the estimates and projections reflected in the forward-looking statements are reasonable, our expectations may prove to be incorrect. Investors are cautioned not to place undue reliance on any forward-looking statements, which are based on current expectations. Important factors that could cause actual results to differ materially from estimates or projections contained in our forward-looking statements include: 3 In the normal course of business, we are subject to changes in general U.S. or regional U.S. economic conditions including, but not limited to, consumer credit availability, consumer credit delinquency and default rates, interest rates, gasoline prices, inflation, personal discretionary spending levels, and consumer sentiment about the economy in general. Any significant changes in economic conditions could adversely affect consumer demand and/or increase costs resulting in lower profitability for the company. 3 The company operates in a highly competitive industry and new entrants to the industry could result in increased wholesale costs for used vehicles and lower-than-expected vehicle sales and margins. 3 Any significant changes in retail prices for used and new vehicles could result in lower sales and margins for the company. 3 A reduction in the availability or access to sources of inventory would adversely affect the company’s business. 3 Should excess inventory develop, the inability to liquidate excess inventory at prices that allow the company to meet its margin targets or to recover its costs would adversely affect the company’s profitability. 3 The ability to attract and retain an effective management team in a dynamic environment and the availability of a suitable work force is vital to the company’s ability to manage and support its service-driven operating strategies. The inability to attract such a workforce team or a significant increase in payroll market costs would adversely affect the company’s profitability. 3 The company’s business is dependent upon the efficient operation of our information systems. The failure of our information systems to perform as designed or the failure to maintain and continually enhance or protect the integrity of these systems could disrupt the company’s business, impact sales and profitability, or expose us to customer or thirdparty claims. 3 Changes in the availability or cost of capital and working capital financing, including the availability of long-term financing to support development of the company and the availability of securitization financing, could adversely affect the company’s growth and operating strategies. 3 A decrease in the availability of appropriate real estate locations for expansion would limit the expansion of the company’s store base and the company’s future operating results. 3 The occurrence of weather events adversely affecting traffic at our retail locations could negatively impact the company’s operating results. 3 The occurrence of certain material events including natural disasters, acts of terrorism, the outbreak of war, or other significant national or international events could adversely affect the company’s operating results. 3 The imposition of new restrictions or regulations regarding the sale of products and/or services that the company sells, changes in tax or environmental rules and regulations applicable to the company or our competitors, or any failure to comply with such laws or any adverse change in such laws could increase costs and affect the company’s profitability. 3 We are subject to various litigation matters, which, if the outcomes in any significant matters are adverse, could negatively affect the company’s business. CARMAX 2005 27 C O N S O L I DAT E D S TAT E M E N T S O F E A R N I N G S 2005 %(1) Years Ended February 28 or 29 2004 %(1) $3,997,218 492,054 589,704 181,286 76.0 9.4 11.2 3.4 $3,470,615 515,383 440,571 171,122 5,260,262 4,610,066 100.0 87.6 Selling, general, and administrative expenses (NOTE 15) Gain on franchise dispositions, net Interest expense (NOTE 9) Interest income 650,196 82,656 546,577 633 2,806 421 Earnings before income taxes Provision for income taxes (NOTE 7) 2003 %(1) 75.5 11.2 9.6 3.7 $2,912,082 519,835 366,589 171,438 73.4 13.1 9.2 4.3 4,597,691 4,026,803 100.0 87.6 3,969,944 3,501,705 100.0 88.2 12.4 1.6 10.4 — 0.1 — 570,888 84,963 468,374 2,327 1,137 683 12.4 1.8 10.2 0.1 — — 468,239 82,399 392,417 — 2,261 737 11.8 2.1 9.9 — 0.1 — 184,523 71,595 3.5 1.4 189,350 72,900 4.1 1.6 156,697 61,895 3.9 1.6 $ 112,928 2.1 $ 116,450 2.5 94,802 2.4 (In thousands except per share data) SALES AND OPERATING REVENUES: Used vehicle sales New vehicle sales Wholesale vehicle sales Other sales and revenues NET SALES AND OPERATING REVENUES Cost of sales GROSS PROFIT CARMAX AUTO FINANCE INCOME (NOTES 3 and 4) NET EARNINGS Weighted average common shares (NOTE 11): Basic Diluted $ 103,503 105,628 104,036 105,779 102,983 104,570 NET EARNINGS PER SHARE (NOTE 11): Basic Diluted (1) 1.09 1.07 $ $ 1.13 1.10 Percents are calculated as a percentage of net sales and operating revenues and may not equal totals due to rounding. See accompanying notes to consolidated financial statements. 28 $ $ CARMAX 2005 $ $ 0.92 0.91 C O N S O L I DAT E D BA L A N C E S H E E T S At February 28 or 29 2005 (In thousands except share data) 2004 ASSETS CURRENT ASSETS: Cash and cash equivalents (NOTE 2) Accounts receivable, net Automobile loan receivables held for sale (NOTE 4) Retained interest in securitized receivables (NOTE 4) Inventory Prepaid expenses and other current assets $ 29,099 76,167 22,152 147,963 576,567 13,008 $ 61,643 72,358 18,781 145,988 466,061 8,650 864,956 406,301 — 21,756 773,481 251,459 185 22,762 $1,293,013 $1,047,887 $ 170,646 65,664 1,179 26,315 65,197 330 $ 145,517 55,674 4,050 32,711 4,446 — Long-term debt, excluding current installments (NOTE 9) Deferred revenue and other liabilities Deferred income taxes (NOTE 7) 329,331 128,419 29,260 5,027 242,398 100,000 24,736 — TOTAL LIABILITIES 492,037 367,134 Common stock, $0.50 par value; 350,000,000 shares authorized; 104,303,375 and 103,778,461 shares issued and outstanding at February 28, 2005, and February 29, 2004, respectively Capital in excess of par value Retained earnings 52,152 489,164 259,660 51,889 482,132 146,732 TOTAL SHAREHOLDERS’ EQUITY 800,976 680,753 — $1,293,013 — $1,047,887 TOTAL CURRENT ASSETS Property and equipment, net (NOTE 6) Deferred income taxes (NOTE 7) Other assets (NOTE 15) TOTAL ASSETS LIABILITIES AND SHAREHOLDERS’ EQUITY CURRENT LIABILITIES: Accounts payable Accrued expenses and other current liabilities (NOTE 15) Accrued income taxes Deferred income taxes (NOTE 7) Short-term debt (NOTE 9) Current installments of long-term debt (NOTE 9) TOTAL CURRENT LIABILITIES SHAREHOLDERS’ EQUITY (NOTES 1 AND 10): Commitments and contingent liabilities (NOTES 8, 9, 12, AND 13) TOTAL LIABILITIES AND SHAREHOLDERS’ EQUITY See accompanying notes to consolidated financial statements. CARMAX 2005 29 C O N S O L I DAT E D S TAT E M E N T S O F C A S H F L OW S (In thousands) 2005 Years Ended February 28 or 29 2004 2003 $ 112,928 $ 116,450 $ 94,802 OPERATING ACTIVITIES: Net earnings Adjustments to reconcile net earnings to net cash provided by operating activities: Depreciation and amortization Amortization of restricted stock awards (Gain) loss on disposition of assets Provision for deferred income taxes Changes in operating assets and liabilities: Increase in accounts receivable, net Increase in automobile loan receivables held for sale Increase in retained interest in securitized receivables (Increase) decrease in inventory (Increase) decrease in prepaid expenses and other current assets Decrease (increase) in other assets Increase in accounts payable, accrued expenses and other current liabilities and accrued income taxes Increase in deferred revenue and other liabilities 20,145 108 (1,486) (1,184) 16,181 122 (1,462) (1,298) 14,873 77 30 8,880 (3,809) (3,371) (1,975) (110,506) (4,358) 42 (15,909) (15,202) (10,972) 389 3,986 4,647 (6,008) (1,435) (14,333) (67,366) (10,571) (845) 35,876 2,326 48,570 2,962 51,375 2,488 44,736 148,464 71,967 Purchases of property and equipment Proceeds from sales of assets (230,080) 88,999 (181,338) 107,493 (122,032) 41,621 NET CASH USED IN INVESTING ACTIVITIES (141,081) (73,845) (80,411) Increase (decrease) in short-term debt, net Issuance of long-term debt Payments on long-term debt Equity issuances, net Special dividend paid 60,751 — (509) 3,559 — (51,605) — — 4,014 — 46,211 100,000 (78,608) 570 (28,400) NET CASH PROVIDED BY (USED IN) FINANCING ACTIVITIES 63,801 (47,591) 39,773 (Decrease) increase in cash and cash equivalents Cash and cash equivalents at beginning of year (32,544) 61,643 27,028 34,615 31,329 3,286 $ 29,099 $ 61,643 $ 34,615 $ 5,726 $ 72,022 $ 4,695 $ 59,987 $ 3,862 $ 49,215 $ 29,258 $ 29,258 $ $ $ $ NET CASH PROVIDED BY OPERATING ACTIVITIES INVESTING ACTIVITIES: FINANCING ACTIVITIES: CASH AND CASH EQUIVALENTS AT END OF YEAR SUPPLEMENTAL DISCLOSURES OF CASH FLOW INFORMATION Cash paid during the year for: Interest Income taxes Noncash investing and financing activities: Asset acquisitions from capitalization of leases Long-term debt obligations from capitalization of leases See accompanying notes to consolidated financial statements. 30 CARMAX 2005 — — — — C O N S O L I DAT E D S TAT E M E N T S O F S H A R E H O L D E R S ’ E Q U I T Y (In thousands) BALANCE AT FEBRUARY 28, 2002 Net earnings Equity issuances, net Special dividend Recapitalization due to separation Exercise of common stock options Shares purchased for employee stock purchase plan Shares issued under stock incentive plans Tax benefit from stock issued Unearned compensation—restricted stock BALANCE AT FEBRUARY 28, 2003 Net earnings Exercise of common stock options Shares purchased for employee stock purchase plan Shares issued under stock incentive plans Shares cancelled upon reacquisition by the company Tax benefit from stock issued Unearned compensation—restricted stock BALANCE AT FEBRUARY 29, 2004 Net earnings Exercise of common stock options Shares purchased for employee stock purchase plan Shares issued under stock incentive plans Shares cancelled upon reacquisition by the company Tax benefit from stock issued Unearned compensation—restricted stock BALANCE AT FEBRUARY 28, 2005 Common Shares Outstanding — Capital in Excess of Par Value Common Stock $ — — — — 103,014 39 — — — 51,507 20 — 30 — — — 15 — — 103,083 51,542 — 693 — 346 — 3 — 2 (1) — — (1) — — $ — — — — 472,681 177 (213) 408 12 (320) Retained Earnings $ — 30,282 — — — — Parent’s Equity Total $ 485,479 $ 485,479 64,520 2,589 (28,400) (524,188) — 94,802 2,589 (28,400) — 197 — — — — — — — — (213) 423 12 (320) 472,745 30,282 — 554,569 — 4,176 116,450 — — — 116,450 4,522 (599) 95 — — — — (599) 97 (13) 5,598 130 — — — — — — (14) 5,598 130 103,778 51,889 482,132 146,732 — 680,753 — 522 — 262 — 3,955 112,928 — — — 112,928 4,217 — 4 — 2 (747) 88 — — — — (747) 90 (1) — — (1) — — (16) 3,628 124 — — — — — — (17) 3,628 124 — $800,976 104,303 $52,152 $489,164 $259,660 $ See accompanying notes to consolidated financial statements. CARMAX 2005 31 N OT E S TO C O N S O L I DAT E D F I N A N C I A L S TAT E M E N T S 1 BACKGROUND AND BASIS OF P R E S E N TAT I O N CarMax, Inc. (“CarMax” and “the company”), including its wholly owned subsidiaries, is the largest retailer of used cars and light trucks in the United States. CarMax was the first used vehicle retailer to offer a large selection of quality used vehicles at low, “no-haggle” prices using a customer-friendly sales process in an attractive, modern sales facility. CarMax also sells new vehicles under various franchise agreements. CarMax provides its customers with a full range of related services, including the financing of vehicle purchases through its own finance operation, CarMax Auto Finance (“CAF”), and thirdparty lenders; the sale of extended service plans; and vehicle repair service. CarMax was formerly a subsidiary of Circuit City Stores, Inc. (“Circuit City”). On October 1, 2002, the CarMax business was separated from Circuit City through a tax-free transaction. As a result of the separation, all of the businesses, assets, and liabilities of the CarMax business are held in CarMax, Inc., an independent, separately traded public company. At the separation date, Circuit City and CarMax executed a transition services agreement and a tax allocation agreement. The transition services agreement specified initial service periods ranging from 6 to 24 months, with varying renewal options. The tax allocation agreement provided that the preseparation taxes attributable to the business of each party would be borne solely by that party. 2 SUMMARY OF SIGNIFICANT ACCOUNTING POLICIES ( D ) Fa i r Va l u e of F i n a n c i a l I n s t r u m e n t s The carrying value of the company’s cash and cash equivalents, receivables including automobile loan receivables, accounts payable, short-term borrowings, and long-term debt approximates fair value. The company’s retained interest in securitized receivables and derivative financial instruments are recorded on the consolidated balance sheets at fair value. ( A ) P r i n c i p l e s of C o n s o l i d a t i o n ( E ) Tra d e Ac c o u n t s R e c e i va b l e The consolidated financial statements include the accounts of CarMax and its wholly owned subsidiaries. All significant intercompany balances and transactions have been eliminated in consolidation. Trade accounts receivable, net of an allowance for doubtful accounts, include certain amounts due from finance companies and customers, as well as from manufacturers for incentives and warranty reimbursements, and for other miscellaneous receivables. The estimate for doubtful accounts is based on historical experience and trends. ( B ) C a s h a n d C a s h E q u i va l e n t s Cash equivalents of $18.0 million and $48.9 million at February 28, 2005, and February 29, 2004, respectively, consisted of highly liquid debt securities with original maturities of three months or less. Included in cash equivalents at February 28, 2005, and February 29, 2004, were restricted cash deposits of $12.0 million and $13.0 million, respectively, which were associated with certain insurance deductibles. Additional restricted cash related to auto loan receivables at February 29, 2004, was $6.4 million. (C) Securitizations The company uses a securitization program to fund substantially all of the automobile loan receivables originated by CAF. The company sells the automobile loan receivables to a wholly 32 owned, bankruptcy-remote, special purpose entity that transfers an undivided interest in the receivables to a group of third-party investors.This program is referred to as the warehouse facility. The company periodically uses public securitizations to refinance the receivables previously securitized through the warehouse facility. In a public securitization, a pool of automobile loan receivables is sold to a bankruptcy-remote, special purpose entity that in turn transfers the receivables to a special purpose securitization trust. The transfers of receivables are accounted for as sales in accordance with Statement of Financial Accounting Standards (“SFAS”) No. 140, “Accounting for Transfers and Servicing of Financial Assets and Extinguishments of Liabilities.” The company retains an interest in the automobile loan receivables that it securitizes. The retained interest presented on the company’s consolidated balance sheets includes the present value of the expected residual cash flows generated by the securitized receivables, the restricted cash on deposit in various reserve accounts, and an undivided ownership interest in the receivables securitized through the warehouse facility and certain public securitizations. The retained interest is carried at fair value and changes in fair value are included in earnings. See Notes 3 and 4 for additional discussion of securitizations. CARMAX 2005 ( F ) I n ve n t o r y Inventory is comprised primarily of vehicles held for sale or undergoing reconditioning and is stated at the lower of cost or market. Vehicle inventory cost is determined by specific identification. Parts and labor used to recondition vehicles, as well as transportation and other incremental expenses associated with acquiring and reconditioning vehicles, are included in inventory. Certain manufacturer incentives and rebates for new car inventory, including holdbacks, are recognized as a reduction to new car inventory when CarMax purchases the vehicles. Volume-based incentives are recognized as a reduction to new car inventory cost when achievement of volume thresholds is determined to be probable. ( G ) P ro p e r t y a n d E q u i p m e n t Property and equipment is stated at cost less accumulated depreciation and amortization. Depreciation and amortization are calculated using the straight-line method over the assets’ estimated useful lives. Property held under capital lease is stated at the lower of the present value of the minimum lease payments at the inception of the lease or market value and is amortized on a straight-line basis over the lease term or the estimated useful life of the asset, whichever is shorter. ( H ) C o m p u t e r S of t wa re C o s t s External direct costs of materials and services used in the development of internal-use software and payroll and payrollrelated costs for employees directly involved in the development of internal-use software are capitalized. Amounts capitalized are amortized on a straight-line basis over a period of five years. ( I ) G o o d w i l l a n d I n t a n g i b l e As s e t s The company reviews goodwill and intangible assets for impairment annually or when circumstances indicate the carrying amount may not be recoverable. As of February 28, 2005, and February 29, 2004, no impairment of goodwill or intangible assets resulted from the annual impairment tests. (J) Defined Benefit Plan Obligations Defined benefit retirement plan obligations are included in accrued expenses and other current liabilities on the company’s consolidated balance sheets. The defined benefit retirement plan obligations are determined by independent actuaries using a number of assumptions provided by the company. Key assumptions used in measuring the plan obligations include the discount rate, the rate of salary increases, and the estimated future return on plan assets. ( K ) I n s u ra n c e L i a b i l i t i e s Insurance liabilities are included in accrued expenses and other current liabilities on the company’s consolidated balance sheets. The company uses a combination of insurance and self-insurance for a number of risks including workers’ compensation, general liability, and employee-related health care benefits, a portion of which is paid by associates. Estimated insurance liabilities are determined by considering historical claims experience, demographic factors, and other actuarial assumptions. ( L ) I m p a i r m e n t o r D i s p o s a l of L o n g - L i ve d As s e t s The company reviews long-lived assets for impairment when circumstances indicate the carrying amount of an asset may not be recoverable. Impairment is recognized when the sum of undiscounted estimated future cash flows expected to result from the use of the asset is less than the carrying value. ( M ) S t o re O p e n i n g E x p e n s e s Costs relating to store openings, including preopening costs, are expensed as incurred. ( N ) I n c o m e Ta xe s Deferred income taxes reflect the impact of temporary differences between the amounts of assets and liabilities recognized for financial reporting purposes and the amounts recognized for income tax purposes, measured by applying currently enacted tax laws. A deferred tax asset is recognized if it is more likely than not that a benefit will be realized. Tax law and rate changes are reflected in the income tax provision in the period in which such changes are enacted. ( O ) R eve n u e R e c o g n i t i o n The company recognizes revenue when the earnings process is complete, generally either at the time of sale to a customer or upon delivery to a customer. As part of its customer service strategy, the company guarantees the vehicles it sells with a 5-day or 250-mile, money-back guarantee. If a customer returns the vehicle purchased within the limits of the guarantee, the company will refund the customer’s money. A reserve for returns is recorded based on historical experience and trends. The company sells extended service plans on behalf of unrelated third parties. These service plans have terms of coverage from 12 to 72 months. Because these third parties are the primary obligors under these service plans, commission revenue is recognized at the time of sale, net of a reserve for estimated customer returns of the service plans. The reserve for returns is based on historical experience and trends. ( P ) Ad ve r t i s i n g E x p e n s e s All advertising costs are expensed as incurred. Advertising expenses are included in selling, general, and administrative expenses in the accompanying consolidated statements of earnings. ( Q ) N e t E a r n i n g s Pe r S h a re Basic net earnings per share is computed by dividing net earnings by the weighted average number of shares of common stock outstanding. Diluted net earnings per share is computed by dividing net earnings by the sum of the weighted average number of shares of common stock outstanding and dilutive potential common stock. (R) Stock-Based Compensation The company accounts for its stock-based compensation plans under the recognition and measurement principles of Accounting Principles Board (“APB”) Opinion No. 25, “Accounting for Stock Issued to Employees,” and related interpretations. Under this opinion and related interpretations, compensation expense is recorded on the date of grant and amortized over the period of service only if the market value of the underlying stock on the grant date exceeds the exercise price. No stock option-based employee compensation cost is reflected in net earnings, as options granted under those plans had exercise prices equal to the market value of the underlying common stock on the date of grant. The following table illustrates the effect on net earnings and net earnings per share as if the fair-value-based method of accounting had been CARMAX 2005 33 applied to all outstanding stock awards in each reported period as follows: (In thousands except per share data) Years Ended February 28 or 29 2005 2004 2003 Net earnings, as reported $112,928 $116,450 $94,802 Total additional stock-based compensation expenses determined under the fair-value-based method for all awards, net of related tax effects (U) Reclassifications 11,501 6,759 4,391 Pro forma net earnings $101,427 $109,691 $90,411 Earnings per share: Basic, as reported Basic, pro forma $ $ 1.09 $ 0.97 $ 1.13 $ 0.92 1.06 $ 0.88 $ $ 1.07 $ 0.97 $ 1.10 $ 0.91 1.04 $ 0.86 Diluted, as reported Diluted, pro forma impact will occur in the near term as a result of changes in its customer base, competition, or sources of supply. However, management cannot assure that unanticipated events will not have a negative impact on the company. The preparation of financial statements in conformity with accounting principles generally accepted in the United States of America requires management to make estimates and assumptions that affect the reported amounts of assets, liabilities, revenues and expenses, and the disclosure of contingent assets and liabilities. Actual results could differ from those estimates. Certain prior year amounts have been reclassified to conform to the current year’s presentation. 3 The pro forma effect on fiscal 2005 and prior fiscal years may not be representative of the pro forma effects on net earnings and earnings per share for future years. For the purpose of computing the pro forma amounts indicated above, the fair value of each option on the date of grant was estimated using the Black-Scholes option-pricing model. The weighted average assumptions used in the model were as follows: Years Ended February 28 or 29 2005 2004 2003 Expected dividend yield Expected stock volatility Risk-free interest rates Expected lives (in years) — 73% 3% 5 — 78% 3% 5 — 76% 4% 5 Using these assumptions in the Black-Scholes model, the weighted average fair value of options granted was $18 per share in fiscal 2005, $9 per share in fiscal 2004, and $17 per share in fiscal 2003. CARMAX AUTO FINANCE INCOME The company’s finance operation, CAF, originates prime-rated financing for qualified customers at competitive market rates of interest.Throughout each month, the company sells substantially all of the loans originated by CAF in securitization transactions as discussed in Note 4. The majority of the contribution from CAF is generated by the spread between the interest rate charged to the customer and the company’s cost of funds. A gain, recorded at the time of the securitization transaction, results from recording a receivable approximately equal to the present value of the expected residual cash flows generated by the securitized receivables. The cash flows are calculated taking into account expected prepayment and default rates. CarMax Auto Finance income was as follows: (In millions) Gains on sales of loans Years Ended February 28 or 29 2005 2004 2003 $58.3 $65.1 $68.2 Other CAF income: Servicing fee income Interest income 24.7 19.0 21.8 16.0 17.3 11.5 Total other CAF income 43.7 37.8 28.8 Direct CAF expenses: CAF payroll and fringe benefit expense Other direct CAF expenses 9.0 10.3 8.2 9.7 7.0 7.6 Total direct CAF expenses 19.3 17.9 14.6 $82.7 $85.0 $82.4 ( S ) D e r i va t i ve F i n a n c i a l I n s t r u m e n t s In connection with securitization activities through the warehouse facility, the company enters into interest rate swap agreements to manage exposure to interest rates and to more closely match funding costs to the use of funding. The company recognizes the interest rate swaps as either assets or liabilities on the consolidated balance sheets at fair value with changes in fair value included in earnings as a component of CarMax Auto Finance income. ( T ) R i s ks a n d U n c e r t a i n t i e s CarMax retails used and new vehicles. The diversity of the company’s customers and suppliers reduces the risk that a severe 34 CARMAX 2005 CarMax Auto Finance income CarMax Auto Finance income does not include any allocation of indirect costs or income. The company presents this information on a direct basis to avoid making arbitrary decisions regarding the indirect benefit or costs that could be attributed to CAF. Examples of indirect costs not included are retail store expenses, retail financing commissions, and corporate expenses such as human resources, administrative services, marketing, information systems, accounting, legal, treasury, and executive payroll. 4 S E C U R I T I Z AT I O N S The company uses a securitization program to fund substantially all of the automobile loan receivables originated by CAF. The company sells the automobile loan receivables to a wholly owned, bankruptcy-remote, special purpose entity that transfers an undivided interest in the receivables to a group of third-party investors. The special purpose entity and investors have no recourse to the company’s assets. The company’s risk is limited to the retained interest on the company’s consolidated balance sheets. The investors issue commercial paper supported by the transferred receivables, and the proceeds from the sale of the commercial paper are used to pay for the securitized receivables. This program is referred to as the warehouse facility. The company periodically uses public securitizations to refinance the receivables previously securitized through the warehouse facility. In a public securitization, a pool of automobile loan receivables is sold to a bankruptcy-remote, special purpose entity that in turn transfers the receivables to a special purpose securitization trust. The securitization trust issues asset-backed securities, secured or otherwise supported by the transferred receivables, and the proceeds from the sale of the securities are used to pay for the securitized receivables. The earnings impact of refinancing receivables in a public securitization has not been material to the operations of the company. However, because securitization structures could change from time to time, this may not be representative of the potential impact of future securitizations. The transfers of receivables are accounted for as sales in accordance with SFAS No. 140. When the receivables are securitized, the company recognizes a gain or loss on the sale of the receivables as described in Note 3. (In millions) Years Ended February 28 or 29 2005 2004 2003 Net loans originated $1,490.3 $1,407.6 $1,189.0 Loans sold $1,534.8 $1,390.2 $1,185.9 Gains on sales of loans $ 58.3 $ 65.1 $ 68.2 Gains on sales of loans as a percentage of loans sold 3.8% 4.7% 5.8% R e t a i n e d I n t e re s t The company retains an interest in the automobile loan receivables that it securitizes. The retained interest, presented as a current asset on the company’s consolidated balance sheets, serves as a credit enhancement for the benefit of the investors in the securitized receivables. The retained interest includes the present value of the expected residual cash flows generated by the securitized receivables, or “interest-only strip receivables,” the restricted cash on deposit in various reserve accounts, and an undivided ownership interest in the receivables securitized through the warehouse facility and certain public securitizations, or “required excess receivables,” as described below. On a combined basis, the cash reserves and required excess receivables are generally 2% to 4% of managed receivables. The special purpose entities and the investors have no recourse to the company’s assets. The company’s risk is limited to the retained interest on the company’s consolidated balance sheets. The fair value of the retained interest may fluctuate depending on the performance of the securitized receivables. The fair value of the retained interest was $148.0 million as of February 28, 2005, and $146.0 million as of February 29, 2004. The retained interest had a weighted average life of 1.5 years as of February 28, 2005, and as of February 29, 2004. As defined in SFAS No. 140, the weighted average life in periods (for example, months or years) of prepayable assets is calculated by multiplying the principal collections expected in each future period by the number of periods until that future period, summing those products, and dividing the sum by the initial principal balance.The following is a detailed explanation of the components of the retained interest. Interest-Only Strip Receivables. Interest-only strip receivables represent the present value of residual cash flows the company expects to receive over the life of the securitized receivables. The value of these receivables is determined by estimating the future cash flows using management’s assumptions of key factors, such as finance charge income, default rates, prepayment rates, and discount rates appropriate for the type of asset and risk. The value of interest-only strip receivables may be affected by external factors, such as changes in the behavior patterns of customers, changes in the strength of the economy, and developments in the interest rate markets; therefore, actual performance may differ from these assumptions. Management evaluates the performance of the receivables relative to these assumptions on a regular basis. Any financial impact resulting from a change in performance is recognized in earnings in the period in which it occurs. Restricted Cash. Restricted cash represents amounts on deposit in various reserve accounts established for the benefit of the securitization investors. In the event that the cash generated by the securitized receivables in a given period was insufficient to pay the interest, principal, and other required payments, the balances on deposit in the reserve accounts would be used to pay those amounts. In general, each of the company’s securitizations requires that an amount equal to a specified percentage of the initial receivables balance be deposited in a reserve account on the closing date and that any excess cash generated by the receivables be used to fund the reserve account to the extent necessary to maintain the required amount. If the amount on deposit in the reserve account exceeds the required amount, an amount equal to that excess is released through the special purpose entity to the company. In the public securitizations, the amount required to be on deposit in the reserve account must equal or exceed a specified floor amount. The reserve account remains at the floor amount until the investors are paid in full, at which time the remaining reserve account balance is released through the special purpose entity to the company. The amount required to be maintained in the public securitization reserve accounts may increase depending upon the performance of the securitized receivables. The amount on deposit in restricted cash accounts was $33.5 million as of February 28, 2005, and $34.8 million as of February 29, 2004. CARMAX 2005 35 Required Excess Receivables. The warehouse facility and certain public securitizations require that the total value of the securitized receivables exceed, by a specified amount, the principal amount owed to the investors. The required excess receivables balance represents this specified amount. Any cash flows generated by the required excess receivables are used, if needed, to make payments to the investors. The unpaid principal balance related to the required excess receivables was $44.3 million as of February 28, 2005, and $28.8 million as of February 29, 2004. asset or liability has been recorded. The company is at risk for the retained interest in the securitized receivables. If the securitized receivables do not perform as originally projected, the value of the retained interest would be impacted. The assumptions used to value the retained interest, as well as a sensitivity analysis, are detailed in the “Key Assumptions Used in Measuring the Retained Interest and Sensitivity Analysis” section of this footnote. Supplemental information about the managed receivables is shown in the following tables: Key As s u m p t i o n s Us e d i n M e a s u r i n g t h e R e t a i n e d I n t e re s t a n d S e n s i t i v i t y A n a l ys i s (In millions) The following table shows the key economic assumptions used in measuring the fair value of the retained interest at February 28, 2005, and a sensitivity analysis showing the hypothetical effect on the retained interest if there were unfavorable variations from the assumptions used. Key economic assumptions at February 28, 2005, were not materially different from assumptions used to measure the fair value of the retained interest at the time of securitization. These sensitivities are hypothetical and should be used with caution. In this table, the effect of a variation in a particular assumption on the fair value of the retained interest is calculated without changing any other assumption; in actual circumstances, changes in one factor may result in changes in another, which might magnify or counteract the sensitivities. (In millions) Assumptions Used Prepayment rate 1.45%–1.55% Cumulative default rate 1.85%–2.50% Annual discount rate 12.0% Impact on Fair Value of 10% Adverse Change Impact on Fair Value of 20% Adverse Change $5.3 $4.0 $2.1 $10.3 $ 8.1 $ 4.2 Loans securitized Loans held for sale or investment Ending managed receivables Accounts 31+ days past due Past due accounts as a percentage of ending managed receivables (In millions) 2005 As of February 28 or 29 2004 2003 $2,427.2 $2,200.4 $1,859.1 67.7 48.2 19.6 $2,494.9 $2,248.6 $1,878.7 $ $ $ 31.1 1.24% 31.4 1.40% 27.6 1.47% Years Ended February 28 or 29 2005 2004 2003 Average managed receivables $2,383.6 $2,099.4 $1,701.0 Credit losses on managed receivables $ 19.5 $ 21.1 $ 17.5 Annualized credit losses as a percentage of average managed receivables 0.82% 1.01% 1.03% S e l e c t e d C a s h F l ows f ro m S e c u r i t i z e d R e c e i va b l e s Prepayment Rate. The company uses the Absolute Prepayment Model or “ABS” to estimate prepayments. This model assumes a rate of prepayment each month relative to the original number of receivables in a pool of receivables. ABS further assumes that all the receivables are the same size and amortize at the same rate and that each receivable in each month of its life will either be paid as scheduled or prepaid in full. For example, in a pool of receivables originally containing 10,000 receivables, a 1% ABS rate means that 100 receivables prepay each month. Cumulative Default Rate. The cumulative default rate, or “static pool” net losses, is calculated by dividing the total projected future credit losses of a pool of receivables by the original pool balance. The table below summarizes certain cash flows received from and paid to the automobile loan securitizations: Years Ended February 28 or 29 2005 2004 2003 (In millions) 3 3 3 3 Proceeds from new securitizations Proceeds from collections reinvested in revolving period securitizations Servicing fees received Other cash flows received from the retained interest: Interest-only strip receivables Cash reserve releases, net $1,260.0 $1,185.5 $1,018.7 $ 590.8 $ 514.9 $ 468.9 $ 24.5 $ 21.5 $ 17.0 $ $ 79.8 $ 14.1 $ 74.1 $ 16.6 $ 65.4 25.3 C o n t i n u i n g I n vo l ve m e n t w i t h S e c u r i t i z e d R e c e i va b l e s The company continues to manage the automobile loan receivables that it securitizes. The company receives servicing fees of approximately 1% of the outstanding principal balance of the securitized receivables. The servicing fees specified in the securitization agreements adequately compensate the company for servicing the securitized receivables. Accordingly, no servicing 36 CARMAX 2005 Proceeds from New Securitizations. Proceeds from new securitizations represent receivables newly securitized through the warehouse facility during the period. Previously securitized receivables that are periodically refinanced through the warehouse facility or in public securitizations are not considered new securitizations for this table. Proceeds from Collections. Proceeds from collections reinvested in revolving period securitizations represent principal amounts collected on receivables securitized through the warehouse facility that are used to fund new originations. Servicing Fees. Servicing fees received represent cash fees paid to the company to service the securitized receivables. Other Cash Flows Received from the Retained Interest. Other cash flows received from the retained interest represent cash received by the company from securitized receivables other than servicing fees. It includes cash collected on interest-only strip receivables and amounts released to the company from restricted cash accounts. F i n a n c i a l C ove n a n t s a n d Pe r fo r m a n c e Tr i g g e rs Certain securitization agreements include various financial covenants and performance triggers. For such agreements, the company must meet financial covenants relating to minimum tangible net worth, maximum total liabilities to tangible net worth ratio, minimum tangible net worth to managed assets ratio, minimum current ratio, minimum cash balance or borrowing capacity, and minimum fixed charge coverage ratio. Certain securitized receivables must meet performance tests relating to portfolio yield, default rates, and delinquency rates. If these financial covenants and/or performance tests are not met, in addition to other consequences, the company may be unable to continue to securitize receivables through the warehouse facility or it may be terminated as servicer under the securitizations. At February 28, 2005, the company was in compliance with these financial covenants, and the securitized receivables were in compliance with these performance triggers. 5 F I N A N C I A L D E R I VAT I V E S The company enters into amortizing fixed-pay interest rate swaps relating to its automobile loan receivable securitizations. Swaps are used to better match funding costs to the fixed-rate receivables being securitized by converting variable-rate financing costs in the warehouse facility to fixed-rate obligations. The company entered into one 18-month and twenty-six 40-month amortizing interest rate swaps with initial notional amounts totaling approximately $1.36 billion in fiscal 2005, twenty-two 40-month amortizing interest rate swaps with initial notional amounts totaling approximately $1.21 billion in fiscal 2004, and one 20-month and twelve 40-month amortizing interest rate swaps with initial notional amounts totaling approximately $1.05 billion in fiscal 2003. The amortized notional amount of all outstanding swaps related to the automobile loan receivable securitizations was approximately $662.1 million at February 28, 2005, and $551.8 million at February 29, 2004. The fair value of swaps included in prepaid expenses and other current assets totaled a net asset of $5.4 million at February 28, 2005, and the fair value of swaps included in accounts payable totaled a net liability of $2.0 million at February 29, 2004. The market and credit risks associated with interest rate swaps are similar to those relating to other types of financial instruments. Market risk is the exposure created by potential fluctuations in interest rates. The company does not anticipate significant market risk from swaps as they are used on a monthly basis to match funding costs to the use of the funding. Credit risk is the exposure to nonperformance of another party to an agreement. The company mitigates credit risk by dealing with highly rated bank counterparties. 6 PROPERTY AND EQUIPMENT Property and equipment, at cost, is summarized as follows: As of February 28 or 29 2005 2004 (In thousands) Buildings (25 to 40 years) Land Land held for sale Land held for development Construction in progress Furniture, fixtures, and equipment (5 to 15 years) Leasehold improvements (8 to 15 years) Capital leases (15 to 20 years) $ 49,047 37,650 2,664 6,084 198,682 $ 30,985 25,716 3,163 3,580 116,639 125,734 103,787 45,346 29,258 37,533 — 494,465 321,403 88,164 69,944 $406,301 $251,459 Less accumulated depreciation and amortization Property and equipment, net Land held for development represents land owned for future sites that are scheduled to open more than one year beyond the fiscal year reported. Leased property meeting certain criteria is capitalized and the present value of the related lease payments is recorded as long-term debt. Amortization of capital lease assets is computed on a straight-line basis over the shorter of the useful life or the term of the lease and is included in depreciation expense. 7 I N C O M E TA X E S The components of the provision for income taxes on net earnings were as follows: (In thousands) Current: Federal State Years Ended February 28 or 29 2005 2004 2003 $62,662 10,117 $65,212 8,986 $47,600 5,415 Total 72,779 74,198 53,015 Deferred: Federal State (1,068) (116) (1,180) (118) 8,614 266 Total (1,184) (1,298) 8,880 Provision for income taxes $71,595 $72,900 $61,895 CARMAX 2005 37 The effective income tax rate differed from the federal statutory income tax rate as follows: Years Ended February 28 or 29 2005 2004 2003 Federal statutory income tax rate State and local income taxes, net of federal benefit Nondeductible items Effective income tax rate 35.0% 35.0% 35.0% 3.5 0.3 3.1 0.4 3.0 1.5 38.8% 38.5% 39.5% The tax effects of temporary differences that give rise to a significant portion of the deferred tax assets and liabilities were as follows: (In thousands) Deferred tax assets: Accrued expenses Other As of February 28 or 29 2005 2004 $12,381 100 $ 9,048 79 Total gross deferred tax assets 12,481 9,127 Deferred tax liabilities: Securitized receivables Inventory Depreciation and amortization Investment basis Prepaid expenses 23,301 8,515 7,744 4,106 157 27,940 7,607 5,224 — 882 Total gross deferred tax liabilities 43,823 41,653 $31,342 $32,526 Net deferred tax liability Based on the company’s historical and current pretax earnings, management believes the amount of gross deferred tax assets will more likely than not be realized through future taxable income and future reversals of existing temporary differences; therefore, no valuation allowance is necessary. 8 BENEFIT PLANS ( A ) R e t i re m e n t P l a n s The company has a noncontributory defined benefit pension plan (the “pension plan”) covering the majority of full-time employees who are at least 21 years old and have completed one year of service. The cost of the program is being funded currently. Plan benefits generally are based on years of service and average compensation. The company also has an unfunded nonqualified plan (the “restoration plan”) that restores retirement benefits for certain senior executives who are affected by Internal Revenue Code limitations on benefits provided under the pension plan. The liabilities for these plans are included in accrued expenses and other current liabilities in the consolidated balance sheets.The company uses a fiscal year end measurement date for both the pension plan and the restoration plan. Funding Policy. For the defined benefit pension plan, the company contributes amounts sufficient to meet minimum funding requirements as set forth in the employee benefit and tax laws plus any additional amounts as the company may determine to be appropriate. The company expects to contribute at least $4.0 million to the pension plan in fiscal 2006. Projected Benefit Obligations. The projected benefit obligations are the present value of future benefits to employees, including assumed salary increases. Changes in the company’s projected benefit obligations are presented in Table 1. Assets. Assets used in calculating the funded status are measured at current market values. The restoration plan is excluded since it is unfunded. Changes in the market value of the company’s pension plan assets were as follows: (In thousands) Years Ended February 28 or 29 Pension Plan 2005 2004 Fair value of plan assets at beginning of year Actual return on plan assets Adjustment for separation Employer contributions Benefits paid $16,404 1,849 — 7,381 (318) $ 5,676 2,564 606 7,785 (227) Fair value of plan assets at end of year $25,316 $16,404 TA B L E 1 — C H A N G E S I N P R O J E C T E D B E N E F I T O B L I GAT I O N Pension Plan 2005 2004 Projected benefit obligation at beginning of year Service cost Interest cost Plan amendments Actuarial loss Adjustment for separation Benefits paid $35,918 6,557 2,152 — 4,365 — (318) $24,555 5,529 1,679 — 3,074 1,308 (227) $3,596 343 232 267 70 — — Projected benefit obligation at end of year $48,674 $35,918 $4,508 (In thousands) 38 Years Ended February 28 or 29 Restoration Plan 2005 2004 CARMAX 2005 Total 2005 2004 $2,031 231 126 — 1,208 — — $39,514 6,900 2,384 267 4,435 — (318) $26,586 5,760 1,805 — 4,282 1,308 (227) $3,596 $53,182 $39,514 Funded Status. The funded status represents the difference between the projected benefit obligations and the market value of the assets. The components of the funded status of the retirement plans were as follows: Pension Plan (In thousands) Reconciliation of funded status: Funded status Unrecognized actuarial loss Unrecognized prior service benefit/(cost) Net amount recognized 2005 2004 $(23,358) 13,877 $(19,514) 10,574 294 257 $ (9,224) $ (8,646) As of February 28 or 29 Restoration Plan 2005 2004 $(4,508) 1,945 242 $(2,321) $(3,596) 2,024 Total 2005 2004 $(27,866) 15,822 $(23,110) 12,598 (1) $(1,573) 293 499 $(10,219) $(11,545) Additional Information. Pension Plan (In thousands) Projected benefit obligation Accumulated benefit obligation Fair value of plan assets 2005 2004 $48,674 $30,646 $25,316 $35,918 $21,991 $16,404 As of February 28 or 29 Restoration Plan 2005 2004 $4,508 $2,419 — $3,596 $1,553 — Total 2005 2004 $53,182 $33,065 $25,316 $39,514 $23,544 $16,404 Expense. The components of net pension expense were as follows: (In thousands) 2005 Pension Plan 2004 2003 Years Ended February 28 or 29 Restoration Plan 2005 2004 2003 Total 2004 2005 2003 Service cost Interest cost Expected return on plan assets Amortization of prior year service cost Recognized actuarial loss $ 6,557 $5,529 $4,021 2,152 1,679 1,104 (1,523) (892) (617) 37 37 35 736 647 194 $343 232 — 24 149 $231 126 — — 53 $197 99 — — 32 $ 6,900 $5,760 $4,218 2,384 1,805 1,203 (1,523) (892) (617) 61 37 35 885 700 226 Net pension expense $ 7,959 $7,000 $748 $410 $328 $ 8,707 $4,737 $7,410 $5,065 Assumptions. Assumptions used to determine benefit obligations were as follows: Years Ended February 28 or 29 Weighted average discount rate Rate of increase in compensation levels 2005 Pension Plan 2004 2003 2005 Restoration Plan 2004 2003 5.75% 5.00% 6.00% 5.00% 6.50% 6.00% 5.75% 7.00% 6.00% 7.00% 6.50% 6.00% Assumptions used to determine net pension expense were as follows: As of February 28 or 29 Weighted average discount rate Expected rate of return on plan assets Rate of increase in compensation levels 2005 Pension Plan 2004 2003 2005 Restoration Plan 2004 2003 6.00% 8.00% 5.00% 6.50% 9.00% 6.00% 7.25% 9.00% 7.00% 6.00% — 7.00% 6.50% — 6.00% 7.25% — 7.00% CARMAX 2005 39 To determine the expected long-term rate of return on pension plan assets, the company considers the current and expected asset allocations, as well as historical and expected returns on various categories of plan assets. The company applies the expected rate of return to a market-related value of assets, which reduces the underlying variability in assets to which the expected return is applied. Asset Allocation Strategy. The company’s pension plan assets are held in trust.The asset allocation was as follows: Target Allocation Equity securities Fixed income securities Total As of February 28 or 29 2005 2004 Actual Actual Allocation Allocation 80% 20% 76% 24% 80% 20% 100% 100% 100% Plan fiduciaries set investment policies and strategies for the pension plan. Long-term strategic investment objectives include preserving the funded status of the trust and balancing risk and return. The plan fiduciaries oversee the investment allocation process, which includes selecting investment managers, setting long-term strategic targets, and monitoring asset allocations. Target allocation ranges are guidelines, not limitations, and occasionally plan fiduciaries will approve allocations above or below a target range. Estimated Future Benefit Payments. As of February 28, 2005, expected benefit payments, which reflect estimated future employee service, as appropriate, were as follows: (In thousands) Pension Plan Fiscal Fiscal Fiscal Fiscal Fiscal Fiscal $ 136 209 307 433 609 $7,535 2006 2007 2008 2009 2010 2011 through 2015 Restoration Plan $ 4 65 119 193 237 $1,553 (B) 401(k) Plans CarMax sponsors a 401(k) plan for all associates meeting certain eligibility criteria. Under the plan, eligible associates can contribute up to 40% of their salaries, and the company matches a portion of those contributions. The total expense for this plan was $1.7 million in fiscal 2005, $1.1 million in fiscal 2004, and $1.0 million in fiscal 2003. 9 DEBT Total debt is summarized as follows: (In thousands) As of February 28 or 29 2005 2004 Term loan Revolving loan Obligations under capital leases [Note 12] $100,000 65,197 $100,000 4,446 28,749 — Total debt Less current installments Less short-term debt 193,946 330 65,197 104,446 — 4,446 $128,419 $100,000 Total long-term debt, excluding current installments The company has a $300 million credit agreement secured by vehicle inventory. The credit agreement includes a $200 million revolving loan commitment and a $100 million term loan. Principal is due in full at maturity with interest payable monthly at a LIBOR-based rate. Under this agreement, the company must meet financial covenants relating to minimum current ratio, maximum total liabilities to tangible net worth ratio, and minimum fixed charge coverage ratio. The credit agreement is scheduled to terminate on May 17, 2006. The termination date of the agreement will be automatically extended annually for one year unless either CarMax or the lender elects, prior to the extension date, not to extend the agreement. As of February 28, 2005, the amount outstanding under this credit agreement was $165.2 million. In fiscal 2005, the company recorded five capital leases for superstores. The related lease assets are included in property and equipment. These leases were structured at varying interest rates with initial lease terms ranging from 15 to 20 years with payments made monthly. The present value of minimum lease payments totaled $28.7 million at February 28, 2005. The weighted average interest rate on the outstanding shortterm debt was 4.3% during fiscal 2005, 3.5% during fiscal 2004, and 3.2% during fiscal 2003. The company capitalizes interest in connection with the construction of certain facilities. Capitalized interest totaled $3.5 million in fiscal 2005, $2.5 million in fiscal 2004, and $1.0 million in fiscal 2003. 10 STOCK AND STOCK-BASED INCENTIVE PLANS ( A ) S h a re h o l d e r R i g h t s P l a n a n d U n d e s i g n a t e d P re f e r re d S t o c k In conjunction with the company’s shareholder rights plan, shareholders received preferred stock purchase rights as a dividend at the rate of one right for each share of CarMax, Inc. common stock owned. The rights are exercisable only upon the attainment of, or the commencement of a tender offer to attain, a 15% ownership interest in the company by a person or group. When exercisable, each right would entitle the holder to buy one onethousandth of a share of Cumulative Participating Preferred Stock, Series A, $20 par value, at an exercise price of $140 per share, subject to adjustment. A total of 120,000 shares of such preferred 40 CARMAX 2005 stock, which has preferential dividend and liquidation rights, have been authorized and designated. No such shares are outstanding. In the event that an acquiring person or group acquires the specified ownership percentage of CarMax, Inc. common stock (except pursuant to a cash tender offer for all outstanding shares determined to be fair by the board of directors) or engages in certain transactions with the company after the rights become exercisable, each right will be converted into a right to purchase, for half the current market price at that time, shares of the CarMax, Inc. common stock valued at two times the exercise price. The company also has an additional 19,880,000 shares of undesignated preferred stock authorized of which no shares are outstanding. restricted shares of common stock. Shares are awarded in the name of the employee, who has all the rights of a shareholder, subject to certain restrictions or forfeitures. Restrictions on the awards generally expire three or four years from the date of grant. No restricted stock awards were granted in fiscal 2005. In fiscal 2004, 228 shares of restricted stock were granted. At the date of grant, the market value of all shares granted is recorded as unearned compensation and is a component of equity. Unearned compensation is expensed over the restriction periods. The total charge to operations was $108,000 in fiscal 2005; $121,500 in fiscal 2004; and $77,400 in fiscal 2003. Outstanding shares of restricted common stock at February 28, 2005, and February 29, 2004, were 23,918 and 25,817, respectively. ( B ) S t o c k I n c e n t i ve P l a n s Under the company’s stock incentive plans, nonqualified stock options may be granted to management, key employees, and outside directors to purchase shares of common stock. The exercise price for nonqualified options is equal to, or greater than, the market value at the date of grant. Options generally are exercisable over a period from one to ten years from the date of grant. CarMax has authorized 10,100,000 shares of common stock to be issued as either options, stock appreciation rights, restricted stock grants, or stock grants. Shares of common stock available for issuance of options, stock appreciation rights, restricted stock grants, or stock grants totaled 1,727,450 at February 28, 2005. The company’s stock option activity is summarized in Table 2. Table 3 summarizes information about stock options outstanding as of February 28, 2005. (C) Restricted Stock The company has issued restricted stock under the provisions of the CarMax, Inc. 2002 Amended and Restated Stock Incentive Plan whereby management and key employees are granted TA B L E 2 — S TO C K O P T I O N AC T I V I T Y 2005 Weighted Average Exercise Price ( D ) E m p l oye e S t o c k P u rc h a s e P l a n The company has an employee stock purchase plan for all employees meeting certain eligibility criteria. Under the plan, eligible employees may, subject to certain limitations, purchase shares of common stock. For each $1.00 contributed by employees under the plan, the company matches $0.15. Purchases are limited to 10% of an employee’s eligible compensation, up to a maximum of $7,500 per year. CarMax has authorized up to 1,000,000 shares of common stock for the employee stock purchase plan. The source of the shares available for purchase by employees may, at the company’s option, be open market purchases or newly issued shares. At February 28, 2005, a total of 515,886 shares remained available under the plan. Shares purchased on the open market on behalf of employees were 225,961 during fiscal 2005; 161,662 during fiscal 2004; and 213,931 during fiscal 2003. The average price per share purchased under the plan was $25.96 in fiscal 2005, $29.97 in fiscal 2004, and $19.43 in fiscal 2003. The company match totaled $746,700 in fiscal 2005; $598,600 in fiscal 2004; and $520,700 in fiscal 2003. Years Ended February 28 or 29 2004 Weighted Average Shares Exercise Price (Shares in thousands) Shares Shares 2003 Weighted Average Exercise Price Outstanding at beginning of year Granted Exercised Cancelled 5,676 2,126 (522) (188) $12.24 $29.47 $ 8.40 $21.50 4,345 2,154 (693) (130) $10.25 $14.59 $ 6.53 $14.88 3,631 1,134 (285) (135) $ 4.81 $26.22 $ 5.06 $ 9.03 Outstanding at end of year 7,092 $17.45 5,676 $12.24 4,345 $10.25 Options exercisable at end of year 2,693 $ 9.93 1,839 $ 8.02 1,440 $ 6.08 TA B L E 3 — O U T S TA N D I N G S TO C K O P T I O N S (Shares in thousands) Range of Exercise Prices $ 1.63 $ 3.31 $ 6.06 $12.93 $20.00 $29.61 Total to to to to to $ 4.89 $ 8.69 $19.16 $28.38 $43.44 Options Outstanding as of February 28, 2005 Weighted Average Number Remaining Weighted Average Outstanding Contractual Life Exercise Price Options Exercisable as of February 28, 2005 Number Exercisable Weighted Average Exercise Price 526 1,145 452 1,955 972 2,042 2.0 3.0 1.3 8.0 4.3 9.0 $ 1.63 $ 4.82 $ 6.16 $14.31 $26.64 $29.72 526 793 452 455 448 19 $ 1.63 $ 4.79 $ 6.16 $14.34 $26.80 $40.72 7,092 6.1 $17.45 2,693 $ 9.93 CARMAX 2005 41 11 12 EARNINGS PER SHARE CarMax was a wholly owned subsidiary of Circuit City during a portion of fiscal 2003. Earnings per share for fiscal 2003 has been presented to reflect the capital structure effective with the separation of CarMax from Circuit City. All earnings per share calculations have been computed as if the separation had occurred at the beginning of fiscal 2003. Reconciliations of the numerator and denominator of basic and diluted earnings per share are presented below: Years Ended February 28 or 29 2005 2004 2003 (In thousands except per share data) Weighted average common shares Dilutive potential common shares: Options Restricted stock 104,036 103,503 102,983 1,728 15 2,113 12 1,579 8 105,779 105,628 104,570 $112,928 $116,450 $ 94,802 $ 1.09 $ 1.13 $ 0.92 $ 1.07 $ 1.10 $ 0.91 Weighted average common shares and dilutive potential common shares Net earnings available to common shareholders Basic net earnings per share Diluted net earnings per share LEASE COMMITMENTS The company conducts most of its business in leased premises. The company’s lease obligations are based upon contractual minimum rates. CarMax operates 23 of its superstores pursuant to various leases under which its former parent Circuit City was the original tenant and primary obligor. Circuit City had originally entered into these leases so that CarMax could take advantage of the favorable economic terms available at that time to Circuit City as a large retailer. Circuit City has assigned each of these leases to CarMax. Despite the assignment and pursuant to the terms of the leases, Circuit City remains contingently liable under the leases. In recognition of this ongoing contingent liability, CarMax made a one-time special dividend payment of $28.4 million to Circuit City on the October 1, 2002, separation date. Rent expense for all operating leases was $61.5 million in fiscal 2005, $54.2 million in fiscal 2004, and $48.1 million in fiscal 2003. Most leases provide that the company pay taxes, maintenance, insurance, and operating expenses applicable to the premises. The initial term of most real property leases will expire within the next 20 years; however, most of the leases have options providing for renewal periods of 5 to 20 years at terms similar to the initial terms. For operating leases, rent is recognized on a straight-line basis over the lease term, including scheduled rent increases and rent holidays. As of February 28, 2005, future minimum fixed lease obligations, excluding taxes, insurance, and other costs payable directly by the company, were approximately: (In thousands) Certain options were outstanding and not included in the computation of diluted earnings per share because the options’ exercise prices were greater than the average market price of the common shares. Excluded from the computations were options to purchase 26,580 shares of CarMax, Inc. common stock with exercise prices ranging from $30.34 to $43.44 per share at the end of fiscal 2005; options to purchase 18,364 shares with exercise prices ranging from $35.23 to $43.44 per share at the end of fiscal 2004; and options to purchase 1,053,610 shares with exercise prices ranging from $18.60 to $43.44 per share at the end of fiscal 2003. 42 CARMAX 2005 Fiscal Fiscal Fiscal Fiscal Fiscal Fiscal 2006 2007 2008 2009 2010 2011 and thereafter Total minimum lease payments Less amounts representing interest Present value of net minimum capital lease payments [Note 9] Capital Leases Operating Lease Commitments $ 3,201 3,341 3,341 3,351 3,503 47,901 $ 61,312 60,500 60,305 60,676 61,323 586,140 64,638 $890,256 (35,889) $ 28,749 The company entered into sale-leaseback transactions involving seven superstores valued at approximately $84.0 million in fiscal 2005, and sale-leaseback transactions for nine superstores valued at approximately $107.0 million in fiscal 2004. The resulting leases have initial terms of 15 or 20 years with various renewal options. All sale-leaseback transactions are structured at competitive rates. Gains or losses on sale-leaseback transactions are recorded as deferred rent and amortized over the terms of the leases. The company does not have continuing involvement under the sale-leaseback transactions. In conjunction with certain sale-leaseback transactions, the company must meet financial covenants relating to minimum tangible net worth and minimum coverage of rent expense. The company was in compliance with all such covenants at February 28, 2005. 13 CONTINGENT LIABILITIES (A) Litigation In the normal course of business, the company is involved in various legal proceedings. Based upon the company’s evaluation of the information presently available, management believes that the ultimate resolution of any such proceedings will not have a material adverse effect on the company’s financial position, liquidity, or results of operations. ( B ) O t h e r M a t t e rs In accordance with the terms of real estate lease agreements, the company generally agrees to indemnify the lessor from certain liabilities arising as a result of the use of the leased premises, including environmental liabilities and repairs to leased property upon termination of the lease. Additionally, in accordance with the terms of agreements entered into for the sale of our properties, the company generally agrees to indemnify the buyer from certain liabilities and costs arising subsequent to the date of the sale, including environmental liabilities and liabilities resulting from the breach of representations or warranties made in accordance with the agreements. The company does not have any known material environmental commitments, contingencies, or other indemnification issues arising from these arrangements. As part of its customer service strategy, the company guarantees the vehicles it retails with a 30-day limited warranty. A vehicle in need of repair within 30 days of the customer’s purchase will be repaired free of charge. As a result of this guarantee, each vehicle sold has an implied liability associated with it. Accordingly, the company records a provision for repairs during the guarantee period for each vehicle sold based on historical trends. The liability for this guarantee was $1.9 million at February 28, 2005, and $1.4 million at February 29, 2004, and is included in accrued expenses and other current liabilities in the consolidated balance sheets. 14 RECENT ACCOUNTING PRONOUNCEMENTS SFAS No. 123R, “Share-Based Payment,” replaces SFAS No. 123, “Accounting for Stock-Based Compensation” and supercedes APB 25, “Accounting for Stock Issued to Employees.” This new standard requires a public entity to measure the cost of employee services received in exchange for an award of equity instruments based on the grant-date fair value of the award. That cost will be recognized over the period during which an employee is required to provide service in exchange for the award (usually the vesting period). In accordance with the revised statement, the company will be required to recognize the expense attributable to stock options effective with the company’s 2007 fiscal year, beginning March 1, 2006. The company has not yet determined the impact of adopting SFAS 123R on its financial position, results of operations, or cash flows. 15 S U P P L E M E N TA L F I N A N C I A L S TAT E M E N T I N F O R M AT I O N (A) Goodwill and Other Intangibles Other assets on the consolidated balance sheets included goodwill and other intangibles with a carrying value of $15.0 million as of February 28, 2005, and $16.0 million as of February 29, 2004. ( B ) Ac c r u e d C o m p e n s a t i o n a n d B e n e f i t s Accrued expenses and other current liabilities on the consolidated balance sheets included accrued compensation and benefits of $53.8 million as of February 28, 2005, and $44.5 million as of February 29, 2004. ( C ) Ad ve r t i s i n g E x p e n s e Selling, general, and administrative expenses on the consolidated statements of earnings included advertising expense of $73.6 million in fiscal 2005, $62.4 million in fiscal 2004, and $52.4 million in fiscal 2003. Advertising expenses were 1.4% of net sales and operating revenues for fiscal 2005 and fiscal 2004 and 1.3% for fiscal 2003. 16 SUBSEQUENT EVENTS In April 2005, the company completed a $617.0 million public securitization of automobile loan receivables. The company also completed the sale-leaseback of one superstore for proceeds of $16.7 million. CARMAX 2005 43 17 S E L E C T E D Q UA R T E R LY F I N A N C I A L DATA First Quarter 2005 2004 (In thousands except per share data) Net sales and operating revenues Gross profit CarMax Auto Finance income Selling, general, and administrative expenses Gain (loss) on franchise dispositions Net earnings Net earnings per share: Basic Diluted (UNAUDITED) Second Quarter 2005 2004 Third Quarter 2005 2004 Fourth Quarter 2005 2004 Fiscal Year 2005 2004 $1,324,990 $1,172,835 $1,323,507 $1,236,457 $1,215,711 $1,071,534 $1,396,054 $1,116,865 $5,260,262 $4,597,691 $ 167,230 $ 147,771 $ 163,200 $ 163,105 $ 145,446 $ 126,242 $ 174,320 $ 133,770 $ 650,196 $ 570,888 $ 21,816 $ 25,748 $ 20,744 $ 22,677 $ 20,439 $ 17,649 $ 19,657 $ 18,889 $ 82,656 $ 84,963 $ 130,688 $ 115,553 $ 134,726 $ 120,714 $ 137,170 $ 114,282 $ 143,993 $ 117,825 $ 546,577 $ 468,374 $ $ — $ 35,330 $ — $ 35,260 $ (11) $ 29,859 $ (460) $ 39,610 $ 692 $ 18,045 $ 1,207 $ 19,053 $ (48) $ 29,694 $ $ $ 0.34 $ 0.33 $ 0.34 $ 0.34 $ 0.29 $ 0.28 $ 0.38 $ 0.37 $ 0.17 $ 0.17 $ 0.18 $ 0.18 $ 0.28 $ 0.28 $ 1,580 $ 633 $ 2,327 22,526 $ 112,928 $ 116,450 0.22 $ 0.21 $ 1.09 $ 1.07 $ 1.13 1.10 MANAGEMENT’S ANNUAL REPORT ON INTERNAL CONTROL OVER FINANCIAL REPORTING Management is responsible for establishing and maintaining adequate internal control over financial reporting for the company. Because of its inherent limitations, internal control over financial reporting may not prevent or detect misstatements. Accordingly, even effective internal control over financial reporting can provide only reasonable assurance regarding the reliability of financial reporting and the preparation of financial statements for external purposes in accordance with generally accepted accounting principles. Management conducted an evaluation of the effectiveness of our internal control over financial reporting based on the framework and criteria established in Internal Control — Integrated Framework, issued by the Committee of Sponsoring Organizations of the Treadway Commission. Based on this evaluation, our management has concluded that our internal control over financial reporting was effective as of February 28, 2005. KPMG LLP, the company’s independent registered public accounting firm, has issued a report on our management’s assessment of our internal control over financial reporting. This report is included herein. AUSTIN LIGON PRESIDENT AND CHIEF EXECUTIVE OFFICER KEITH D. BROWNING EXECUTIVE VICE PRESIDENT AND CHIEF FINANCIAL OFFICER 44 CARMAX 2005 REPORT OF INDEPENDENT REGISTERED PUBLIC ACCOUNTING FIRM The Board of Directors and Shareholders CarMax, Inc.: We have audited the accompanying consolidated balance sheets of CarMax, Inc. and subsidiaries (the “Company”) as of February 28, 2005 and February 29, 2004, and the related consolidated statements of earnings, shareholders’ equity, and cash flows for each of the fiscal years in the three-year period ended February 28, 2005. These consolidated financial statements are the responsibility of the Company’s management. Our responsibility is to express an opinion on these consolidated financial statements based on our audits. We conducted our audits in accordance with the standards of the Public Company Accounting Oversight Board (United States). Those standards require that we plan and perform the audit to obtain reasonable assurance about whether the financial statements are free of material misstatement. An audit includes examining, on a test basis, evidence supporting the amounts and disclosures in the financial statements. An audit also includes assessing the accounting principles used and significant estimates made by management, as well as evaluating the overall financial statement presentation. We believe that our audits provide a reasonable basis for our opinion. In our opinion, the consolidated financial statements referred to above present fairly, in all material respects, the financial position of CarMax, Inc. and subsidiaries as of February 28, 2005 and February 29, 2004, and the results of their operations and their cash flows for each of the fiscal years in the three-year period ended February 28, 2005, in conformity with U.S. generally accepted accounting principles. We also have audited, in accordance with the standards of the Public Company Accounting Oversight Board (United States), the effectiveness of the Company’s internal control over financial reporting as of February 28, 2005, based on criteria established in Internal Control — Integrated Framework issued by the Committee of Sponsoring Organizations of the Treadway Commission (COSO), and our report dated May 3, 2005, expressed an unqualified opinion on management’s assessment of, and the effective operation of, internal control over financial reporting. RICHMOND, VIRGINIA MAY 3, 2005 CARMAX 2005 45 REPORT OF INDEPENDENT REGISTERED PUBLIC ACCOUNTING FIRM The Board of Directors and Shareholders CarMax, Inc.: We have audited management’s assessment, included in the accompanying Management’s Annual Report on Internal Control Over Financial Reporting that CarMax, Inc. and subsidiaries (the “Company”) maintained effective internal control over financial reporting as of February 28, 2005, based on criteria established in Internal Control — Integrated Framework issued by the Committee of Sponsoring Organizations of the Treadway Commission (COSO). The Company’s management is responsible for maintaining effective internal control over financial reporting and for its assessment of the effectiveness of internal control over financial reporting. Our responsibility is to express an opinion on management’s assessment and an opinion on the effectiveness of the Company’s internal control over financial reporting based on our audit. We conducted our audit in accordance with the standards of the Public Company Accounting Oversight Board (United States). Those standards require that we plan and perform the audit to obtain reasonable assurance about whether effective internal control over financial reporting was maintained in all material respects. Our audit included obtaining an understanding of internal control over financial reporting, evaluating management’s assessment, testing and evaluating the design and operating effectiveness of internal control, and performing such other procedures as we considered necessary in the circumstances. We believe that our audit provides a reasonable basis for our opinion. A company’s internal control over financial reporting is a process designed to provide reasonable assurance regarding the reliability of financial reporting and the preparation of financial statements for external purposes in accordance with generally accepted accounting principles. A company’s internal control over financial reporting includes those policies and procedures that (1) pertain to the maintenance of records that, in reasonable detail, accurately and fairly reflect the transactions and dispositions of the assets of the company; (2) provide reasonable assurance that transactions are recorded as necessary to permit preparation of financial statements in accordance with generally accepted accounting principles, and that receipts and expenditures of the company are being made only in accordance with authorizations of management and directors of the company; and (3) provide reasonable assurance regarding prevention or timely detection of unauthorized acquisition, use, or disposition of the company’s assets that could have a material effect on the financial statements. Because of its inherent limitations, internal control over financial reporting may not prevent or detect misstatements. Also, projections of any evaluation of effectiveness to future periods are subject to the risk that controls may become inadequate because of changes in conditions, or that the degree of compliance with the policies or procedures may deteriorate. In our opinion, management’s assessment that the Company maintained effective internal control over financial reporting as of February 28, 2005, is fairly stated, in all material respects, based on criteria established in Internal Control — Integrated Framework issued by the Committee of Sponsoring Organizations of the Treadway Commission (COSO). Also, in our opinion, the Company maintained, in all material respects, effective internal control over financial reporting as of February 28, 2005, based on criteria established in Internal Control — Integrated Framework issued by the Committee of Sponsoring Organizations of the Treadway Commission (COSO). We also have audited, in accordance with the standards of the Public Company Accounting Oversight Board (United States), the consolidated balance sheets of CarMax, Inc. and subsidiaries as of February 28, 2005 and February 29, 2004, and the related consolidated statements of earnings, shareholders’ equity, and cash flows for each of the fiscal years in the three-year period ended February 28, 2005, and our report dated May 3, 2005 expressed an unqualified opinion on those consolidated financial statements. RICHMOND, VIRGINIA MAY 3, 2005 46 CARMAX 2005 C O M PA N Y O F F I C E R S S E N I O R M A N AG E M E N T T E A M AUSTIN LIGON DAVE BANKS ED HILL SCOTT RIVAS President Chief Executive Officer Vice President Management Information Systems Vice President Service Operations Vice President Human Resources KEITH BROWNING ANGIE SCHWARZ CHATTIN DOUGLASS MOYERS RICHARD SMITH Executive Vice President Chief Financial Officer Vice President CarMax Auto Finance Vice President Real Estate Vice President Management Information Systems TOM FOLLIARD BARBARA HARVILL KIM D. ORCUTT FRED WILSON Executive Vice President Store Operations Vice President Management Information Systems Vice President Controller Vice President Store Administration MIKE DOLAN STUART HEATON TOM REEDY CLIFF WOOD Senior Vice President Chief Information Officer Vice President General Counsel Corporate Secretary Vice President Treasurer Vice President Merchandising JOE KUNKEL Senior Vice President Marketing and Strategy C O R P O R AT E A N D F I E L D M A N AG E M E N T T E A M ANU AGARWAL JOHN DAVIS JACK HIGHTOWER JEFF RUTTEN Assistant Vice President Strategy Region Vice President Service Operations Florida Region Region Vice President Sales Operations Region Vice President General Manager Southwest Region JASON DAY Region Vice President General Manager Los Angeles Region ROD BAKER Region Vice President Service Development DANDY BARRETT Assistant Vice President Investor Relations CHRIS BARTEE Region Vice President Merchandising Southwest Region DAN BICKETT Assistant Vice President Construction and Facilities JEREMY BYRNES Assistant Vice President CarMax Auto Finance MIKE CALLAHAN Assistant Vice President CarMax Auto Finance TIM COOLEY Region Vice President Service Operations Mid-Atlantic Region RON COSTA Region Vice President Merchandising Los Angeles Region PATTY COVINGTON Assistant Vice President Deputy General Counsel Region Vice President Merchandising Atlanta Region WADE HOPPER DAN JOHNSTON MARTY SBERNA Region Vice President Service Operations Atlanta Region Region Vice President General Manager Mid-Atlantic Region GARY SHEEHAN Assistant Vice President Advertising BRIAN DUNNE TAMMY LONG LISA VAN RIPER Region Vice President Service Operations Southwest Region Assistant Vice President Business Operations Assistant Vice President Public Affairs TOM MARCEY TOM VICINI EDWARD FABRITIIS Assistant Vice President Field Human Resources Region Vice President Merchandising Mid-Atlantic Region Region Vice President General Manager Central Region JON GESKE BILL MCCHRYSTAL DONNA WASSEL Region Vice President Service Operations Los Angeles Region Region Vice President Merchandising Florida Region Region Vice President General Manager Atlanta Region TODD GIBBONS ROB MITCHELL JOE WILSON Region Vice President Service Operations Central Region Assistant Vice President Consumer Finance Region Vice President Merchandising Central Region MICHELLE HALASZ Assistant Vice President Media LAURA DONAHUE Assistant Vice President Deputy General Counsel RANDY HARDEN Assistant Vice President Marketing JOHN MONTEGARI BILL NASH Assistant Vice President Auction Services Assistant Vice President Process Engineering TOM WULF Assistant Vice President Store Operations DUGALD YSKA Region Vice President General Manager Florida Region CARMAX 2005 47 BOARD OF DIRECTORS RICHARD L. SHARP AUSTIN LIGON Chairman of the Board President Chief Executive Officer CarMax, Inc. Private Investor Retired Chairman and Chief Executive Officer Circuit City Stores, Inc. (a consumer electronics specialty retailer) Richmond, Virginia CarMax, Inc. MAJOR GENERAL HUGH G. ROBINSON (U.S.A., RET.), P.E. Chairman and Chief Executive Officer KEITH BROWNING Granville Construction & Development Co., Inc. (a low- and moderate-income housing construction firm) Dallas, Texas Executive Vice President Chief Financial Officer THOMAS G. STEMBERG Founder and Chairman Emeritus CarMax, Inc. JAMES F. CLINGMAN, JR. Staples, Inc. (an office supply superstore retailer) Retired President and Chief Operating Officer Venture Partner H.E. Butt Grocery Company (a food retailer) San Antonio, Texas Highland Capital Partners (a venture capital firm) Framingham, Massachusetts JEFFREY E. GARTEN BETH A. STEWART Dean, Yale School of Management Chairman and Chief Executive Officer Yale University New Haven, Connecticut Storetrax.com (an Internet real estate listing service) President W. ROBERT GRAFTON Retired Managing Partner — Chief Executive Andersen Worldwide, S.C. (an accounting and professional services firm) Potomac, Maryland Stewart Real Estate Capital (a real estate investment company) Bernardsville, New Jersey WILLIAM R. TIEFEL Chairman Emeritus WILLIAM S. KELLOGG Retired Chairman and Chief Executive Officer Kohl’s Corporation (an apparel and home products retailer) Oconomowoc, Wisconsin The Ritz-Carlton Hotel Company, L.L.C. Retired Vice Chairman Marriott International, Inc. Palm Beach, Florida B OA R D C O M M I T T E E S EXECUTIVE AUDIT COMPENSATION AND PERSONNEL NOMINATING AND GOVERNANCE Austin Ligon W. Robert Grafton, Chairman Hugh G. Robinson, Chairman William R. Tiefel, Chairman Keith Browning James F. Clingman, Jr. James F. Clingman, Jr. Jeffrey E. Garten Hugh G. Robinson W. Robert Grafton William S. Kellogg Beth A. Stewart William S. Kellogg Thomas G. Stemberg Beth A. Stewart William R. Tiefel 48 CARMAX 2005 C O R P O R AT E A N D S H A R E H O L D E R I N F O R M AT I O N HOME OFFICE TRANSFER AGENT AND REGISTRAR CarMax, Inc. 4900 Cox Road Glen Allen,Virginia 23060-6295 Telephone: (804) 747-0422 Contact our transfer agent for questions regarding your stock certificates, including changes of address, name, or ownership; lost certificates; or to consolidate multiple accounts. Wells Fargo Shareowner Services 161 North Concord Exchange South St. Paul, Minnesota 55075 Toll free: (800) 468-9716 Hearing impaired: (651) 450-4144 www.wellsfargo.com/shareownerservices As of October 1, 2005: 12800 Tuckahoe Creek Parkway Richmond,Virginia 23238 WEBSITE www.carmax.com F I N A N C I A L I N F O R M AT I O N S T O C K I N F O R M AT I O N For quarterly sales and earnings information, financial reports, filings with the Securities and Exchange Commission (including Form 10-K), news releases, and other investor information, please visit our investor website at http://investor.carmax.com. Information may also be obtained from the Investor Relations Department at: E-mail: [email protected] Telephone: (804) 747-0422, ext. 4489 CarMax, Inc. common stock is traded on the New York Stock Exchange under the ticker symbol KMX. C E O A N D C F O C E R T I F I C AT I O N S A N N UA L S H A R E H O L D E R S ’ M E E T I N G Tuesday, June 21, 2005, at 10:00 a.m. The Richmond Marriott West Hotel 4240 Dominion Boulevard Glen Allen,Virginia 23060 At February 28, 2005, there were approximately 5,150 CarMax shareholders of record. Q U A R T E R LY S T O C K P R I C E R A N G E DESIGN: VIVO Design, Inc. STORE PHOTOGRAPHY : Jeff Zaruba PRINTING: Peake DeLancey Printers The following table sets forth by fiscal quarter the high and low reported prices of the company’s common stock for the last two fiscal years: First Quarter Second Quarter Third Quarter Fourth Quarter CarMax’s chief executive officer and chief financial officer have filed with the SEC the certifications required by Section 302 of the Sarbanes-Oxley Act of 2002 regarding the quality of the company’s public disclosure.These certifications are included as exhibits to the Annual Report on Form 10-K for fiscal 2005. In addition, CarMax’s chief executive officer annually certifies to the NYSE that he is not aware of any violation by CarMax of the NYSE’s corporate governance listing standards.This certification was submitted, without qualification, as required after the 2004 annual meeting of CarMax’s shareholders. C O R P O R AT E G O V E R N A N C E I N F O R M AT I O N Fiscal 2005 High $36.20 $23.79 $30.25 $34.80 Low $20.60 $18.05 $19.23 $26.05 High $24.10 $38.72 $39.30 $37.10 Low $12.45 $23.08 $30.08 $28.71 Fiscal 2004 Copies of the CarMax Corporate Governance Guidelines, the Code of Conduct, and the charters for each of the Audit Committee, Nominating and Governance Committee, and Compensation and Personnel Committee are available from our investor website, at http://investor.carmax.com, under the corporate governance tab. Alternatively, shareholders may obtain, without charge, copies of these documents by writing to Investor Relations at the CarMax home office. DIVIDEND POLICY I N V E S T O R R E L AT I O N S To date, CarMax has not paid a cash dividend on its common stock.The company presently intends to retain its earnings for use in its operations and for geographic expansion and, therefore, does not anticipate paying any cash dividends in the foreseeable future. Security analysts are invited to contact: Dandy Barrett, Assistant Vice President, Investor Relations Telephone: (804) 935-4591 G E N E R A L I N F O R M AT I O N INDEPENDENT AUDITORS KPMG LLP 1021 East Cary Street, Suite 2000 Richmond,Virginia 23219-4023 Members of the media and others seeking general information about CarMax should contact: Lisa Van Riper, Assistant Vice President, Public Affairs Telephone: (804) 935-4594 CARMAX, CARMAX THE AUTO SUPERSTORE, THE CARMAX ADVANTAGE, 5 DAY MONEY BACK GUARANTEE (and design), VALUMAX and CARMAX.COM are all registered trademarks or service marks of CarMax. Other company, product, and service names may be trademarks or service marks of their respective owners. CARMAX, INC. 4900 COX ROAD GLEN ALLEN VIRGINIA 23060-6295 804.747.0422 WWW.CARMAX.COM
© Copyright 2026 Paperzz