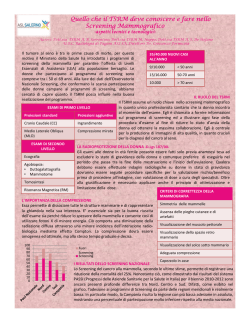
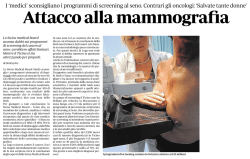
© American College of Medical Genetics and Genomics
Original Research Article
Cystic fibrosis carrier screening effects on birth prevalence
and newborn screening
Carlo Castellani, MD1, Luigi Picci, PhD2, Gloria Tridello, MSc1, Elia Casati, PhD1, Anna Tamanini, PhD3,
Lucia Bartoloni, PhD4, Maurizio Scarpa, MD2, Baroukh M. Assael, MD1, and the Veneto CF Lab Network
Purpose: We evaluated the effects of cystic fibrosis (CF) carrier
screening on birth prevalence trends and newborn screening (NBS)
efficiency by comparing two Italian regions; carrier screening was
performed in one region (eastern region (ER)) and not in the other
(western region (WR)).
Methods: Annual births of infants with CF, NBS false-positive
results, NBS uncertain diagnoses (borderline sweat chloride (BSC)),
carrier tests performed, and carriers detected were monitored during
the 1993–2013 period.
Measurements and main results: A total of 259 newborns with
CF were detected. In the ER, 150 carrier couples were found. Mean
annual percentage of birth prevalence decrease was 9% per 10,000
(P = 0.002) and was greater in the ER (15%, P = 0.0008; WR 1%,
INTRODUCTION
Cystic fibrosis (CF), the most frequent life-shortening autosomal recessive disease in countries with a predominantly
Caucasian population, is caused by mutations in the CF transmembrane conductance regulator (CFTR) gene.1
Because of the disease’s severe clinical manifestations, the
heavy burden of daily care, and the shortened life expectancy,
carrier testing is routinely offered to relatives of CF patients.
The CF carrier test may also be offered to individuals of reproductive age with no family history of CF. This carrier screening
strategy has been recommended by the American College of
Medical Genetics and Genomics2 and by the American College
of Obstetricians and Gynecologists,3 whereas the European
CF Society leaves the decision regarding its establishment up
to individual countries.4 Although no structured communitywide carrier screening has been implemented by any health
jurisdiction, in the United States millions of carrier tests have
been performed.5 The CF carrier test is also offered to the general population in Israel6 and in parts of Australia7 and Italy.8
CF carrier screening has been found to be connected with a
decrease in the annual birth prevalence of the disease in the
United Kingdom, the United States, and Italy.8–10
Early diagnosis and management has been associated with
better lung function and nutrition, as well as with reduced
P = ns). The WR estimated birth prevalence was 1/3,589 in 1993 and
1/3,870 in 2013; in the ER it was 1/2,730 in 1993 and 1/14,200 in
2013. The ER birth prevalence correlated inversely with the number
of carrier couples (P = 0.0032). The ratio between CF cases and NBSpositive results significantly decreased in the ER (1.6%, P = 0.0001)
but not in the WR. The ratio between prevalence of BSC and of CF
cases increased in the ER (P = 0.008) but not in the WR (P = 0.1).
Conclusion: Carrier screening was connected with a decrease in
birth prevalence of CF. Poorer NBS performance was observed in the
carrier screening area.
Genet Med advance online publication 18 June 2015
Key Words: birth prevalence; carrier screening; carrier testing;
cystic fibrosis; newborn screening
burden and cost of care.11–13 To detect infants with CF soon after
birth, newborn screening (NBS) has been implemented in most
of Europe, North America, and Oceania,14,15 and it is considered
standard care.16,17 NBS-positive neonates undergo sweat chloride measurements to distinguish affected infants and healthy
infants with false-positive results. In a subset of these infants,
CF can be neither confirmed nor excluded. Several definitions
have been suggested for this condition. In the United States it
has been called “CFTR-related metabolic syndrome,”18 and in
Europe it is sometimes called “equivocal CF diagnosis” or “CF
screening–positive inconclusive diagnosis.”.19 In this article
these situations are referred to as “uncertain CF.”
The detection of false-positive results and of uncertain CF in
infants is generally considered a secondary effect of the NBS
system, and NBS programs are designed to minimize their
number.15 It may be argued that the decrease in birth prevalence of CF associated with CF carrier screening8 impairs the
outcome of NBS by altering the proportions of CF, uncertain
CF, and false-positive cases.20
This study was aimed at determining whether a negative
correlation between carrier screening and birth prevalence
of CF previously shown in northeastern Italy8 is confirmed
over a longer period, as well as whether it affects NBS
practice.
Cystic Fibrosis Center, Azienda Ospedaliera Universitaria Integrata, Verona, Italy; 2Department of Pediatrics, University of Padua, Padua, Italy; 3Clinical Chemistry and Hematology
Laboratory, Azienda Ospedaliera Universitaria Integrata, Verona, Italy; 4ULSS 12 “Veneziana”–Ospedale SS.Giovanni e Paolo–Venezia, Venezia, Italy; Correspondence: Carlo
Castellani ([email protected])
1
Submitted 27 October 2014; accepted 14 April 2015; advance online publication 18 June 2015. doi:10.1038/gim.2015.68
Genetics in medicine | Volume 18 | Number 2 | February 2016
145
Original Research Article
MATERIALS AND METHODS
Areas undergoing study and NBS and carrier screening
procedures
Two administrative regions in northeastern Italy (Veneto
and Trentino Alto-Adige) were considered. Data collection
involved two subareas: the eastern region (ER) and the western region (WR).
In both regions, CF in newborns is closely monitored by a
long-standing NBS program, whose first tier is immunoreactive trypsinogen (IRT) measurement, followed by mutation
analysis and meconium lactase determination in newborns
with high IRT.8 A single laboratory performs all NBS procedures (except local collection of samples), and IRT cutoffs
and mutation panels used for the ER and WR are identical.
The number of mutations tested has progressively increased
since 1993 and until 2004 (Supplementary Table S3 online).
Neonates with increased IRT levels at birth and at least one
mutation or high meconium lactase levels are considered
NBS-positive and are sweat-tested. Neonates with high IRT
at birth, no mutations detected, and normal meconium lactase are resampled by 1 month of age; if IRT is persistently
elevated, then they are also considered NBS-positive and are
sweat-tested.
In the ER the CF carrier test, although not included among
public health screening programs, is proactively offered by
many gynecologists and general practitioners to individuals or
couples of reproductive age, either preconceptionally or prenatally. This practice started in 1994 and has been steadily increasing ever since. Carrier screening has not been implemented in
the WR, where the carrier test is offered only to relatives of CF
patients or, more recently, to infertile couples planning assisted
reproduction.
Data originating from NBS
Annual data collected for the 1993–2013 period were as follows.
Annual births of infants with CF. Inclusion criteria were
positive NBS and/or meconium ileus plus two sweat
chloride measurements ≥60 mmol/l. Twenty-one neonates
with increased IRT who had not been sweat-tested but
carried two CF-causing mutations associated with high
sweat chloride values21 were also included (Supplementary
Table S1 online). Those with NBS false-negative results
were excluded from the analysis to avoid a time-related
recruitment bias because the number of diagnoses due to
symptom manifestation may be higher in remote than in
recent years.
Because one of the aims of this study was to assess the potential consequences of carrier screening on NBS performance,
infants with meconium ileus, who presumably would have been
diagnosed at birth regardless of NBS, were excluded from the
analysis of the correlation between birth prevalence trends and
numbers of either false-positive results or cases of borderline
sweat chloride originating from NBS.
146
CASTELLANI et al | Cystic fibrosis carrier and newborn screening interactions
Annual number of NBS false positives. Inclusion criteria were
positive NBS and sweat chloride level less than 30 mmol/l.
Annual number of infants with borderline sweat chloride
values (BSC infants). Inclusion criteria were positive NBS and
sweat chloride level between 30 and 59 mmol/l (highest of two
sweat test results). These infants received an “uncertain CF”
diagnosis. The group includes eight children who eventually
had CF diagnosed.
Data originating from carrier screening
An inquiry about molecular laboratories offering CFTR molecular analysis in the ER was carried out through various information channels, including previous publications,8 regional
archives, and genetic counseling databases. These laboratories
were asked to participate in a working group that contributed
data and participated in the study design and interpretation of
results (Veneto CF Lab Network).
Data were collected for the period January 1993 to December
2013 and included the following: (i) number of carrier tests
performed per year, (ii) number of carriers detected per year,
(iii) number of carrier couples detected per year, (iv) number
of prenatal diagnoses performed per year, and (v) number of
affected fetuses diagnosed through prenatal diagnosis per year.
For items (ii), (iii), (iv), and (v), only CF-causing mutations
as defined by the CFTR2 project21 were considered (22 July
2013 version). It is likely that data from items (iv) and (v) represent an underestimation, as only a few of the laboratories offer
molecular analysis for prenatal diagnosis and several carrier
couples may have accessed care at other places.
Most, but not all, of the laboratories in the network were the
same as those contacted in a previous survey, which explains
the slight difference in the two reports.8
Statistical analyses
Descriptive statistics were reported in percentages for categorical variables and as mean, standard deviation, median, and
range for continuous variables.
The annual CF birth prevalence was estimated as the ratio
between the new CF cases diagnosed by NBS and the total
number of newborns tested.
A linear regression model was used to estimate the timerelated variation of CF birth prevalence, the variation of BSC
prevalence, the ratio between the prevalence of BSC and CF in
newborns, the positive predictive value (PPV) (ratio between
true positives and the total of true positives and false positives
of the NBS system), and the prevalence of false positives. The
regression model was also used to calculate the estimated prevalence for each year. In all models, the difference between the
ER and the WR was tested.
To reduce variability, 3-year groups were considered to
compute estimated annual birth prevalence. The correlation
between the annual birth prevalence of CF cases (meconium
ileus excluded) and the numbers of carrier tests, detected carriers, and carrier couples in the ER was analyzed by Pearson
Volume 18 | Number 2 | February 2016 | Genetics in medicine
Original Research Article
Cystic fibrosis carrier and newborn screening interactions | CASTELLANI et al
difference: −14%; P = 0.02) (Figure 1). Estimated birth prevalence in the WR moved from 1/3,589 in 1993 to 1/3,870 in
2013; in the ER it moved from 1/2,730 in 1993 to 1/14,200
in 2013. These estimates were obtained from the following
models: ER birth prevalence = 298.4–0.15 × years; WR birth
prevalence = 23.0–0.01 × years; and entire-area birth prevalence = 191.4–0.09 × years.
To reduce variability, the analyses were repeated using 3-year
cell sizes and the results were confirmed, with the exception of
the ER–WR difference, which approached statistical significance (P = 0.053) (Supplementary Figure S5 online).
Mutation analysis data were collected from 16 laboratories
in the ER. From 1994 to 2013 174,494 carrier tests were performed; 5,966 carriers and 150 carrier couples were detected.
The annual numbers of carrier tests, detected carriers, carrier
couples, prenatal diagnoses, and consequently detected affected
fetuses are reported in Table 2. Carrier rate (number of carriers/number of tests) was 1/29. Birth prevalence of CF cases
in the ER showed a significant negative correlation of −0.69
(bootstrap 95% CI: −0.84 to −0.50) with the number of tests
(P = 0.0005), a negative correlation of −0.69 (bootstrap 95%
CI: −0.83 to −0.49) with the number of carriers (P = 0.0005),
correlation; confidence intervals were obtained using bootstrap analysis.22 The protocol study was approved by the Verona
Hospital Ethics Committee (PROG. CE 2394).
RESULTS
Birth prevalence and carrier screening
Over the study period, the total number of screened neonates
was 1,112,620 (685,575 in the ER; 427,045 in the WR), with
an annual average of 52,982. A total of 259 newborns with CF
were detected through NBS and/or because of meconium ileus
(145 in the ER, 114 in the WR). Annual distributions in the
ER and in the WR are shown in Table 1. Twelve infants with
CF (positive sweat chloride test results) were missed by the
NBS program, but CF was later revealed by the development
of clinical manifestations consistent with CF. The average CF
birth prevalence for the period was 1/4,296 (1/4,106 including
false-negative results).
A time-related decrease in birth prevalence was confirmed, with a mean annual percentage decrease of 9% (95%
CI: 4–15%; P = 0.002). The rate of decrease was greater in
the ER (ER: decrease rate, 15%; 95% CI: 7–23%; P = 0.0008;
WR: decrease rate; 1%; 95% CI: −8 to 10%; P = ns; ER-WR
Table 1 Annual distribution of newborns with CF in the ER, the WR, and in the entire study area (CF with meconium ileus
included)
East region
West region
Observed Estimated
birth
birth
prevalence prevalence
(per 10,000 (per 10,000
newborns) newborns) Screened
CF
Total
Observed Estimated
birth
birth
prevalence prevalence
(per 10,000 (per 10,000
newborns) newborns)
Observed
Estimated
birth
birth
prevalence prevalence
(per 10,000 (per 10,000
newborns) newborns)
Year
Screened
CF
Screened
CF
1993
28,852
10
3.466
3.663
17,846
6
3.362
2.786
46,698
16
3.426
3.322
1994
29,029
12
4.134
3.515
17,956
5
2.785
2.776
46,985
17
3.618
3.228
1995
28,922
17
5.879
3.367
17,890
3
1.677
2.766
46,812
20
4.272
3.134
1996
30,056
10
3.327
3.219
18,591
6
3.228
2.756
48,647
16
3.289
3.040
1997
30,458
4
1.313
3.070
18,839
5
2.654
2.746
49,297
9
1.826
2.945
1998
31,126
10
3.212
2.923
19,252
6
3.116
2.736
50,378
16
3.176
2.851
1999
31,729
9
2.837
2.775
19,626
8
4.077
2.726
51,355
17
3.310
2.756
2000
31,918
9
2.820
2.627
19,742
5
2.533
2.715
51,660
14
2.710
2.662
2001
32,939
5
1.518
2.479
20,375
9
4.417
2.706
53,314
14
2.626
2.567
2002
32,300
4
1.238
2.331
19,993
2
1.000
2.695
52,293
6
1.147
2.473
2003
33,923
11
3.243
2.183
20,768
3
1.444
2.685
54,691
14
2.560
2.379
2004
34,735
4
1.152
2.035
21,592
7
3.241
2.675
56,327
11
1.953
2.284
2005
34,872
4
1.147
1.888
21,572
3
1.391
2.665
56,444
7
1.240
2.190
2006
35,345
3
0.849
1.739
21,766
6
2.756
2.655
57,111
9
1.576
2.096
2007
35,630
3
0.842
1.592
21,989
7
3.184
2.645
57,619
10
1.736
2.001
2008
36,287
2
0.551
1.444
22,593
5
2.213
2.634
58,880
7
1.189
1.907
2009
35,484
5
1.409
1.296
22,093
3
1.358
2.624
57,577
8
1.389
1.813
2010
33,479
9
2.688
1.148
20,844
5
2.399
2.614
54,323
14
2.577
1.718
2011
33,860
7
2.067
1.000
21,921
6
2.737
2.604
55,781
13
2.330
1.624
2012
33,437
4
1.196
0.852
21,383
2
0.935
2.594
54,820
6
1.094
1.530
2013
31,194
3
0.962
0.704
20,414
12
5.879
2.584
51,608
15
2.906
1.435
Total
68,5575
145
2.115
42,7045
114
2.670
259
2.328
11,12,620
For each year, estimated birth prevalence computed by the regression model is reported.
CF, cystic fibrosis; ER, eastern region; WR, western region.
Genetics in medicine | Volume 18 | Number 2 | February 2016
147
Original Research Article
CASTELLANI et al | Cystic fibrosis carrier and newborn screening interactions
Table 2 Annual number of tests, carriers, carrier couples,
prenatal diagnoses, and affected fetuses in the eastern
region
Birth prevalence (/10,000 newborn)
7
6
5
3
Carriers
Carrier
couples
Prenatal
diagnoses
Affected
fetuses
1993
0
0
0
0
0
1994
25
0
0
0
0
2
1995
681
34
2
0
0
1
1996
1,685
76
4
0
0
0
1997
2,275
96
6
2
0
1998
3,200
140
6
1
0
1999
3,721
159
5
2
0
2000
5,292
242
10
4
0
2001
6,447
256
10
2
1
2002
7,476
282
10
6
4
2003
8,499
315
11
5
1
2004
9,474
312
9
4
1
2005
10,921
364
12
4
0
2006
13,675
408
10
4
1
2007
15,653
495
7
3
0
2008
17,178
529
9
5
3
2009
15,215
502
11
4
0
2010
16,048
528
11
12
7
2011
15,941
541
5
5
3
2012
11,286
371
6
5
7
1993
1995
1997
1999
2001
2003
2005
2007
2009
2011
2013
Year
Figure 1 Cystic fibrosis birth prevalence trend in the eastern region
(solid line, full dots) and in the western region (dotted line, empty
dots).
and a negative correlation of −0.61 (bootstrap 95% CI: −0.79 to
−0.30) with the number of carrier couples (P = 0.0032).
NBS false-positives and intermediate sweat chlorides
A total of 206 neonates had CF diagnosed solely through NBS
(no meconium ileus). Data per year for infants with false-positive results and BSC are shown in Table 3.
There were 997 (1/1,116) NBS false-positive results. The
birth prevalence of false-positive results increased over time
in the entire area (annual increase rate, 32%; 95% CI: 11–54%;
P = 0.005) and in the two regions (increase rate, 30%; 95% CI:
9–51%, P = 0.008 in the ER; increase rate, 36%; 95% CI: 8–65%;
P = 0.01 in the WR) (Supplementary Figure S1 online). The
difference between the two slopes was −6% (P = 0.7). In the
entire area, the PPV decreased (decrease rate: 1.3%; 95% CI:
0.7–2.0%; P = 0.0005). The rate of decrease was significant in
the ER (1.6%; 95% CI: 0.9–2.3%; P = 0.0001; estimated PPV
35% in 1993; estimated PPV 3% in 2013) and was nonsignificant in the WR (estimated PPV 31% in 1993; estimated PPV
12% in 2013) (Supplementary Figure S2a,b online).The difference between the two slopes was not significant (P = 0.3).
Seventy-nine newborns with BSC were detected through NBS
(1/14,084). The birth prevalence of newborns with BSC did not
change over time significantly in the entire area (P = 0.9). There
was a significant rate of decrease in the WR (decrease rate, 6%;
95% CI: 1–11; P = 0.02), whereas a nonsignificant increment
was observed in the ER (increase rate, 3%; 95% CI: −0.3 to 7;
P = 0.07) (Supplementary Figures S3 and S4 online). The difference between the two slopes was significant (P = 0.003). The
ratio between the birth prevalence of BSC and CF in newborns
increased in the ER (5%; 95% CI: 1–8; P = 0.008), whereas a
nonsignificant decrease was observed in the WR (P = 0.1). The
difference between the two slopes was significant (P = 0.003)
(Figure 2).
DISCUSSION
This article follows up, expands on, and confirms previous
findings of the correlation between carrier screening and
decreased birth prevalence of CF.8 Moreover, this is the first
148
Tests
Year
4
2013
9,802
316
6
3
3
Total
174,494
5,966
150
71
31
study examining the effects of such birth prevalence reduction
on CF NBS.
CF carrier screening and birth prevalence
Annual births of children with CF tend to fluctuate and, in
order to interpret birth prevalence trends, several years need
to be examined. An investigation of short periods may be
misleading. In the 1983–2006 Colorado records, minor birth
prevalence variations were reported; however, when longerterm data were evaluated, no temporal trends could be ascertained.23 In Brittany, during 1990–2005, the annual average
decrease in birth prevalence was −0.6%, as opposed to −1.8%
in 1975–2009.24
We have already shown a significant decline of CF birth
prevalence over a 15-year timeframe in a northeastern Italian
territory where carrier screening is performed (ER), but not
in a nearby region where couples with negative family history for CF are not offered the carrier test (WR).8 The present study examines a longer period (21 years) and strengthens
the previous evidence by confirming a 15% (95% CI: 7–23%)
annual birth prevalence decrease in the same carrier screening area (estimated birth prevalence from 1/2,730 to 1/14,200)
as opposed to a 1% (95% CI: −8 to 10%) annual decrease in
the region where carrier screening was not offered (estimated
birth prevalence from 1/3,589 to 1/3,870). We also confirm
the inverse correlation between births of children with CF
Volume 18 | Number 2 | February 2016 | Genetics in medicine
Original Research Article
Cystic fibrosis carrier and newborn screening interactions | CASTELLANI et al
Table 3 Annual distribution of false-positive rates and infants with BSC in the ER, the WR, and in the entire study area
(CF with meconium ileus excluded)
East region
West region
Total
Year
CF
BSC
Falsepositive
1993
8
1
12
40%
4
3
6
40%
12
4
18
40%
1994
11
1
22
33%
5
4
11
31%
16
5
33
33%
1995
14
0
17
45%
2
3
15
12%
16
3
32
33%
1996
8
2
17
32%
4
2
18
18%
12
4
35
26%
1997
4
1
41
9%
2
2
24
8%
6
3
65
8%
1998
8
2
21
28%
6
1
6
50%
14
3
27
34%
1999
7
2
12
37%
7
1
9
44%
14
3
21
40%
2000
8
1
20
29%
4
4
9
31%
12
5
29
29%
2001
4
2
21
16%
8
0
8
50%
12
2
29
29%
2002
2
2
19
10%
1
1
17
6%
3
3
36
8%
2003
9
1
18
33%
3
0
20
13%
12
1
38
24%
2004
4
1
32
11%
5
5
30
14%
9
6
62
13%
2005
3
5
55
5%
2
2
29
6%
5
7
84
6%
2006
2
1
41
5%
4
1
18
18%
6
2
59
9%
2007
3
2
34
8%
5
1
14
26%
8
3
48
14%
2008
2
2
32
6%
4
0
23
15%
6
2
55
10%
2009
4
6
49
8%
2
1
46
4%
6
7
95
6%
2010
7
0
33
18%
5
1
25
17%
12
1
58
17%
2011
5
7
33
13%
3
2
26
10%
8
9
59
12%
2012
3
1
34
8%
2
2
24
8%
5
3
58
8%
2013
3
3
36
8%
9
0
20
31%
12
3
56
18%
Total
119
43
599
17%
87
36
398
18%
206
79
997
17%
PPV
CF
BSC
Falsepositive
PPV
CF
BSC
Falsepositive
PPV
BSC, borderline sweat chloride; CF, cystic fibrosis; ER, eastern region; PPV, positive predictive value; WR, western region.
Ratio borderline/CF
2.0
1.5
1.0
0.5
0.0
1993
1995
1997
1999
2001
2003
2005
2007
2009
2011
2013
Year
Figure 2 Ratio between the birth prevalence of borderline sweat
chloride and cystic fibrosis newborns in the eastern region (solid lines,
solid dots) and in the western region (dotted lines, empty dots).
and carrier couples detected by community carrier screening. In addition, we detected a significant negative correlation
between birth prevalence of CF and number of carrier tests
and of detected carriers. These results substantiate the connection between a negative trend in CF birth prevalence and the
extensive offer of carrier tests.
Interestingly, the numbers of tests performed, and consequently of carriers detected, were lower in the past two years.
Although the analysis is offered at a low cost, an unfavorable
Genetics in medicine | Volume 18 | Number 2 | February 2016
economic situation may have influenced the decision to have
the test. If this trend is confirmed, then it will be interesting to
see whether birth prevalence will start to increase again in the
next years.
The validity of the results is corroborated by the inclusion in
the study of unquestionable CF cases only, and by the previously demonstrated homogeneity of the ethnic distribution in
the west and in the east.8 The good detection rate of the neonatal diagnostic system is emphasized by the small number of
false-negative results (5% of the total diagnoses), although it
cannot be excluded that some of them, especially for those born
in more recent years, may have not yet been detected. Because
of the potential incompleteness of the false-negative data, they
were not considered in the analysis because their skewed temporal distribution would have accentuated the downward birth
prevalence trend and improperly strengthened our conclusions.
An important limitation of this study is the lack of any direct
information regarding the reproductive choices made by the
carrier couples. Data retrieval from obstetric termination
records was impracticable for privacy reasons. Also, several
couples presumably moved to other European countries for
assisted reproduction because preimplantation genetic diagnosis and heterologous fertilization were illegal in Italy for most
of the study period. Nevertheless, only two of the infants with
CF during the period studied were born from carrier couples
detected through carrier screening, which suggests that these
149
Original Research Article
couples chose not to have affected children. We acknowledge
that these choices are not necessarily universal and might have
been different in other populations or countries, depending on
the accuracy of information received, the perception of disease
severity, the availability of preimplantation or prenatal diagnosis, and the general attitude toward pregnancy termination.
Effects of carrier screening on NBS
The repercussions of population carrier screening on NBS
reported in this study are connected with the downward birth
prevalence trend.
Carrier screening affects criteria for implementation of NBS.
In the later years of the study, CF birth prevalence in the carrier
screening area was less than 1/10,000. It may be questioned
whether birth prevalence much inferior to the 1/2,500–4,000
reported in most predominantly Caucasian countries25 justifies
the implementation of NBS. Standards of care guidelines
recently produced by the European CF Society state that if
the incidence of CF is less than 1/7,000, careful evaluation is
required regarding whether NBS is reasonable.17 Although
this assertion refers more to implementing CF NBS programs
than to maintaining those already in place, the question of how
desirable it may be to assume the costs and side effects of NBS,
such as detection of carriers, false-positive results, and infants
with indeterminate diagnosis, in exchange for such relatively
small yield is a fair one. Health Technology Assessment studies
have generally supported the establishment of CF NBS,11,26 but
they were performed in populations with or using models with
higher birth prevalence. New cost-benefit analyses may be
necessary to determine the validity of CF NBS in a low-birth
prevalence context.
Carrier screening and the PPV of NBS. Most NBS programs
include mutation analysis as a second tier in IRT-positive
newborns, which entails a variable number of infants with
false-positive results being carriers. Although the detection
of a carrier newborn may originate potentially useful cascade
genetic testing in the family, a low number of false-positive
results is usually considered a marker of good quality in any
CF NBS protocol. Carrier screening is not expected to be
associated with a decrease in NBS false-positive results because
their number depends on factors other than birth prevalence
of disease, such as the setting of the IRT cutoffs and, whether
mutation analysis is included in the protocol, the frequency
of carriers in the screened population, and the sensitivity of
the mutation panel.20 This was confirmed by the study results
that showed an increase in the number of false-positive results
detected by NBS both in the ER and in the WR, a change
probably connected with the gradual expansion of the mutation
panel used by the NBS protocol.
It is controversial whether carrier screening had an effect
on NBS PPV. In the ER, the combined effect of the increase of
false-positive results and, to a lesser extent, of the decrease of
true-positive results resulted in less efficient performance of the
150
CASTELLANI et al | Cystic fibrosis carrier and newborn screening interactions
NBS system, represented by the significant decrease of its PPV.
PPV decreased in the WR as well, although not significantly,
and the difference between the ER and WR slopes was not significant either. A low PPV is a widely acknowledged drawback
of CF; the European CF Society recommends a minimum PPV
of 0.3.17 Monitoring these trends for a longer period or in larger
populations may help to confirm whether carrier screening
affects NBS PPV.
Carrier screening and the CF/uncertain CF ratio. NBS is
designed to detect infants with CF during an early stage, thus
contributing to optimizing their chances of limiting a severe and
life-shortening disease.15 Whether children with inconclusive
diagnoses uncovered by NBS may benefit from being identified
is still considered a moot point. Although a subset of these
infants may, over time, acquire a clinical phenotype consistent
with CF, many others are expected to experience evolution of
minor disorders connected with CFTR27 or to never have any
significant symptoms.18 Most of our children with BSC are
followed up at the CF Centre, and eight of them eventually
had CF diagnosed on the grounds of repeatedly positive sweat
chloride values, but so far none of them has shown any major
manifestation of lung disease.
Uncertain CF cases are distinguished by genotypes where at
least one mutation does not cause CF.18,19 Some mutations of
unclear clinical liability are included in panels used for carrier
screening (Supplementary Table S2 online), and some carriers
of them may be detected. However, given the milder clinical phenotype usually associated with these mutations and the absence
of a clear CF-causing label, their detection is not expected to have
consequences on parents’ reproductive decisions, and carrier
screening is not anticipated to have effects on the birth prevalence of uncertain CF cases detected by NBS.20 This study confirms this assumption, because the birth prevalence of newborns
with BSC did not significantly change in the ER.
In the same area, the ratio between CF and uncertain CF has
changed, and the number of uncertain CF cases detected by
NBS is now close to that of new CF cases, an event that did not
occur in the WR. This change is connected with the decreasing
numbers of newborns with CF produced by carrier screening.
However, the contemporary decline of children with BSC in
the WR makes it difficult to interpret this phenomenon. Again,
longer observations of these trends may prove useful to understand them better (Supplementary Table S4).
It is also worth mentioning that the number of uncertain
diagnoses identified by NBS was higher than that reported
because the mutation panel used in the NBS protocol included a
few mutations not acknowledged as CF-causing.21 Twenty-two
infants with negative sweat tests but two mutations—of which
at least one was not clearly connected with CF—were identified.
These infants received an uncertain CF diagnosis but, to avoid
a temporal bias, they were not included in the study because in
the 1990s the mutations of unclear clinical impact, like R117H,
were not included in the NBS mutation panel (Supplementary
Table S3 online).
Volume 18 | Number 2 | February 2016 | Genetics in medicine
Cystic fibrosis carrier and newborn screening interactions | CASTELLANI et al
This study determined that, over a long period of time, population carrier screening is connected with a significant decrease
in CF birth prevalence. Conversely, carrier screening did not
affect the number of false-positive results or of uncertain diagnoses originating from NBS. The combination of these two circumstances may possibly affect NBS efficiency.
Similar results may not necessarily be found in other areas
and populations, but if confirmed they should be taken into
consideration in the planning of CF screening policies.
SUPPLEMENTARY MATERIAL
Supplementary material is linked to the online version of the paper
at http://www.nature.com/gim
ACKNOWLEDGMENTS
This study was supported by grant 8/2011 from the Italian CF
Foundation and a grant from the Italian Ministry of Health–CCM,
Agenzia Nazionale per I Servizi Sanitari Regionali, Cod. CUP
I85J12001480001. Some of the results in this paper were presented in abstract form at the 28th Annual North American Cystic Fibrosis Conference and published in Pediatric Pulmonology,
49(S38):S1–S86, September 2014.
The members of the Veneto CF Lab Network are Albertin M., Casa
di Cura Abano Terme–Abano Terme; Bonfante A., ULSS 3–Ospedale di Bassano–Bassano del Grappa; Boni S., ULSS 1-Ospedale
di Belluno–Belluno; Businaro V., RDI (Rete Diagnostica Italiana)–
Limena; Cardarelli L., Citotest–Sarmeola di Rubano; Delle Carbonare M., Research & Innovation–Padova; Dulcetti F., Toma
Advanced Biomedical Assays–Busto Arsizio; Egiziano S., ULSS
12 “Veneziana”–Ospedale SS.Giovanni e Paolo–Venezia; Fabris
M, Research & Innovation–Padova; Guercini N., ULSS 6 Vicenza–
Ospedale di Vicenza–Vicenza; Hladnik U., Fondazione Malattie
Rare “Mauro Baschirotto”–Costozza di Longare; La Grasta G.,
Research & Innovation–Padova; Lapucci C., Genetic Lab–Noventa
Vicentina; Leon A., Research & Innovation–Padova; Lippi E., RDI
(Rete Diagnostica Italiana)–Limena; Lorenzetto E., Fondazione
Malattie Rare “Mauro Baschirotto”–Costozza di Longare; Mancini
B., ULSS 6 Vicenza–Ospedale di Vicenza–Vicenza; Marcante R.,
ULSS 4 Alto Vicentino–Ospedale di Santorso–Santorso; Montaldi
A., ULSS 6 Vicenza–Ospedale di Vicenza–Vicenza; Passarotto M.,
Emolab–Conselve; Saccilotto D., ULSS 3–Ospedale di Bassano–
Bassano del Grappa; Sanavio M., Emolab–Conselve; Veronesi A.,
ULSS 15 “Alta Padovana”–Padova; and Zocca E., Centro Medico
Valentini/SELAB–Piombino Dese.
DISCLOSURE
The authors declare no conflict of interest.
References
1.
2.
3.
Rommens JM, Iannuzzi MC, Kerem B, et al. Identification of the cystic fibrosis
gene: chromosome walking and jumping. Science 1989;245:1059–1065.
Watson MS, Cutting GR, Desnick RJ, et al. Cystic fibrosis population carrier
screening: 2004 revision of American College of Medical Genetics mutation
panel. Genet Med 2004;6:387–391.
American College of Obstetricians and Gynecologists Committee on Genetics.
ACOG Committee Opinion No. 486: Update on carrier screening for cystic
fibrosis. Obstet Gynecol 2011;117:1028–1031.
Genetics in medicine | Volume 18 | Number 2 | February 2016
Original Research Article
4. Castellani C, Macek M Jr, Cassiman JJ, et al. Benchmarks for cystic
fibrosis carrier screening: a European consensus document. J Cyst Fibros
2010;9:165–178.
5. Strom CM, Crossley B, Buller-Buerkle A, et al. Cystic fibrosis testing 8 years on:
lessons learned from carrier screening and sequencing analysis. Genet Med
2011;13:166–172.
6. Zlotogora J. Population programs for the detection of couples at risk for severe
monogenic genetic diseases. Hum Genet 2009;126:247–253.
7. Massie J, Petrou V, Forbes R, et al. Population-based carrier screening for cystic
fibrosis in Victoria: the first three years experience. Aust N Z J Obstet Gynaecol
2009;49:484–489.
8. Castellani C, Picci L, Tamanini A, Girardi P, Rizzotti P, Assael BM. Association
between carrier screening and incidence of cystic fibrosis. JAMA
2009;302:2573–2579.
9. Cunningham S, Marshall T. Influence of five years of antenatal screening on
the paediatric cystic fibrosis population in one region. Arch Dis Child 1998;78:
345–348.
10. Witt DWC, Goonewardena P, Louie E, Rosenfeld S. Cystic fibrosis prenatal
screening of 103,600 individuals in an HMO: molecular/clinical outcomes and
a dramatic reduction in CF incidence (abstract). American Society of Human
Genetics (Proceedings of Annual Meeting), Philadelphia, 2008.
11. Sims EJ, Mugford M, Clark A, et al.; UK Cystic Fibrosis Database Steering
Committee. Economic implications of newborn screening for cystic fibrosis: a
cost of illness retrospective cohort study. Lancet 2007;369:1187–1195.
12. Lai HJ, Cheng Y, Farrell PM. The survival advantage of patients with cystic fibrosis
diagnosed through neonatal screening: evidence from the United States Cystic
Fibrosis Foundation registry data. J Pediatr 2005;147(3 suppl):S57–S63.
13. Farrell PM, Kosorok MR, Laxova A, et al. Nutritional benefits of neonatal
screening for cystic fibrosis. Wisconsin Cystic Fibrosis Neonatal Screening Study
Group. N Engl J Med 1997;337:963–969.
14. Southern KW, Munck A, Pollitt R, et al.; ECFS CF Neonatal Screening Working
Group. A survey of newborn screening for cystic fibrosis in Europe. J Cyst Fibros
2007;6:57–65.
15. Castellani C, Southern KW, Brownlee K, et al. European best practice guidelines
for cystic fibrosis neonatal screening. J Cyst Fibros 2009;8:153–173.
16. Kerem E, Conway S, Elborn S, Heijerman H; Consensus Committee. Standards
of care for patients with cystic fibrosis: a European consensus. J Cyst Fibros
2005;4:7–26.
17. Smyth AR, Bell SC, Bojcin S, et al. European cystic fibrosis society standards
of care: best practice guidelines. J Cyst Fibros. 2014 May;13 Suppl 1:S23–42.
http://www. dx.doi.org/10.1016/j.jcf.2014.03.010.
18. Cystic Fibrosis Foundation. Borowitz D, Parad RB, Sharp JK, et al. Cystic
Fibrosis Foundation practice guidelines for the management of infants with
cystic fibrosis transmembrane conductance regulator-related metabolic
syndrome during the first two years of life and beyond. J Pediatr 2009;155(6
suppl):S106–16.
19. Mayell SJ, Munck A, Craig JV, et al.; European Cystic Fibrosis Society Neonatal
Screening Working Group. A European consensus for the evaluation and
management of infants with an equivocal diagnosis following newborn
screening for cystic fibrosis. J Cyst Fibros 2009;8:71–78.
20. Castellani C, Massie J. Newborn screening and carrier screening for cystic
fibrosis: alternative or complementary? Eur Respir J 2014;43:20–23.
21. Sosnay PR, Siklosi KR, Van Goor F, et al. Defining the disease liability of variants
in the cystic fibrosis transmembrane conductance regulator gene. Nat Genet
2013;45:1160–1167.
22. Efron B, Tibshirani R. Boostrap methods for standard errors, confidence
intervals, and other measures of statistical accuracy. Stat Sci 1986;1:54–77.
23. Sontag MK, Wagener JS, Accurso F, Sagel SD. Consistent incidence of cystic
fibrosis in a long-term newborn screen population. Ped Pulmonol 2008;(suppl
31): 272.
24. Scotet V, Duguépéroux I, Saliou P, et al. Evidence for decline in the incidence of
cystic fibrosis: a 35-year observational study in Brittany, France. Orphanet J Rare
Dis 2012;7:14.
25. Scotet V, Assael BM, Duguépéroux I, et al. Time trends in birth incidence of
cystic fibrosis in two European areas: data from newborn screening programs.
J Pediatr 2008;152:25–32.
26. Sims EJ, McCormick J, Mehta G, Mehta A; UK CF Database Steering Committee.
Newborn screening for cystic fibrosis is associated with reduced treatment
intensity. J Pediatr 2005;147:306–311.
27. Bombieri C, Claustres M, De Boeck K, et al. Recommendations for
the classification of diseases as CFTR-related disorders. J Cyst Fibros
2011;10(suppl 2):S86–102.
151
© Copyright 2026 Paperzz