Politecnico di Torino
Porto Institutional Repository
[Article] Reconstruction and Analysis of the Po River Inundation of 1951
Original Citation:
Masoero A.; Claps P.; Asselman N.; Mosselman E.; Di Baldassarre G. (2013). Reconstruction and
Analysis of the Po River Inundation of 1951. In: HYDROLOGICAL PROCESSES, vol. 27 n. 9, pp.
1341-1348. - ISSN 0885-6087
Availability:
This version is available at : http://porto.polito.it/2506011/ since: January 2013
Publisher:
Wiley
Published version:
DOI:10.1002/hyp.9558
Terms of use:
This article is made available under terms and conditions applicable to Open Access Policy Article
("Public - All rights reserved") , as described at http://porto.polito.it/terms_and_conditions.
html
Porto, the institutional repository of the Politecnico di Torino, is provided by the University Library
and the IT-Services. The aim is to enable open access to all the world. Please share with us how
this access benefits you. Your story matters.
(Article begins on next page)
Reconstruction and analysis of the Po River inundation of 1951
Alessandro Masoero,1* Pierluigi Claps,1 Nathalie E. M. Asselman,2 Erik Mosselman3,4 and
Giuliano Di Baldassarre5
1
5
Politecnico di Torino, Dipartimento di Ingegneria dell’Ambiente, del Territorio e delle Infrastrutture, Torino, Italy
2
Deltares, Scenarios and Policy analysis, Delft, Netherlands
3
Deltares, Inland Water Systems Unit, P.O. Box 177, Delft 2600 MH, Netherlands
4
Delft University of Technology, Faculty of Civil Engineering and Geosciences, Delft, Netherlands
UNESCO-IHE Institute for Water Education, Hydroinformatics and Knowledge Management, Westvest 7 PO Box 3015, Delft 2601 DA, Netherlands
Abstract:
Flood inundation models have become essential tools in flood risk management, being used also in the analysis of historical flood
events, which is often needed for a reliable assessment of the potential flood hazard. This study aims at reconstructing the 1951
inundation of the Polesine Region, Italy. The 1951 flooding was a mayor natural catastrophe that caused a large inundated area
(1080 km2) and produced devastating social consequences. The reconstruction of the 1951 hydraulic conditions is based on
partial knowledge of discharges and water stages at the Pontelagoscuro gauging station (downstream of the 1951 levee breach) using
extrapolation of the rating curves beyond the measurement range. This is, even today, something open to uncertainty. We applied a
decoupled hybrid approach to the hydraulic modeling: a 1D model is used to simulate the flow into the river and to compute the flow
through the levee breach; this result is then adopted as the inflow condition for a 2D model application on the inundated area. A good
agreement between the patterns of the observed and reconstructed inundation areas was found, and the timing of the inundation was
also found to be close to the information derived from the historical chronicles. The results of the flood inundation modelling exercise
provide two practical insight: (i) obstacles in the floodplains increased the flooded area by 40% and prolonged the time to reach the sea
from 5 to 15 days, (ii) the peak discharge of the event was overestimated by up to 20%
INTRODUCTION
The increased socio-economic relevance of flood risk
assessment has led to the development of innovative
methodologies for the hydraulic simulation of river and
floodplain systems, and has promoted the development of
new techniques for flood hazard and inundation mapping
(e.g. Di Baldassarre et al., 2010; Vorogushyn et al., 2010).
In particular, one-dimensional (1D) and two-dimensional
(2D) hydraulic models have been used more and more as
numerical tools (e.g. Aronica et al., 2002; Hesselink et al.,
2003; Pappenberger et al., 2005; Horritt et al., 2007) as
these models have proven to be able to effectively simulate
river hydraulics and floodplain inundation at different levels
of detail (e.g. Horritt and Bates, 2001, 2002). Flood
inundation models appear also to be useful tools for the
reconstruction and analysis of historical events (e.g. Di
Baldassarre et al., 2009b; Horritt et al., 2010), which can be
very important to provide a comprehensive assessment of
exposure to floods and to develop flood risk management
plans as required by the recent Floods Directive 2007/60/EC
(European Commission, 2007).
In this context, this paper describes the analysis and
reconstruction of the 1951 inundation of the Polesine
Region, Italy. The 1951 event was a natural catastrophe
and had major hydrological relevance, as during that
event, the historical maxima of discharge and water stage
were observed in the downstream part of the Po River,
even though a breach occurred while levels were rising.
The 1951 peak discharge is therefore a crucial value for
flood assessment in the lower Po region, because many
studies on flood risk management in the Po River have
been based on the estimated peak discharge of the 1951
event. The height of the levee system of the Po River, for
instance, is almost everywhere established on a design
flood wave (SIMPO, 1982), based on discharges 10%
higher than the ones estimated for the 1951 event.
The objective of this research is twofold: (i) to show
the applicability of a new approach in reconstructing
historical inundation events by means of hydraulic
modelling and (ii) to reconstruct discharges and water
stages at the Pontelagoscuro’s gauging station (downstream of the 1951 levee breaches), reaching a correct
estimate of the maximum values, after validation by
means of the results of the outflow modelling.
The whole approach is compliant with the uncertainty
in the rating curves, which are known to affect flood
discharge data (e.g. Pappenberger et al., 2005; Di
Baldassarre and Montanari, 2009; Di Baldassarre and
Claps, 2011). Flood discharges are usually not directly
measured, but derived from observed water stages by
means of a rating curve. This step entails a significant
uncertainty in the results, which becomes more relevant
when extrapolating the rating curve far beyond the range
of the calibration measurements. One of the possibilities
to validate rating curves in the range of large discharges is
to reconstruct a single significant value, as a historical
maximum, by means of accurate hydraulic modelling. In
that case, model accuracy depends on the reliability of
initial and boundary conditions. When historical inundation
events are considered, it is quite difficult to reconstruct initial
and boundary conditions. Therefore, a detailed analysis and
reconstruction of the observed inundation areas, volumes
and timing can help in reaching a reasonable validation of the
conditions assumed for the model and a reasonable estimate
of the peak discharges. These estimates can then be used to
verify the hypotheses made on the rating curves, as will be
shown later in this paper.
Therefore, the main contribution of this paper is to validate
the estimate of the flood peak discharge using the outflow
model to check the consistency in all aspects of the
inundation. The 2D modelling of the outflow dynamics
can provide detailed information about flood wave velocity,
inundated areas and volumes that can be used for subsequent
analysis or for validating the 1D model results in terms of the
outflow discharges. In this study, which reconstructs an
historic event of 60 years ago, we decided to verify and
validate the results using the recorded timing of the
inundation, which is one of the clearest sources of
information available. This estimate is less uncertain than
that obtainable by only extrapolating the rating curve beyond
the measurement range. The reconstruction of the historical
inundation event is tackled by means of the HEC-RAS and
SOBEK numerical models. Model results were validated
using data on water levels, the recorded timing of the peak,
the extension of the inundated area and the timing of the
inundation as obtained from chronicles and reports.
Boundary conditions for the 1D model were built using
recorded levels at two gauging stations, one located upstream
and another downstream the main levee breach. Hydraulic
conditions in these sections will be extensively discussed in
the following.
STUDY AREA AND AVAILABLE DATA
The Po River is the longest river in Northern Italy, with
about 650 km length, starting in the Western Alps and
draining into the Adriatic Sea, where it creates a large delta
formed by hundreds of minor channels. With an area of
71 000 km2, the drainage basin is also the largest in Italy. It is
characterized by a peculiar hydrographic and topographic
configuration, due to the presence of both Alpine and
Apenninic rivers, that leads to a complex response to
precipitation events, especially in terms of timing of flood
peaks coming from the Apenninic and Alpine tributaries.
The hydraulic modelling analysis was performed on a
90-km reach of the lower part of the River Po (Figure 1),
between the gauging stations of Ostiglia and Papozze.
The investigated reach excludes the branches that are part
of the Po Delta, as they are located downstream of the
Papozze gauging station. Levee breaches that caused the
catastrophic flood on the night of November 14th 1951,
near the village of Pontelagoscuro, were in the considered
reach. Within the studied reach, the riverbed is basically
canalized between two lateral banks, with an overall width
of about 1 km that is reduced to 400 m at a few locations,
such as near the sections of Revere and Pontelagoscuro.
The area affected by the inundation, i.e. the Polesine
region, consists of the plain between the lower portion of
the rivers Adige and Po, up to the Adriatic Sea that
defines the East border of this region. The Polesine region
is marked by the darker grey color in Figure 1.
Morphologically, the Polesine region is a wide lowland
area, with large areas below sea level. A network of
embanked rivers and channels crosses the region, defining
a number of sub-areas that are isolated from each other.
Figure 1. Test site: the lower portion of Po River and The Polesine Region; location of Ostiglia (Δ) and Papozze (▲) gauging stations, upstream and
downstream limits of the 1D model
Application of the 2D model will demonstrate how
separation of sub-areas, due to man-made obstacles such
as roads and embankments, significantly affected the
flooding dynamics.
Available data
The relevant data were collected with the help of
the Interregional Agency for the Po River (Agenzia
Interregionale per il Fiume Po, AIPO, Italy). The data
consisted of time series of river discharges and water levels,
river bed geometry, the morphology of the flooded areas and
the timing of inundation. Being related to an event of
60 years ago, data collection required patience and care.
Recorded water stages at Ostiglia and Pontelagoscuro’s
gauging stations are reported in the 1951 Hydrological
Yearbook (Servizio Idrografico e Mareografico Nazionale,
1956). These values are considered reliable, except for the
peak value at the section of Pontelagoscuro as it is located
downstream the main levee breach. Different references give
different values of the peak water level at Pontelagoscuro
(see Table I).
Table I. 1951 peak water level at Pontelagoscuro
Water level at
Pontelagoscuro m ASL
Reference
1951 Hydrological Yearbook – Section F
Civil Engineering Office of Rovigo
Ufficio Idrografico Magistrato del Po
Caratteristiche idrometriche del tratto
inferiore del Po, M. Rossetti (1960)
12.79
13.70
12.49
13.58
The primary levee, where the upstream breaches
occurred, had a crest elevation of 13.35 m asl in 1951.
As the failure was due to overtopping, the water level had
to be higher than the levee crest. For this reason, we
consider valid the peak water level of 13.58 m asl given
by Rossetti (1960) and used by Mainardi (1991).
The opening of the three breaches on the primary levee
is well documented in the chronicles (6.30 PM of
14th November at Paviole and around 8.30 PM at
Bosco-Malcantone). As until the 30th November, it was
impossible, due to the impressive outflow, to carry out the
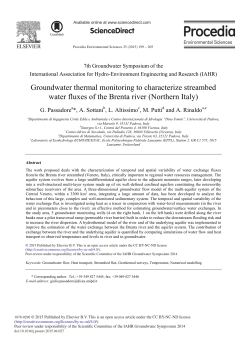
bathymetric survey, no information about breach development was found. The only available data (Figure 2) is the
final breach geometry, as reported by Sbrana (1952). We
assumed the breach to open instantaneously. This assumption does not have a significant effect on the results of the
inundation model, because of the long duration of the flood that
lasted more than 16 days (e.g. Di Baldassarre et al., 2009a).
We defined the bottom of the breaches at the
same elevation as the ground level behind the levee
(around 7 m asl). Therefore, the scour hole was not taken
into consideration.
The propagation of the flood is well described in the
studies by Mainardi (1991) and Govi and Turitto (2000).
The inundation started on the 14th of November 1951 at
6.30 PM, when the first breach occurred. The maximum
flood extent occurred two weeks later, the 27th of
November, when the flood water reached the sea. The
total inundated area was around 1080 km2, and depths up
to 6 m were observed in the area near the city of Adria. Of
relevant importance is the timing and the sequence of
inundation in the sub-areas defined by the minor-channel
Figure 2. Final geometry for Bosco and Malcantone breaches, as reported by Sbrana (1952)
dikes: Rovigo was flooded after 50 h (distance of 24 km)
and Adria (40 km) was flooded after 60 h.
INUNDATION MODELLING
A hybrid decoupled methodology, based on the
combination of 1D and 2D approaches, was used to perform
the numerical simulations. In this application, as the Po
levees are about 10 m higher than the flooded area, the
assumption of no hydraulic interaction between the two
currents can be considered reasonable. This combined type
of modelling was already demonstrated as valid by Aureli
et al. (2006) for a similar reach of the River Po. Compared to
a fully 2D model the 1D–2D approach has the advantage
of a consistent reduction in the computation time.
In the present study, a freeware 1D model (HEC-RAS;
Hydrologic Engineering Center, 2001) was used to simulate
the flow in the river and to compute the flow through the
levee breach. The simulated flow through the breach was
then adopted as the inflow condition for the 2D model of
the inundated area (SOBEK; Delft Hydraulics, 2000). The
advantages of using a fully fledged code like SOBEK for
the 2D part is that this software can suitably simulate the
flood propagation on a plain characterized by minor
channels, embankments and dikes, elements that made the
inundation sequence particularly complex.
Figure 3. Rating Curves at Revere-Ostiglia (a) and Pontelagoscuro (b). The
stage-discharge values measured in 1954 (grey triangles) are compared with the
reconstructed rating curve obtained using Manning’s coefficient n = 0.03 s/m1/3
(black dotted line). The figure also takes into account a 7% uncertainty range
(grey dashed line) as given by Di Baldassarre and Montanari (2009)
1D modelling. The geometry of the 93-km reach of the
River Po, from Ostiglia (Mantova province) to Papozze
(Rovigo province), was described by using 21 cross
sections surveyed in 1954 by the Magistrato del Po. The
automatic routine of the HEC-RAS geometric data editor
was used to interpolate between these cross sections. The
stage-discharge relations used as boundary conditions for
the 1D HEC-RAS model were the historical (1954) rating
curves at Revere and Pontelagoscuro (measurement range
up to 4000 m3/s). The roughness coefficient was used as a
calibration parameter. The model calibration was
performed in a steady-state mode, comparing results for
different Manning coefficients with the historical records
of discharges and water levels. Considering also the
uncertainty associated to direct measurements, we were able
to define a confidence interval for the results in a range of
Manning coefficients, n, from 0.029 to 0.031 s/m1/3. Results
for the best fitting parameter (n = 0.030 s/m1/3) are shown
in Figure 3.
After the calibration of the 1D model, the November
1951 flood hydrograph was simulated. As flow boundary
condition, the hydrograph at the upstream end of the
reach (Ostiglia) was used. The hydrograph was derived
from the water stages available at the Ostiglia gauging
station, reported in the 1951 Hydrological Yearbook.
Given that the backwater length for this reach is between
14 and 20 km (Castellarin et al., 2009), the water levels at
Ostiglia were not significantly affected by the breaches
that occurred 40 km downstream. A constant slope along
the river was assumed to estimate the water level at the
downstream boundary at Papozze. The three known levee
breaches (located at Bosco, Malcantone and Paviole)
were defined within HEC-RAS by modelling the left bank
as a lateral structure and then imposing the failure, by
lowering of the structure at a fixed time. As there were
some uncertainties about the historical observation of the
growth rate and the ultimate depth of the breaches, their
geometry and dynamics were imposed using the following assumptions: (i) the formation of scour holes, caused
by the impressive outflow, was not taken into consider-
Figure 4. Model evaluation: observed and simulated stage hydrograph in the
middle of the reach (Pontelagoscuro) during the 1951 event. The visible
difference between simulated and observed levels, just before the flow peak, is
due to the non-uniform storage characteristic of the Po-system as described in
Jansen et al. (1979)
ation for modelling the depth of the breach; (ii) the breach
was assumed to occur instantaneously, an assumption that
does not affect the results of the model because the duration
of the Po flood is long in comparison to the duration of
breach growth (Di Baldassarre et al., 2009a).
The model results have been validated by comparing
the simulated water levels with the observed hydrograph
(Figure 4) at Pontelagoscuro, as reported in the 1951
Hydrological Yearbook. This station is located between
the two breaches and in a central position along the
considered reach. From Figure 4, one can recognize that
in the first part of the hydrograph, just before the peak
flow, there is a clear difference between the simulated and
observed levels. This is a peculiarity of the non-uniform
storage characteristics of the Po system (Jansen et al., 1979).
Along the Po River, floodplains are protected from minor
events by a secondary levee system located near the
channel banks. When the flood discharge overtops
these levees, the peak of the flood wave is cut due to the
storage effect of closed (inactive) floodplains beyond the
secondary levees. In the case of a major event, such as that
of 1951, the Po system may fail: once the floodplain is
filled up, the water level in the river rises rapidly, as
additional storage of water is impossible. The 1D model
can account for the temporary storage in inactive floodplains. However, in the present study, this detailed
simulation has not been attempted, both for the insufficient
data and because the levee failure occurred much later, when
no storage effects occurred. Figure 4 shows that the peak
value was reached after the end of the non-uniform storage
and is well reconstructed by the model.
2D Modelling. To simulate the flow in the flooded area,
a 2D model (SOBEK) was used. The simulated flow
through the breaches was used as boundary condition.
The topographic data of the inundated area consisted of a
90-m resolution digital elevation model derived by the
NASA SRTM project (Farr et al., 2007). The SRTM data
have an original spatial resolution of 90 m, that we
averaged to a coarser resolution of 190 m to reduce the
random vertical noise and to remove small imperfections
in the DEM. For flat regions, like the Polesine plain, the
magnitude of the random vertical error can be lower than
2 m (Rodriguez et al., 2006). It is important to remark that
this geometry represents the terrain configuration in
February 2000, the time of the Shuttle Endeavour
Mission, and not the original 1951 topography. At the
time of the event under study, there were differences due
to the morphological characteristics of the Polesine
Region (a lowland plain, part of an extending delta). To
deal with this level of uncertainty, objects such as road
embankments, channels and levees that were present in
1951 and that significantly affected the flood dynamics
were included in the model. Given the role played in the
inundation dynamics, a particular attention was dedicated
to recovering and reconstructing the historical configuration
of these man-made obstacles. Since no backwater effects
were involved, 1D and 2D models are decoupled. Therefore,
the topographical model needs to be consistent only with the
relative ground elevations, and so accuracy in absolute
elevations is not an issue in this case. Given the extension
and the topography of the study area, a flat plain with
extremely low differences in elevation, and that we averaged
our grid to a coarser resolution, we can assume that vertical
random errors do not affect significantly our results.
The 2D model results were verified by comparing the
observed flood extent map of the November 1951 event
(reported in the specific annex, Section F, of the 1951
Hydrological Yearbook) with the simulated maximum
inundation extent (Figure 5). To evaluate the match
between the observed and simulated areas, a measure of
fit, defined by Horritt et al. (2007), was used:
Figure 5. Simulated and observed inundation areas; A, B and C zones are represented to have a measure of fit as given by Horritt et al. (2007). The figure
also shows the location of the 1951 levee breaches that occurred in Paviole (1) and Bosco-Malcantone (2)
Figure 6. Sub-areas (from 1 to 5) that defined the steps of the inundation. The main hydraulic obstacles, Fossa di Polesella (A) and Canale di Valle (B)
are reported. The results of a simulation in an obstacle-free scenario is also shown in this figure (black dashed area)
F¼
A
100
AþBþC
(1)
where A is the area correctly predicted as wet by the
model, B is the area predicted as wet but observed as dry
(over-prediction) and C is the wet area not predicted by
the model (under-prediction).The measure of fit F was
found to be about 87%. Considering that several data
were retrieved just from the chronicles (Lugaresi, 2001),
this appears to be an encouraging outcome.
The timing of inundation has also been investigated
and used to validate the model results, by reconstructing
the inundation sequence in the sub-areas defined by the
river and by minor-channel embankments (Figure 6). The
numbering of sub-areas defines the steps of the inundation
sequence. Only for sub-areas 2 and 3 there are some
differences between observed data and model results: in
the chronicles, the inundation is reported to occur at the
same time in these sub-areas, but the model simulates a
delay in the inundation of the eastern part of sub-area 2. It
is interesting to notice that the presence of obstacles in the
flood plain forced the flow into defined routes, hampering
the flow towards the sea and causing the inundation of
areas located upstream of the breaches (the western part
of sub-area 1 in Figure 6) and outside the natural drainage
path (the western part of sub-area 4 in Figure 6). In detail,
two main obstacles transverse to the natural flow direction
(Fossa di Polesella and Canale di Valle) had deeply
affected the inundation dynamics and timing, while the
minor channel levees (Adigetto and Canal Bianco) played
an important role in constraining the flow in defined
routes and dividing the plain in separated polders.
Results from the 2D model application give an indication
of the correct estimate of the total volume through the levee
breaches, which amounts to around 37 million m3.
To better understand how and how much hydraulic
obstacles affected the dynamics of the flood wave
propagation over the plain, a simulation in an obstaclefree scenario was run. The results given by this scenario
(dashed area in Figure 6) show that the inundated area
would have been 30% smaller than the observed one and
the time to reach the sea would have reduced to 5 days,
instead of 15. These results, which underline the impact
of artificial obstacles on flood propagation, are of interest
as they concern also the present-day flood management
plans for the region under study.
Table II. Results of the reconstruction of the 1951 inundation
1951 event
Cross section
Revere-Ostiglia
Pontelagoscuro
Past study (SIMPO ’82)
This study
Progressive
distance
from Tanaro
km
Discharge
m3/s
Water level
m ASL
Discharge
m3/s
Water level
m ASL
510
565
11 260
11 580
19.76
14.20
9500–10 100
9100–9650
19.48–19.49
14.19–14.22
Figure 7. Trend of maximum discharge along the Po River. Reconstruction of 1951 discharge made by PAST studies (light-grey dotted line) and
THIS study (black solid line) are compared with the 2000 event discharges
(dark-grey dotted line). The light-grey area around the estimated values
represents the uncertainty
DISCUSSION: CRITICAL ISSUE CONCERNING THE
1951 PEAK DISCHARGE ESTIMATE
Based on the results of the flood inundation modelling,
some considerations about the relation between water
stages and discharges can be drawn. Table II shows the
discharge values reconstructed previously in a no-breach
scenario using another model of the Po River (AdBPO,
Po River Basin Authority) and the ones obtained in the
present study. To highlight the uncertainty in the results,
we decided to provide a range of discharge values, on the
basis of the confidence interval. This interval is defined,
as stated before in the paper, by the uncertainty in the 1D
model roughness coefficient.
Even considering the uncertainty, one can recognize that
the maximum discharge in the lower portion of the Po River
obtained in this study is significantly lower (about 20% less)
than the one estimated in the past, i.e. the value that was used
to create the SIMPO design flood hydrograph (SIMPO,
1982). It is worth remarking again that the 1951 peak
discharge value has been crucial in defining flood risk
management actions and measures on the Po River, such as
the levee height, that is almost everywhere based on the
SIMPO design flood profile.
To further validate the present study results, the peak
estimates were compared with those obtained in an event of
comparable magnitude on the Po River in October 2000
when, of course, no levee breaches occurred. By considering
the 1951 peak discharges (Figure 7) and those of the
2000 flood event, reconstructed from the surveyed water
stages, a significant anomaly appears in the lower portion
of the Po River. In the upstream sections of Boretto and
Borgoforte, the maximum recorded discharge of the 2000
event was very close to the maximum discharge observed
during the 1951 flood. In contrast, at the downstream cross
section of Pontelagoscuro, the recorded peak discharge of
the 2000 flood event was much less than the previously
estimated 1951 peak as reported in SIMPO (1982).
However, the peak discharge value reconstructed in this
study for the 1951 flood seems more consistent with the
observed discharge of the 2000 flood. Therefore, this study
seems to accurately reproduce the attenuation of the peak
discharge between Borgoforte and Pontelagoscuro, which
was actually observed during the 2000 flood when no
levee breach occurred. The 1951 peak discharge value
calculated at Ostiglia by the present study confirms the
observation during the 2000 event of a significant
attenuation between Borgoforte and Sermide, located
18 km downstream Ostiglia (see Figure 7), where gauging
station were active in 2000.
The above-mentioned discrepancy on the estimated 1951
peak can be explained assuming that previous analyses may
have overestimated the peak discharge of the 1951 event by
underestimating the volume of water that flowed from the
river into the closed floodplains beyond the secondary
levees between Borgoforte and Pontelagoscuro. Therefore,
accurate computation of the outflow volumes, requiring
careful definition of the spatial domain and validation both
in the extension and in the timing of the inundation, is
crucial for the 1951 peak estimate and fully motivates the
efforts of applying 2D rather than 1D modelling.
CONCLUSIONS
Historical events can be important for defining flood risk
management plans in a region; nevertheless, their
dynamics are affected by considerable uncertainty as it
is often difficult to define the past hydraulic conditions.
This work describes the hydraulic conditions that
occurred in a historical inundation event, with the aim
of reconstructing peak discharge values by accurate
estimation of the volume of water that overflowed the
adjacent polders. To this end, we simulated the discharge
hydrograph that flowed through the Po River levee
breaches, in 1951, which caused the catastrophic inundation
of Polesine Region in Italy. To obtain a reliable reconstruction of the event, this study used flood extent maps for the
comparison of observed and simulated inundation areas.
Also, the inundation timing was used to validate the results,
as it is one of the clearest sources of information available
for the 1951 event. To comply with various hydraulic
boundary conditions, we used a combined 1D-2D numerical
modelling approach, with the objective of reconstructing
and verifying discharges estimated downstream the main
breaches, at Pontelagoscuro, during the 1951 inundation.
This estimate is particularly valuable as during this event,
the maximum values of discharges and water stages were
recorded in the lower portion of the Po River.
The estimation of flood peak discharges is crucially
related to the reliability of stage-discharge relationships in
the highest part of the curve. In this study, the
independent reconstruction of discharges that occurred
in a given event led to the validation of the highest point
in the rating curves. The present work treated as hard
data the direct measurements of water level and river
discharge that were used to calibrate the hydraulic model
in view of their associated uncertainty (negligible for
water level measurements, and 7% accuracy for direct
discharge measurements; e.g. Pappenberger et al., 2005;
Di Baldassarre and Montanari, 2009). In contrast, the river
discharge values used were not derived from the rating
curve (as it is typically done in standard approaches) but,
instead, were derived by the hydraulic model. This original
approach provides an estimate of the flood discharge which
is less uncertain than the one obtained by only extrapolating
the rating curve beyond the measurement range.
The results of the present study also lead to two practical
conclusions: (i) the 1951 peak discharge has been so far
overestimated by up to 20%, and this is confirmed by
hydraulic evidence that emerged in a subsequent major
event in October 2000, (ii) man-made obstacles in the
Polesine floodplain increased the flooded area by 40% and
tripled the time to reach the sea. The last observation gives a
useful advice for developing better flood management plans
in wide lowlands, where artificial embankments can
significantly affect flow directions.
ACKNOWLEDGEMENTS
The authors are extremely grateful to the Interregional
Agency for the Po River (Agenzia Interregionale per il Fiume
Po, AIPO, Italy) and to Marco Baldin for providing the
topographical, hydrological and historical data used in
the study.
REFERENCES
Aronica GT, Bates PD, Horritt MS. 2002. Assessing the uncertainty in
distributed model predictions using observed binary pattern information
within GLUE. HydrologicalProcesses 16(10): 2001–2016. DOI:
10.1002/hyp.398
Aureli F, Mignosa P, Ziveri C, Maranzoni A. 2006. Fully-2D modelling of
flooding scenarios due to embankment failure. In River Flow 2006.
Taylor & Francis Group: London; 1473–1482.
Castellarin A, Di Baldassarre G, Bates PD, Brath A. 2009. Optimal crosssection spacing in Preissmann scheme 1D hydrodynamic models.
Journal of Hydraulic Engineering 135(2): 96–105. DOI: 10.1061/
(ASCE)0733-9429(2009)135:2(96).
Delft Hydraulics. 2000. Sobek flow module technical reference guide
version 2.2. Delft Hydraulics: Delft, The Netherlands.
Di Baldassarre G, Claps P. 2011. A hydraulic study on the applicability of
flood rating curves. Hydrology Research 42(1): 10–19. DOI: 10.2166/
nh.2010.098
Di Baldassarre G, Montanari A. 2009. Uncertainty in river discharge
observations: a quantitative analysis. Hydrology and Earth System
Sciences 13: 913–921. DOI: 10.5194/hess-13-913-2009
Di Baldassarre G, Castellarin A, Montanari A, Brath A. 2009a.
Probability-weighted hazard maps for comparing different flood risk
management strategies: a case study. Natural Hazards 50(3): 479–496.
DOI: 10.1007/s11069-009-9355-6
Di Baldassarre G, Castellarin A, Brath A. 2009b. Analysis on the effects
of levee heightening on flood propagation: some thoughts on the River
Po. Hydrological Sciences Journal 54(6): 1007–1017.
Di Baldassarre G, Schumann G, Bates P, Freer J, Beven K. 2010.
Floodplain mapping: a critical discussion on deterministic and
probabilistic approaches. Hydrological Sciences Journal 55(3): 364–376.
DOI: 10.1080/02626661003683389
European Commission. 2007. Directive 2007⁄60⁄EC of the European
Parliament and of the Council of 23 October 2007 on the assessment
and management of flood risks. In Official Journal 6 November 2007 L
288⁄27. European Commission: Brussels.
Farr TG, Caro E, Crippen R, Duren R, Hensley S, Kobrick M, Paller M,
Rodriguez E, Rosen P, Roth L, Seal D, Shaffer S, Shimada J, Umland J,
Werner M, Oskin M, Burbank D, Alsdorf D. 2007. The Shuttle Radar
Topography Mission. Reviews of Geophysics 45. DOI: 10.1029/
2005RG000183; data repository: http://www2.jpl.nasa.gov/srtm/
Govi M, Turitto O. 2000. Casistica storica sui processi d’interazione delle
correnti di piena del Po con arginature e con elementi morfotopografici
del territorio adiacente. In Scienza e vita nel momento attuale. Istituto
Lombardo di Scienze e Lettere V: Milano; 105–160.
Hesselink AW, Stelling GS, Kwadijk JCJ, Middelkoop H. 2003.
Inundation of a Dutch river polder, sensitivity analysis of a physically
based inundation model using historic data. Water Resources Research
39(9): 1234–1250. DOI: 10.1029/2002WR001334
Horritt MS, Bates PD. 2001. Predicting floodplain inundation: raster-based
modelling versus the finite-element approach. Hydrological Processes
15(5): 825–842. DOI: 10.1002/hyp.188
Horritt MS, Bates PD. 2002. Evaluation of 1D and 2D numerical models
for predicting river flood inundation. Journal of Hydrology 268(1-4):
87–99. DOI: 10.1016/S0022-1694(02)00121-X
Horritt MS, Di Baldassarre G, Bates PD, Brath A. 2007. Comparing the
performance of 2-D finite element and finite volume models of
floodplain inundation using airborne SAR imagery. Hydrological
Processes 21: 2745–2759. DOI: 10.1002/hyp.6486
Horritt MS, Bates PD, Fewtrell TJ, Mason DC, Wilson MD. 2010.
Modelling the hydraulics of the Carlisle 2005 flood event. Proceedings of the Institution of Civil Engineers - Water Management 163(6):
273–281.
Hydrologic Engineering Center. 2001. Hydraulic reference manual. U.S.
Army Corps of Engineers: Davis, Calif.
Jansen PP, van Bendegom L, van den Berg J, d Vries M, Zanen A. 1979.
Principles of river engineering: The non-tidal alluvial river. Pitman:
London; 509.
Lugaresi L (ed). 2001. 1951 la rotta, il Po il Polesine. Associazione
Culturale Minelliana: Rovigo; 557.
Mainardi R. 1991. Novembre 1951. Cronologia dell’evento alluvionale. In
Atti del XVII Convegno di Studi Storici tenutosi a Rovigo il 22 – 23 – 24
novembre 1991 in occasione del quarantennale dell’alluvione,
Associazione Culturale Minelliana: Rovigo.
Pappenberger F, Beven K, Horritt MS, Blazkova S. 2005.Uncertainty in
the calibration of effective roughness parameters in HEC-RAS using
inundation and downstream level observations. Journal of Hydrology
302: 46–69. DOI: 10.1016/j.jhydrol.2004.06.036
Rodriguez E, Morris CS, Belz JE. 2006. A global assessment of the SRTM
performance. Photogrammetric Engineering and Remote Sensing
72: 249–260.
Rossetti M. 1960. Le caratteristiche idrometriche del tratto inferiore del
Po. Ministero dei Lavori Pubblici, Magistrato per il Po Venezia &
Magistrato per il Po Parma: Rovigo; 32.
Sbrana M. 1952. Deflusso e prosciugamento. Istituto Padano di Arti
Grafiche: Rovigo; 43.
Servizio Idrografico e Mareografico Nazionale. 1956. Annali Idrologici
anno 1951. Istituto Poligrafico dello Stato: Roma.
SIMPO. 1982. Studio e progettazione di massima delle sistemazioni
idrauliche dell’asta principale del Po, dalle sorgenti alla foce,
finalizzata alla difesa ed alla conservazione del suolo e nella
utilizzazione delle risorse idriche. Magistrato del Po: Parma.
Vorogushyn S, Merz B, Lindenschmidt KE, Apel H. 2010. A
new methodology for flood hazard assessment considering dike
breaches. Water Resources Research 46(8): 1–17. DOI: 10.1029/
2009WR008475
© Copyright 2026 Paperzz