Equal-Distance Sampling of
Superellipse Models
Maurizio Pilu
Robert B. Fisher
Department of Articial Intelligence
The University of Edinburgh
5 Forrest Hill, Edinburgh EH1 2QL
SCOTLAND
Abstract
Superellipses are parametric models that can be used for representing two dimensional object parts or aspects of 3-D parts. Previously
little care was given to obtaining a precise sampling of the contour of
these models. Equal-distance sampling of superellipse model contours
is however important for rendering and in cases in which a cost function
needs to be estimated for data tting or parameter estimation, such as
in model-based optimisation. In this paper we present a new parametric method for achieving equal-distance sampling of superellipse model
contours that properly combines two simple rst order models of the
sampled points distance function. We also show how to extend the
method to deformable superellipses and superquadrics.
1 Introduction
Superellipses and their 3-D extension superquadrics were invented by Hein
[3] and brought to the computer graphics and vision community mainly by Barr
[1] and Pentland [4]. They can represent many closed 2-D and 3-D shapes (e.g.
[6, 5, 7, 4] ) in a straightforward and natural way by using few parameters and
moreover simple deformation can be applied to extend their modelling capabilities.
Pentland [5] and other leading vision researchers rst introduced superquadrics
as a model to coarsely represent parts of objects with a minimumdescription in the
Humann coding sense (i.e. number of bits). Indeed one of the main advantages
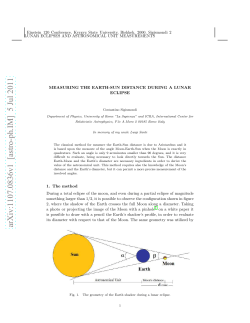
of superquadrics is their compactness of representation. As well as superquadrics,
superellipses can be used to model aspects of parts of 3-D objects, as shown in
Figure 1.
Superquadrics and superellipses, however, are mathematical objects of particularly awkward nature because they are the result of strong non-linearities caused
by fractional exponents, which cannot be analytically easily dealt with.
In many works that use superquadrics, it can be noticed that superquadrics
are not sampled in a regular way when rendering and computing cost or Error of
Fit (EOF) functions (such as in [8]),
British Machine Vision Conference
Figure 1: Two examples of modelling aspects of parts by deformable superellipses
In some applications, such as in Model-based Optimisation, we need to compute cost functions across superquadric surfaces or superellipse contours (either
deformed or undeformed) and the irregular sampling causes some regions to have
an higher weight on the nal cost, evidently producing wrong results with real
data.
Franklin and Barr [2] partially solved this problem by using an explicit nonparametric method. This greatly improved precision and speed but still has 2030% error in the sampling distance and could not deal with sampling deformed
superellipses. They were against parametric sampling because its complexity and
slowness.
This paper presents a solution to the problem of providing a reasonably fast
and reliable parametric method for obtaining a given constant sampling distance
along the whole contour of arbitrary superellipses and we will also show how to
extend the method to deformed models.
By using the spherical product [1] , the method can also be trivially extended
to superquadrics.
2 Superellipses and Deformations
A superellipse can be described by the 2-D vector:
cos()
x() = aa12sin
()
(1)
? where a1 and a2 are the two semiaxis and 0 1 is the roundness parameter.
By eliminating , its implicit equation can be easily obtained:
x
a1
2=
+
y
a2
2=
=1
(2)
British Machine Vision Conference
Either simple or complicated deformations can be applied to the basic superellipses shapes. The two most common deformations are linear tapering and circular
bending along the principal axis of the superellipse.
By simple geometric considerations (see, e.g., [8] for the details) and indicating
by capital letters the coordinates of the transformed shape, a tapering deformation
along the y-axis transforming a point [x y]T is dened as:
.
X = fx (y)x
Y =y
(3)
If fx (y) is linear the tapering will also be linear. By setting fx (y) = Ta2x y + 1,
with ?1 Tx 1, we have linear tapering ranging from increasing cross-section
(Tx > 0), decreasing cross-section (Tx < 0) and constant section (Tx = 0).
In the same way, a circular bending deformation along the y-axis is given by
where:
X = x + sign(c) (
Y = sin( ) r
p 2 2
y + r ? r)
(4)
R = a2 =c
r = R ? jxj
= atan(y=r)
and ?1 Tx 1 is the normalized bending parameter. A combination of deformations should be carried out by rst doing the deformations that are more shape
preserving (see e.g. [8]). In our case, with just two deformations used, the right
order is tapering rst and bending afterwards.
3 Linear Sampling and Explicit Method
In this section we show the result of sampling the model using plain linear increase
of the parameter and the explicit method proposed by Franklin and Barr in [2].
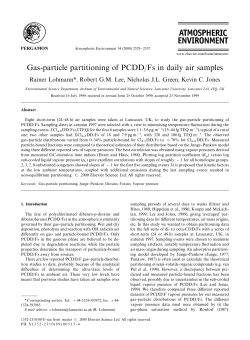
In Figure 2 (top) we see a linearly sampling superellipse parameter and a
graph expressing the distance of successive samples. It can be easily seen that this
method, though fast and simple, can only have very limited applications: points
are very evenly spaced and mostly gathered near the corners.
Figure 2 (bottom) shows instead the sampling proposed by Franklin and Barr
in which one of the coordinates is assigned and the other is computed by solving
equation 2 for the former. The outcome of this sampling is considerably better
than one with the previous method but, as it can be seen from the graph of the
distance, it still gives more than 30% error. (The spike is due to a mismatch
between the two halves of the quadrant at the junction.) Moreover, this method
rely on a straight approximation of the two sides of the superellipse quadrant and
therefore cannot deal with any kind of deformation, which would only worsen the
distance spread along the contour.
British Machine Vision Conference
Linear Method
Sampling Distance
6
30
Arc Length
5
Y
20
10
4
3
2
0
0
10
20
1
30
1
8
16
24
Sample
X
Explicit Method
31
Sampling Distance
1.4
30
Arc Length
1.2
Y
20
10
1
0.8
0.6
0
0
10
20
0.4
30
1
13
X
25
37
Sample
49
Figure 2: Example of Linear Sampling (top) and Explicit Method (bottom) with
respective sampling distances
4 Optimal Parametric Sampling
In order to avoid the high discrepancy of sampling distance on the superellipse
contour, we can employ a simple rst-order dierential model which will allow
sampling to be done according to local curvature properties.
4.1 First model
Consider the parametric equation of a superellipse (1). We can approximate the
arclength between two close points x() and x( + ()) by the segment linking
the two points:
D()2 = jx( + ()) ? x()j2
Assuming relatively small (), the right hand side of this equation can be approximated to rst order by:
D()2 =
@
(a1 cos() ) ()
@
2
+
@
(a2 sin() ) ()
@
2
British Machine Vision Conference
8
6
6
D Theta
D Theta
Delta Theta (second case)
−7
x 10
Delta Theta (first case)
−7
x 10
8
4
4
2
2
1
2
3
4
5
Theta
6
7
8
9
1
10
3
4
5
Theta
6
7
8
9
10
−7
x 10
Actual Sampling Distance for very small Thetas (second case)
2.5
0.33
0.32
Arc_Length
Arc_Length
2
−7
x 10
Actual Sampling Distance for very small Thetas (first case)
0.31
0.3
2
1.5
0.29
1
0.28
0.5
1
2
3
4
5
Theta
6
7
8
9
10
1
2
3
4
−7
x 10
5
Theta
6
7
8
9
10
−7
x 10
Figure 3: Actual distance for small By expanding and solving this equation for we obtain:
() = D()
s
cos()2 sin()2
2
2
a1 (cos() ) sin()4 + a22(sin() )2 cos()4
(5)
If we want to have an equal distance sampling for any we must set D()
to a constant K that represents the approximate arclength between two sampled
points; D() could also been adaptively changed for dierent kind of samplings or
to cope with deformations.
The two dual updating algorithms for should then be as simple as:
i = i?1 + (i )
i = i?1 ? (i )
0 = 0 ; i 2 f1::N g j N < =2
0 = =2 ; i 2 f1::N g j N > 0 ;
(6)
(7)
the former going up step by step from 0 to =2 and the latter from =2 down
to 0. Unfortunately the strong non-linearities of the superellipses cause this approximation to be wrong for close to 0 and =2, and even the sampling schemes
(6) and (7), apparently equivalent, have slightly dierent behaviour. In fact the
sampling distance increases as increases due to the rst order (linear) approximation we have used: in regions of increasing curvature the computed derivative
overestimates the rate of change in needed to obtain a certain arclength whereas
in regions of decreasing curvature the exact opposite happens. As a result the
real arclength is much lower that it should be in some regions and much higher
in others. Figure 3 highlights this eect for very small (in which the rate of
change in the curvature tends to innity) in the case of sampling scheme (6) (on
the left) and (7) (on the right). (It should be noticed that the second case (right)
is equivalent to sampling with scheme (6) used near =2.) In the rst case goes
to zero very quickly whereas in the second it tends to innity but once ? goes
below zero, its behaviour inverts and becomes similar to the one in the rst case.
British Machine Vision Conference
D_Theta for very small Thetas
−7
14
x 10
Comparison of Actual Sampling Distances
12
0.46
D Theta
10
8
0.45
6
4
New
0.44
2
2
3
4
5
Theta
6
7
8
9
0.43
10
−7
Arc Length
1
x 10
Sampling Distance
ArcLength for very small Thetas
0.42
Old
0.41
0.4574
0.4572
0.4
0.457
0.39
0.4568
1
2
3
4
5
Theta
6
7
8
9
0.38
0
10
−7
0.1
x 10
0.2
0.3
Theta
0.4
0.5
0.6
Figure 4: New approximation for small (left) and a comparison to the previous
method for larger (right)
4.2 Singularities
To avoid problems at the singularities, we found that the following simple model
yields a very good approximation to the equal-distance sampling near the singularities = 0 and = =2.
In the case with ! 0, equation (5) can be approximated as:
x() =
a1
a2 and hence the distance between two points in this case is therefore:
D() = y( + ()) ? y() = a2( + ()) ? a2
By solving for () we obtain:
() =
D() ? ? a2
1
(8)
Analogously, for ! =2 we have:
D
(
)
() = a ? (=2 ? ) ? (=2 ? )
1
1
(9)
with D() set to a constant K if we want equal-distance sampling.
Figure 4 shows how this new model behaves for very small s; again we have
= 0:1, a1 = 20, a2 = 20. A quick comparison with Figure 3 shows that the actual
distance with this new sampling model is practically constant with , which is what
we wanted to achieve. For larger values of , as expected, this approximation does
not hold any longer and some small errors are introduced. It should be noticed,
however, that here we have used a low value of roundness ( = 0:1) and this is why
the small- approximation holds even for relatively large values of . For rounder
British Machine Vision Conference
Result of Sampling for the 1st quadrant
25
θ=π/2
Sampling Directions
y
20
15
Y
x
10
a2
5
y
0
O
a1
x
θ=0
−5
−5
0
5
10
X
15
20
25
Figure 5: Swapping of axes (left) and nal sampling result
shape this approximation will hold for smaller and smaller values of but, at the
same time, the distance Equation (6) will become more and more suitable because
the non-linearities becomes less strong.
4.3 Combination of the Two Models
Let Model A be the model of Section 4.1 and Model B be the one of Section 4.2
which is to be used near the singularities = 0 and = =2.
We switch between the two models after and =2 ? go below a certain
threshold . Experimentally, we have found that a good value of is 10?2 , which
gives relatively smooth change in the actual sampling distance both for very small
and large .
When (9) is used, however, there is a problem caused by the subtraction (=2 ?
) since the numerical precision necessary to use (9) for small values of is very
high. We solved this problem by swapping the x and y axis in the superellipse
equation (1) in order to have the condition ! 0 in place of ! =2; a1 will
be then used instead of a2 in order to have exactly the same shape, as shown in
Figure 5 (left).
Figure 5 (right) shows the result of this sampling method ( = 0:1), where the
small circles indicates the swapping points between Model A and Model B; note
that in this example the position of these two circles represent a distance in the
parameter space of just = 10?2 radians!)
Figure 6 gives another full example in which , , the actual distance D()
and the sampled superellipse are given for = 0:2, a1 = 20, a2 = 20. The
discontinuities at A and B are due to the swap from model A and model B and
the steep spike at C is caused by an unavoidable mismatch of the two halves of
sampling joined together as shown in Figure 5. In both example it can be seen
how good is the sampling, with an error in the actual distance as low as 5% on
British Machine Vision Conference
Delta Theta( 0−PI/2)
Actual Sampling Distance
0.1
0.46
C
Arc Length
D_Theta
0.08
0.06
0.04
0.02
0.45
0.44
A
0
0
0.5
1
Theta
1.5
2
1
21
Theta parameter (0−PI/2)
B
42
63
Sample
84
Super Ellipse 1st Quadrant
2
20
1
Y
Theta
1.5
0.5
0
10
0
1
21
42
63
Sample
84
0
10
X
20
Figure 6: Two examples of equal-distance sampling (see text)
the full [0::=2] range.
The full sampling of the superellipse contour for = [?::] is trivially obtained
by mirroring and reversing the rst quadrant.
5 Extension to Deformed Superellipses
Superellipses are of particular utility when deformed because they can represent
more complex shapes. When any deformations, such as tapering and bending, are
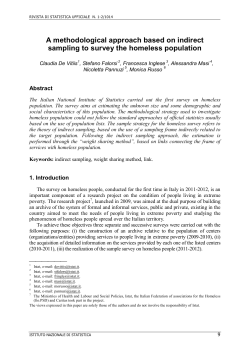
applied the sampling distance changes along the contour; Figure 7 (top) shows
this eect for the rst quadrant of a tapered superellipse ( = 0:5, Tx = 0:7 and
K = 3) sampled with the Frankin and Barr's method [2] with the corresponding
sampling distance. As it can be seen the error is rather big.
We show now how to extend the proposed method for tapered superellipses.
(The same idea could be employed to deal with bending deformations but with
more complex formulae).
By combining (1) and (3), the equation of a linearly tapered superellipse can
be written as:
British Machine Vision Conference
Explicit Method
Sampling Distance
6
150
5
Arc Length
Y
100
50
4
3
2
0
0
50
X
100
1
1
150
13
Parametric Method
37
49
Sampling Distance
4
150
3
Arc Length
100
Y
25
Sample
50
2
1
0
0
50
X
100
0
1
150
16
31
Sample
46
61
Figure 7: Example of sampling a deformed superellipse: explicit method (top) and
proposed parametric method (bottom)
x() = (Tx sin()
y() = a2sin()
+ 1)a1 cos()
As in Section 4.1, we can express the sampling distance D() as a function of
() and by solving for the latter we have:
() = D()
s
@y() 2
@x() 2
+
@
@
Near the singularities we need to employ a dierent model and we used the
same as Section 4.2 but with a modied sampled distance K' instead of K to take
into account what the distance will be after the deformation. By considering the
tapering geometry and assuming that near the singularities the shape is practically
straight, we have:
(
!0:
K0 = Katan
! =2 : K0 = K Tx1+1
a1 Tx
a2
British Machine Vision Conference
Figure 7 (bottom) shows the result of this sampling method in the same case
as before along with the actual sampling distance; from the latter graph it can be
seen that the improvement has been signicant in all the [0::=2] range.
6 Discussion
Superellipses are useful parametric models for representing two dimensional object
parts or aspects of 3-D parts.
In this work we have presented a parametric method that is able to achieve
equal-distance sampling of superellipse models contours and that can also cope
with deformations, whereas previous methods were unprecise and usable only with
undeformed models. The method can also be simply extended to superquadrics
using a spherical product of two superellipses.
We are currently investigating using deformable superellipses as primitives for
interpreting static 2-D images of natural 3-D objects under the new framework of
Model-based Optimisation, in which data segmentation and tting is done in single
unied process. In this context, a proper cumulative cost function is computed
along the contour instances and a precise sampling allows all contour parts to have
the same weights in nal result, improving accuracy and stability of the solutions.
References
[1] A. Barr. Superquadrics and angle preserving transformations. IEEE Computer
Graphics Applications, 1:1{20, 1981.
[2] W. Franklin and A. Barr. Faster calculation of superquadric shapes. IEEE
Computer Graphics and Applications, July 1981.
[3] M. Gardiner. The superellipse: a curve that lies between the ellipse and the
rectangle. Scientic American, Sept. 1965.
[4] A. Pentland. Perceptual organization and the representation of natural form.
Articial Intelligence, 28:293{331, 1986.
[5] A. Pentland and S. Scarlo. Closed-form solutions for physically based shape
modelling and recognition. IEEE PAMI, 13(7), July 1991.
[6] M. Pilu and R. Fisher. Representation of 3-D part aspects by deformable superellipses. Technical report, Department of Articial Intelligence, University
of Edinburgh, 1995. In Preparation.
[7] N. Raja and A. Jain. Recognizing geons from superquadrics tted to range
data. Image and Vision Computing, 12(3):179{189, Apr. 1992.
[8] K. Wu and M. Levine. Recovering of parametric geons from multiview range
data. In IEEE Conference on Computer Vision and Pattern Recognition, Seattle, WA, 1994.
© Copyright 2026 Paperzz