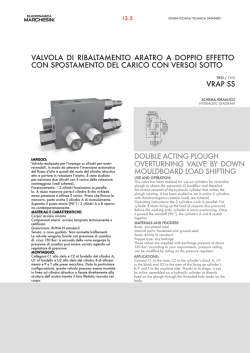
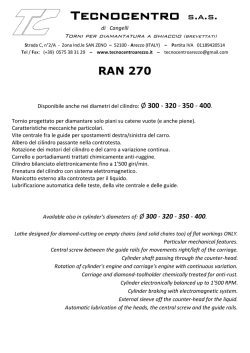
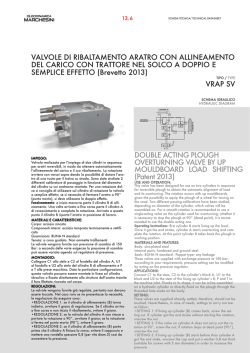
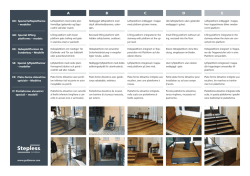
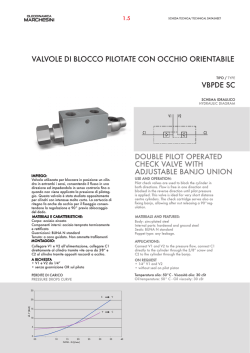
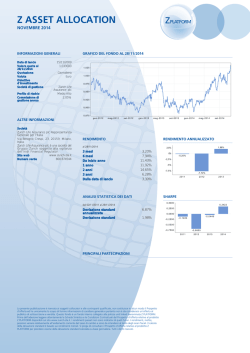
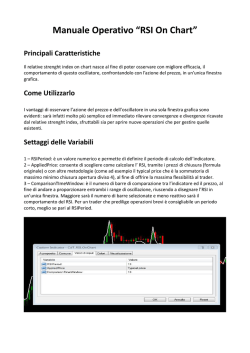
REVIEW OF SCIENTIFIC INSTRUMENTS 78, 075109 共2007兲 Source mass and positioning system for an accurate measurement of G G. Lamporesi, A. Bertoldi, A. Cecchetti,a兲 B. Duhlach,a兲 M. Fattori, A. Malengo,b兲 S. Pettorruso,b兲 M. Prevedelli,c兲 and G. M. Tinod兲 LENS, Dipartimento di Fisica, Università di Firenze and INFN-Sezione di Firenze, Via Sansone 1, 50019 Sesto Fiorentino, Firenze , Italy 共Received 3 March 2007; accepted 26 May 2007; published online 16 July 2007兲 We report on a system of well-characterized source masses and their precision positioning system for a measurement of the Newtonian gravitational constant G using atoms as probes. The masses are 24 cylinders of 50 mm nominal radius, 150.2 mm nominal height, and mass of about 21.5 kg, sintered starting from a mixture of 95.3% W, 3.2% Ni, and 1.5% Cu. Density homogeneity and cylindrical geometry have been carefully investigated. The positioning system independently moves two groups of 12 cylinders along the vertical direction by tens of centimeters with a reproducibility of a few microns. The whole system is compatible with a resolution ⌬G / G ⬍ 10−4. © 2007 American Institute of Physics. 关DOI: 10.1063/1.2751090兴 INTRODUCTION The CODATA-2006 recommended value for the Newtonian gravitational constant G is 6.67428共67兲 ⫻ 10−11 m3 kg−1 s−2.1 Despite the large number of experiments2–4 realized since 1798, when Cavendish performed his gravity measurements, G is still affected by an uncertainty larger than 100 ppm, much higher than that of any other fundamental constant. Starting with the first measurements at the 1% level,5 declared uncertainties were gradually reduced to 10 ppm.6 Even considering the most recent ones,6–13 the results differ by several hundreds of ppm. Among the possible reasons for this unexplained discrepancy, two can be identified as the most critical ones. First, all the experiments performed so far and claiming results more accurate than 1 part per thousand are based on macroscopic suspended masses, systematic effects introduced by different fibers are not clear and well studied, and they could be responsible for different shifts in different experiments. Second, the gravitational force is much weaker than the other fundamental forces and cannot be shielded; many competing effects of other forces or gravitational perturbations induced by surrounding masses can easily disturb the measurement or even mask the gravitational effect one wants to measure. Since the knowledge of G directly depends on the precision and accuracy to which the induced field is known, distances between attracting objects and their density distribution are crucial parameters. Based on these assumptions we built an apparatus in which freely falling microscopic masses, represented by atoms, probe the gravitational attraction induced by wellknown nearby placed source masses. In our accurate meaINFN-LNF, Via E. Fermi 40, 00044 Frascati 共RM兲, Italy. INRIM, Strada delle Cacce 91, 10100 Torino, Italy. c兲 Dipartimento di Chimica Fisica e Inorganica, Università di Bologna, Via del Risorgimento 4, 40136 Bologna, Italy. d兲 Electronic mail: [email protected] a兲 b兲 0034-6748/2007/78共7兲/075109/7/$23.00 surement of G by atom interferometry 共MAGIA兲 experiment,14 two cold atom ensembles simultaneously fall under the effect of gravity with equal initial velocity, but being vertically displaced by 30 cm. During their motion a Raman atom interferometer15 is operated in order to measure the vertical acceleration difference of the two samples. This gradiometer measurement is performed twice, for two different attractor mass configurations, inducing opposite sign accelerations on the two atomic ensembles. A conceptually similar experiment was recently reported in Ref. 16. Our source masses are arranged in two identical sets, independently movable along the vertical axis of the atomic fountain. Each set is composed of 12 tungsten cylinders 共50 mm radius, 150 mm height, and 21.5 kg mass兲 in a hexagonal configuration. In this article we report on the source masses and the support and elevator system that are being used for the MAGIA experiment. The density distribution of sintered tungsten cylinders, with a density of 18 200 kg/ m3, was measured with an uncertainty of 0.3 kg/ m3. The two sets of 12 cylinders each 共for a total mass of 520 kg兲 are independently held and vertically positioned with micrometric precision by a robust, low-vibration system. A pair of motors simultaneously rotates two long precise screws that support a large titanium platform holding the weight of 12 cylinders. Materials and geometrical arrangements chosen in the experiment are motivated, and performed characterization tests are illustrated. The results reported in this article can be of interest for several G experiments that have been using similar materials for the source masses, like, for instance, the one of Schwarz,17 but also for other G determinations using new methods or even for other precision measurements. SOURCE MASSES Geometrical configuration for the G experiment For the G measurement, we use 24 cylinders with a diameter of 100.00 mm and a height of 150.20 mm. They are 78, 075109-1 © 2007 American Institute of Physics Downloaded 16 Jul 2007 to 128.138.140.188. Redistribution subject to AIP license or copyright, see http://rsi.aip.org/rsi/copyright.jsp 075109-2 Rev. Sci. Instrum. 78, 075109 共2007兲 Lamporesi et al. TABLE I. Physical properties of INERMET 180 used for the G measurement in the MAGIA experiment. Physical property Composition FIG. 1. Geometrical arrangement 共top view兲 of one set of 12 cylinders. The central ring is the vacuum tube in which the atoms vertically move. divided into two sets of 12 cylinders and are symmetrically arranged on two holders, described in the next chapter. As shown in Fig. 1, each set has a group of six cylinders in contact with an internal ring and another group of six cylinders placed around them. The 12 cylinders form an arrangement with a hexagonal symmetry. The symmetry axis of the system is also the nominal direction of motion of the atoms. The adopted symmetry prevents induced horizontal acceleration along the axis and allows to provide a uniform vertical acceleration also in the case of horizontal probe displacements of the order of a few millimeters. Off-axis radial 共ar兲 and vertical 共az兲 acceleration components generated by the whole set of moving masses have been evaluated. The maximum ar was found to be ⬃1.6⫻ 10−9 m / s2 for each millimeter of atomic displacement from the symmetry axis. Since our measurement technique detects only the acceleration along the vertical direction, this gives no measurable contribution being ar much smaller than the local gravity g. On the other hand, az grows quadratically by ⬃7 ⫻ 10−4 mm−2, which means a vertical acceleration 5 mm off axis 1.25% higher than that expected along the axis. This is a large systematic shift that is not canceled out in the experiment. We therefore take the atomic distribution in space into account in the simulation of the experiment and suppress in this way this systematic error source. Using 24 small cylinders18 instead of two big tori 共as it is done by Nolting et al.19 and Schlamminger et al.11兲 gives a few advantages: First, one can manipulate these cylinders more easily than a heavy torus. Second, the density distribution is much more controllable for smaller pieces; therefore we gain in accuracy despite the increase of statistical uncertainty due to the positioning error of 24 cylinders instead of two tori. Third, small cylinders can be rotated around their own symmetry axis and can be interchanged with each other, reducing systematic error sources related with unknown inhomogeneities. Material physical properties In our experiment it is necessary to locally compensate the gravity gradient with the acceleration gradient generated by the source masses. It is then mandatory the use of a sufficiently high density material. Among high density materials, uranium and mercury are discarded because they are Nominal density Elasticity modulus Rigidity modulus Hardness Resistivity Thermal conductivity at = 18 000 kg/ m3 Linear thermal expansion at 20 ° C Volume magnetic susceptibility Value 95.3% W 3.2% Ni 1.5% Cu 18 000 kg m−3 360 GPa 140 GPa 298 HV 10 12⫻ 10−8 ⍀ m 110 W m−1 K−1 5.2⫻ 10−6 K−1 66⫻ 10−5 toxic. Platinum and iridium are too rare. Tantalum and gold are expensive. Lead is so soft that it can be easily deformed by handling. Pure tungsten is fragile at room temperature and consequently hard to machine. Sintered tungsten materials on the other hand are machinable while maintaining high density. Some physical properties are also desirable for the source masses: obviously a low thermal expansion coefficient, low magnetic susceptibility, and high resistivity. The commercial availability of the material was also taken into account. For all these reasons a particular kind of sintered tungsten 共INERMET 180兲 is a good candidate. Its physical properties are reported in Table I. Realization A brief description of the procedure used to realize the source masses 共PLANSEE GmbH, Germany兲 is reported here. Since a homogeneous mass distribution is fundamental for our purpose, a study of the realization procedure helps to understand what kind of inhomogeneities are possible and how to reduce them. Fine tungsten particles, with diameters of about 10– 50 m, are mixed with small percentages of nickel 共3.2%兲 and copper 共1.5%兲 acting as bonding materials. This mixture is placed in empty containers with the desired shape and is hydrostatically pressed. The resulting block is heated up to 1500 ° C in an oven, so that nickel and copper melt and fill the gaps between tungsten grains. Tungsten remains solid since its melting point is 3422 ° C. After this process, the block is cooled down to room temperature and nickel and copper solidify, bonding tungsten grains. Depending on the initial composition, the final density can range between 17 800 and 18 200 kg/ m3. In the same furnace run the typical density difference among different blocks is of the order of 0.1%. Holes of about 100 m diameter, like the one shown in Fig. 2, have been observed with a microscope in the blocks. These holes result from the volume reduction happening during the phase transition of the bonding materials from liquid to solid. The distribution of holes within the blocks is not homogeneous because of the thermal gradients arising during the cooling process. Outer regions cool down first, inducing Downloaded 16 Jul 2007 to 128.138.140.188. Redistribution subject to AIP license or copyright, see http://rsi.aip.org/rsi/copyright.jsp 075109-3 Rev. Sci. Instrum. 78, 075109 共2007兲 Source mass system for a G measurement Microscope analysis As already stated, the sintering process gives rise to the formation of holes with a diameter of the order of ⬃100 m inside the material. A sample cylinder was observed with an electronic microscope before and after the HIP treatment. In Fig. 2 an example of such holes is shown. Tungsten grains are clearly visible, surrounded by the bonding materials. The manufacturer states that these holes are greatly reduced in number and dimensions with the HIP treatment. Ultrasonic test FIG. 2. 共Color online兲 Microscope image of a sintered INERMET 180 sample before the HIP treatment. Tungsten grains are surrounded by bonding materials 共nickel and copper兲. A hole of about 100 m of diameter is clearly detected. bonding material migration from the internal to the external regions. Thus the blocks have density gradients or even porous domains with no bonding materials. The imperfection distribution due to this process is not predictable and therefore they must be suppressed. One way to reduce the number and the dimension of the holes is to machine small blocks since the effect of thermal gradients is reduced. A further step toward a more homogeneous density distribution is obtained by means of a particular treatment applied on the blocks after being sintered and called hot isostatic pressing 共HIP兲. The combination of high temperature 共1200 ° C兲 and pressure 共1000 bars兲 compresses the blocks, reducing the number and the dimensions of the holes. After this treatment, the density is increased by 1%. Mass characterization In any G measurement, an experimental signal is compared to the one expected from a simulation of the gravitational field generated by the source masses. A wrong knowledge of the mass distribution is directly translated into a systematic error on G. For this reason we carried on several studies that will be described in the following. Each cylinder was scanned with ultrasounds by the manufacturer. The ultrasonic test was performed in water where the cylinder was horizontally placed and rotated around its axis by steps of 3° until a full scan of 360° was completed. For a certain angle ultrasound waves were horizontally sent, propagated through the cylinder, and the echo signal from the cylinder backwall was detected. Every pore reduces the echo signal as it is not a solid metal and the sound is differently reflected. The resolution obtained using this technique limits the detection to imperfection larger than 1 mm. In Fig. 3, the ultrasonic test performed on one of the cylinders before and after the HIP treatment is shown. The same ultrasound power and amplification was used for recording both images and a clear density homogeneity improvement was reached. However, the test was performed by the company that realized the cylinders and we could not obtain from them any quantitative data. Surface studies One of the test cylinders was further machined and polished. Its surface quality was analyzed with a precise measuring machine 共Brown & Sharpe Scirocco-DEA兲. Length measuring accuracy along any direction in space is according to ISO 10360-2/VDI/VDE 2617 standards. The cylinder was fixed on a measuring stand, and scans with 100 points on the side and 50 on the upper plane were made. A calibrated spherical ruby head, with a radius of 3 mm precise within 1 m, was slowly moved toward the cylinder and brought into contact. The contact position was FIG. 3. 共Color online兲 Ultrasonic analysis of one cylinder before 共above兲 and after 共below兲 the HIP treatment. The ultrasonic tests on all the cylinders look qualitatively the same. The observation angle varies along the vertical axis in the graphs, whereas the horizontal axis shows the scan along the cylinder length. Downloaded 16 Jul 2007 to 128.138.140.188. Redistribution subject to AIP license or copyright, see http://rsi.aip.org/rsi/copyright.jsp 075109-4 Rev. Sci. Instrum. 78, 075109 共2007兲 Lamporesi et al. TABLE II. Density values of the 15 blocks cut out of a test INERMET 180 cylinder. All values are expressed in kg/ m3. The average density results 18 249 kg/ m3 and the standard deviation 12 kg/ m3. 1 2 3 4 5 FIG. 4. Schematic view of the 15 small parallelepipeds obtained from the sample cylinders. The density of the blocks was measured and compared by weighing in air and in water. registered and the cylinder surface was scanned. The upper points were fitted with a plane and the side ones with a cylindric surface. The resulting surface was well machined in terms of both precision and accuracy. Declared diameter of the cylinder was 99.849共1兲 mm, and the measured one 99.845共1兲 mm. The cylinder surface was tested to be cylindric at the micron level both in terms of roughness and orthogonality between cylinder axis and base planes. Density test To evaluate the density homogeneity, we performed a destructive test on one of the three spare cylinders. The density measurements were performed at the Mass Section of the Italian Metrological Institute INRIM 共formerly IMGC兲. Since the required precision is reached for samples of at least 500.0 g, the cylinder was cut into 15 parallelepipedal blocks with a squared basis of 25.2⫻ 25.2 mm2 and was 43.9 mm high. The 15 blocks were taken out of three slices, one at the top 共A兲, one at the center 共B兲, and one at the bottom 共C兲. From each slice four blocks 共1–4兲 were taken as close as possible to the lateral surface and one 共5兲 on the cylinder axis. Figure 4 shows the block positions in the original cylinder. The density was determined by using the hydrostatic weight method based on the Archimedes principle. It consists in determining the buoyancy force acting on a body completely immersed in a fluid. The buoyancy is equal to the weight of the displaced fluid. The mass was measured in a standard way, in air by comparison with certified masses, taking the air buoyancy into account. For the volume deter- A B C 18 260.51共27兲 18 255.29共29兲 18 249.59共27兲 18 252.77共29兲 18 232.52共29兲 18 248.93共31兲 18 246.19共29兲 18 238.66共31兲 18 240.30共34兲 18 222.14共30兲 18 268.93共27兲 18 261.60共29兲 18 254.76共29兲 18 262.14共29兲 18 242.10共28兲 mination a hydrostatic weighing was done, using bidistilled water as a reference. Air density was deduced from the atmospheric pressure, air temperature, and humidity values.20,21 Water density was determined as a function of temperature 共measurement uncertainty of 0.01 ° C兲 and of atmospheric pressure by using the equation recommended by the Comité International des Poids et Mesures 共CIPM兲.22 The blocks were compared in air with the standard masses in groups of three, using the double exchange weighing measurement scheme. A similar procedure was adopted for the hydrostatic measurements having the standard masses in air, adding further comparisons between samples from different groups. Both sets of measurements have been performed using an automated Mettler AX1005 balance 共capacity: 1100 g, resolution: 0.01 mg; reproducibility: 0.02 mg兲. A least squares method23 was used to estimate mass and volume values for all the 15 blocks, and the density was deduced by their ratio. A first set of measurements gave unexpected results. A decrease in weight was observed with time. This behavior was understood and explained considering that the blocks were roughly milled and the surfaces were not precisely machined and flat. This enhanced the probability of oxide formation. This oxide is soluble in water and resulted in a mass reduction during the experiment. Up to 180 mg were lost by a single block in two weeks time 共520 g / h兲 for this reason. The set of measurements was then repeated after polishing the surfaces with a diamond paste and the observed mass loss reduced to less than 200 g / h of water bath. With this measurement method the 15 blocks exhibited an average density of 18 249 kg/ m3 and a relative density variation of 6.6⫻ 10−4 as given by the standard deviation, being 2.6⫻ 10−3 the maximum density difference. Table II shows the resulting density values. A clear density reduction 共see Fig. 5兲 is observed when moving toward the center both in the radial and in the axial directions. The minimum measured density value is, in fact, for block B5, as expected because of residual porous regions due to the thermal gradients after the sintering process, not removed by HIP treatment. Assuming that all the cylinders have a similar density distribution, this effect can be easily included in the simulation. SUPPORT AND ELEVATOR In our experimental scheme the source masses need to be held and moved with high positioning precision. The mass holder and elevator 共realized by RMP srl, Rome兲 was designed, in collaboration with INFN-LNF, in order to attenu- Downloaded 16 Jul 2007 to 128.138.140.188. Redistribution subject to AIP license or copyright, see http://rsi.aip.org/rsi/copyright.jsp 075109-5 Rev. Sci. Instrum. 78, 075109 共2007兲 Source mass system for a G measurement FIG. 5. Density values measured on the 15 blocks out of the cut cylinder. Squares, circles, and triangles, respectively, indicate density values for blocks out of planes A, B, and C. Dotted lines are related to observation along the horizontal axis 1-5-3, whereas straight lines to 2-5-4. On each plane and along each column, the central block is clearly the lightest resulting in an evident lowest density value for the central block B5. ate vibrations, strong enough to hold all the cylinders without significant bending or deformations and with independent positioning control for the two sets of masses. Technical description A picture of the mass holder is shown in Fig. 6. Four aluminum 3.5 in. diameter legs hold the whole structure around the vacuum system and lie on the same optical table. The movable parts that need to be known with particular accuracy in terms of density, geometry, and positioning with respect to the elements at rest since they contribute to the detected gravitational signal are two large disk-shaped platforms with a hole in the center large enough to fit the inter- ferometer tube and the magnetic shields. The materials used for the two platforms, their densities, and geometrical parameters are reported in Table III. Each platform is held and moved by two 480 mm long precision screws 共IKO TU86S兲 that have a diameter of 15 mm and a pitch of 10 mm. The movement of each screw is controlled by a step motor 共Lin Engineering 5718L-03兲 with an angular resolution of 1.8° corresponding to 1 / 200 of a turn, followed by a 30:1 gear 共Bonfigli VF30-30F HSB6兲 and a protection clutch that act whether a torque higher than 5 N m is applied. In this way the resolution on the vertical motion is 1.7 m. Vertical velocities of 20 mm/ s can be reached. On each driving shaft an encoder 共USDigital E6D-1000-250-I兲, with a much better resolution 共4000 pulses per turn兲 than that of the motor, is mounted. A vertical movement of 1 mm corresponds to 12 000 pulses on the encoder. A stepping motor controller QuickSilver SilverNugget N2-E1 drives each motor after being programed through RS-232. In each platform the two controllers are in a master-slave configuration, with the slave tracking the master motion. An optical ruler 共HEIDENHAIN LS-603兲 is fixed on the rigid structure and the pointer is connected to the platform so that the vertical position can be monitored in real time with a resolution of 1 m. Reproducibility of the optical ruler readout is excellent, but in order to have 1 m accuracy on the vertical position it must be aligned to the axis of the structure within 2 mrad. Translational degrees of freedom The two platforms can be independently and simultaneously moved. The motion is restricted to the vertical axis. Each platform can be moved by 370 mm, but the two ranges overlap for 187 mm. The vertical position where the two sets of masses can be placed next to each other spans 277 mm 共considering also cylinder and platform heights兲. Platform deformation study The titanium platform deformation due to the cylinder weight was calculated using a finite element method. For each platform the complete holding structure was computed considering 6037 elements with eight constraints represented by the screws that fix the external aluminum ring to the elevator. Figure 7 shows the deformation induced once the platform is loaded. A maximum vertical displacement of 9 m results at the center of the platform and on the borders far from the holding screws. A preliminary version of the holders did not have the aluminum external rings and the maximum deformation in that case was 21 m. Elevator calibration FIG. 6. 共Color online兲 Picture of the mass holder and elevator. Two of the four legs are visible on the bottom: above them the horizontal plate and the four columns connected on the top by a circular plate. The two moving platforms hold two sets of cylinders. Various tests on the precision and repeatability of the elevator motion were performed. For several heights the platform position was recorded with two independent devices: the optical ruler and an external laser tracker. A set of reproducibility and precision movement measurements have been performed on the mass holder and el- Downloaded 16 Jul 2007 to 128.138.140.188. Redistribution subject to AIP license or copyright, see http://rsi.aip.org/rsi/copyright.jsp 075109-6 Rev. Sci. Instrum. 78, 075109 共2007兲 Lamporesi et al. TABLE III. Density and dimensions of the movable parts of the mass holder. Three materials have been used. Each of them is a single block piece, but here it is decomposed into rectangular section tori whose gravitational contribution can be easily calculated. The position indicated in the last column is relative to the upper surface of the platforms, where the cylinders are positioned. Part Material Density 共kg/ m3兲 Int. ring AISI 316L 7650 Platform Ext. ring Titanium ASME SB265 Grade 2 Anticorodal 6082 T651 Rint 共mm兲 Rext 共mm兲 Height 共mm兲 Position 共mm兲 47.0 47.0 50.0 49.8 25.0 25.0 12.5 −12.5 49.8 49.8 220.0 216.0 11 28 −5.5 −25 225 220 217 248 248 248 81 11 8 40.5 −5.5 −15 4520 2700 evator. The laser tracker employed is an optical interferometer with a resolution of 1.26 m 共2 with = 633 nm兲. Three cat’s eye holders were glued on each platform, defining points A, B, and C. The laser tracker can be optically locked on the cat’s eye so that for each platform position, it was moved from one holder to another and its position in space was recorded. In order to define a reference plane, six points on the basement of the holder were used. The laser tracker has an accuracy of ±25 m, essentially limited by platform vibrations. The moving systems have been labeled with 1 共master兲 and 2 共slave兲 for the lower platform and 3 共master兲 and 4 共slave兲 for the upper one. The cat’s eye holders were placed close to axes 2 共A兲, 1 共B兲 and 4 共C兲 on the lower platform, and close to axes 2 共A兲, 3 共B兲, and 1 共C兲 on the upper platform. In this way A and B on the lower platform measure the pitch difference between the two screws, and C the deformations from the vertical motion. On the upper platform B acts as a reference position and A and C detect the deformations. In Table IV results originating from a set of ten movements of 200 mm are reported. The reproducibility measured with the laser tracker system is consistent with the one observed on the optical ruler display within 1 m. Dynamic measurements were performed as well, and a spiral motion with a mean radius of 5 – 7 m and a pitch similar screw’s one was observed. Cylinder centering system Presently, the cylinders are positioned on the holding platforms by placing them into contact in the hexagonal symmetry 共see Fig. 1兲. A centering system was developed for a future more precise positioning on the platforms. We built a prototype for a single cylinder and performed a set of measurements on it in order to check the positioning repeatability. A spare cylinder was used for this measurement. In this configuration three silicon nitride spheres 共3 mm radius兲 were set on the bottom side of the cylinder on the vertices of an equilateral triangle with 80 mm sides 共see Fig. 4兲. Three TABLE IV. Results of platform position measurements performed observing their motion with a laser tracker. A nominal movement of 200 mm was repeated ten times and the final position was acquired on three points of each platform. ⌬z indicates the measured movement and z its standard deviation. FIG. 7. 共Color online兲 Deformation 共vertical displacement兲 of the platform due to the tungsten load calculated by a finite element method. A maximum displacement of 9 m results. Platform Cat’s eye ⌬z 共mm兲 z 共m兲 Upper A B C 199.9928 199.9962 200.0158 0.4 1.3 1.5 Lower A B C 199.9812 199.9844 199.9914 1.1 0.5 0.9 Downloaded 16 Jul 2007 to 128.138.140.188. Redistribution subject to AIP license or copyright, see http://rsi.aip.org/rsi/copyright.jsp 075109-7 Rev. Sci. Instrum. 78, 075109 共2007兲 Source mass system for a G measurement V-shaped seats for the spheres made of tungsten carbide were installed on a steel platform. The seats were rotated 120° from each other, centered to match with the sphere positions. The cylinder orientation was measured, after positioning it on the triple seat, using the same precision device used for the surface studies. The acquisition was done several times after removing and repositioning the cylinder back for each of the three configurations rotated by 120°. In order to quantitatively describe how well the cylinder can be positioned in the same place, the center of the upper face and the cylinder axis were obtained from the fit of the upper plane and that of the side surface. A fluctuation of the upper plane center spatial position of 4 m and a cylinder orientation jittering of the order of 5 rad resulted. DISCUSSIONS A complete system of well-characterized tungsten source masses and a precise positioning instrument, suitable for a measurement of the Newtonian gravitational constant G, was presented. Microscope analysis, density homogeneity tests, and surface studies of the source masses were reported as well as the calibration measurements and position and repositioning control of their support. An internal density homogeneity better than 7 ⫻ 10−4 over volumes of 28 cm3 and a cylindrical surface definition within 2 m were observed. These source mass properties, together with the checked possibility of vertically positioning the cylinders with an accuracy of 10 m and a repeatability of 1 m, allow a G measurement with an uncertainty below 10−4. This work on the source mass system is fundamental for our MAGIA experiment in order to reach an accuracy on G of 10−4, as illustrated in Ref. 24. The present sensitivity of our apparatus is about G / 冑Hz.25 A G determination at the level of 6 parts per thousand in a few hours data acquisition has already been obtained and it is consistent with the CODATA-2006 recommended value. ACKNOWLEDGMENTS This work was supported by INFN, MIUR, ESA, and EU 共under Contract No. RII3-CT-2003-506350兲. The authors acknowledge seminal discussions with J. Faller, A. Peters, and M. Kasevich. The authors also thank T. Grasso, who carried on the measurements with the laser tracker, M. Falorsi, who cut tungsten cylinders for the density tests, and A. Peuto for contributing to the density test and for a critical reading of the article. P. J. Mohr and B. N. Taylor, Rev. Mod. Phys. 77, 42 共2005兲. G. T. Gillies and R. C. Ritter, Rev. Sci. Instrum. 64, 283 共1993兲. 3 J. Luo and Z. K. Hu, Class. Quantum Grav. 17, 2351 共2000兲. 4 T. Quinn, Nature 共London兲 408, 919 共2000兲. 5 H. Cavendish, Philos. Trans. R. Soc. London 88, 469 共1798兲. 6 J. H. Gundlach and S. M. Merkovitz, Phys. Rev. Lett. 85, 2869 共2000兲. 7 C. H. Bagley and G. G. Luther, Phys. Rev. Lett. 78, 3047 共1997兲. 8 O. V. Karagioz, V. P. Izmailov, and G. T. Gillies, Gravitation Cosmol. 4, 239 共1998兲. 9 T. J. Quinn, C. C. Speake, S. J. Richman, R. S. Davis, and A. Picard, Phys. Rev. Lett. 87, 111101 共2001兲. 10 U. Kleinevoss, Ph.D. thesis, Universität Wuppertal, 2002. 11 S. Schlamminger, E. Holzschuh, and W. Kündig, Phys. Rev. Lett. 89, 161102 共2002兲. 12 T. R. Armstrong and M. P. Fitzgerald, Phys. Rev. Lett. 91, 201101 共2003兲. 13 J. Luo, Z. K. Hu, X. H. Fu, and S. H. Fan, Phys. Rev. D 59, 042001 共1998兲. 14 A. Bertoldi et al., Eur. Phys. J. D 40, 271 共2006兲. 15 M. Kasevich and S. Chu, Appl. Phys. B: Photophys. Laser Chem. 54, 321 共1992兲. 16 J. B. Fixler, G. T. Foster, J. M. McGuirk, and M. Kasevich, Science 315, 74 共2007兲. 17 J. P. Schwarz, Ph.D. thesis, University of Colorado, 1998. 18 M. Fattori, Ph.D. thesis, Università di Firenze, 2005. 19 F. Nolting, J. Schurr, S. Schlamminger, and W. Kündig, Meas. Sci. Technol. 10, 487 共1999兲. 20 P. Giacomo, Metrologia 18, 33 共1982兲. 21 R. S. Davis, Metrologia 29, 67 共1992兲. 22 M. Tanaka, G. Girard, R. Davis, A. Peuto, and N. Bignell, Metrologia 38, 301 共2001兲. 23 M. Mosca and A. Peuto, Metrologia 34, 401 共1997兲. 24 M. Fattori, G. Lamporesi, T. Petelski, J. Stuhler, and G. M. Tino, Phys. Lett. A 318, 184 共2003兲. 25 G. Lamporesi, Ph.D. thesis, Università di Firenze, 2006. 1 2 Downloaded 16 Jul 2007 to 128.138.140.188. Redistribution subject to AIP license or copyright, see http://rsi.aip.org/rsi/copyright.jsp
© Copyright 2026 Paperzz