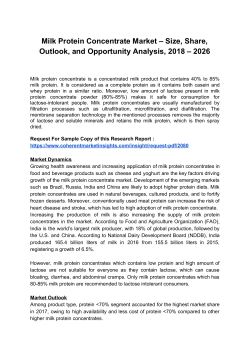
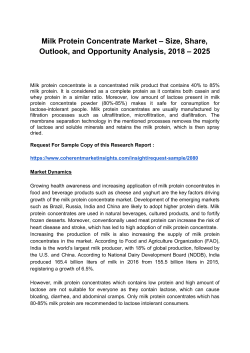
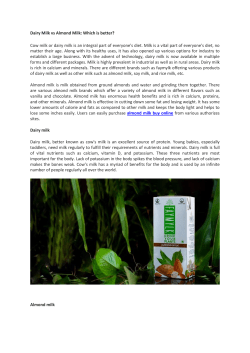
Energy in South African food
processing – Opportunities for
improving efficiency
andrew murray
Energy Efficient
[email protected]
Hygienic
Design
Presentation for
March 2014
1
amc
Energy in South African food processing –
Opportunities for improving efficiency
o
o
o
o
Realities regarding energy
Realities regarding the food industry
Audits and benchmarks
Energy saving – four stages of energy
saving
o Energy saving measures for Food
Processors
o Conclusion
2
amc
Realities regarding energy
o
o
o
o
3
The Geosphere
Energy vs Biomass
The local situation
Prime Energy
amc
The Geobiosphere
Sun
Deep
Moon
Earth
Tidal Energy
Fuel
Reserves
Heat
Assets of Environment
And Society
Minerals
50% heat
50% light
Solar
Energy
Production
Geobiosphere
4
Radiation out
Howard T Odum
amc
Biomass
Photosynthesis
Energy
Biomass
Heat
We are harvesting 40% of terrestrial
biomass for human use
5
amc
6
amc
Eskom
1%
5%
5%
Coal
Gas Turbines
Nuclear
Hydro and other
89%
Installed 42 000 MW
7
amc
In construction
o Medupi Thermal
o Kusile Thermal
4800 MW
4800 MW
And for example
o Caledon Wind Farm
300 MW
o eThekwini Municipality Waste 8 MW
8
amc
Standards and legislation
o ISO 50000 Energy Management
Systems
o SATS 50010:2010 Verification of
Energy Savings
o Eskom tariffs
o Punitive tariffs
o Tax incentives - L12
o Carbon tax
9
amc
Efficiencies – Prime energy
20% efficient
35% efficient
10
amc
Realities regarding the food
industry
o The last century – cheap energy and
expensive capital
o Emphasis on Cleaning
o Mostly Thermal
11
amc
Energy breakdown – UK
figures
Energy use in food process
Boilers and steam
Direct heating (fuel)
Direct heating (electricity)
Refrigeration
Compressed air
Motors and drives
%
49
18
8
6
2
17
100
Figures from Campden - modified
12
amc
Energy in South African food processing –
Opportunities for improving efficiency
o
o
o
o
Realities regarding energy
Realities regarding the food industry
Audits and benchmarks
Energy saving – four stages of energy
saving
o Energy saving measures for Food
Processors
o Conclusion
13
amc
Energy Audit Goals
o To clearly identify costs
o Understand usage and wastage
o Identify more cost effective ways
o Improved techniques
o New Equipment
o Cost analysis
14
amc
Energy Audits
Step
Step
Step
Step
Step
Step
Step
Step
Step
Step
Step
Step
Step
15
1: The Client Meeting
2: Historical data analysis before the site visit
3: The Walk-through—a condition survey
4: Analyse energy consumption and costs
5: Comparative analysis
6: Defining the audit mandate
7: Defining the audit scope
8: Detailed Walk-throughs
9: Analyse Energy Use
10: Inventory energy loads
11: Identify energy management opportunities
12: Assess the costs and benefits
13: Report for actioning
amc
Specific Energy Use – Industry
Benchmark-Dairy Industry
Market milk and cultured
products
kWh/L processed milk
0.1-0.2
Cheese and whey
kWh/L processed milk
0.2-0.3
Milk powder, cheese,
and (or) liquid prodcts
kWh/L processed milk
0.3-0.4
Ice cream
kWh/kg Ice cream
0.8-1.2
World Bank Group
16
amc
8.624
ice bank
0.26
mixer
0.17
pumps
5.22
0.26
kg raw milk
PRE-COOLING
HOLDING
0.17
pumps
CLARIFICATION
PRE-HEATING
PASTEURISATION
pumps
SEPARATION
STANDARDISATION
ice bank
COOLING
pumps
0.01
0.47
PACKING
44.55
0.08
PASTEURISATION
COOLING
store
COLDSTORAGE
additives
IN VAT - BLENDING
INOCULATION
FERMENTATION
RENNETING
3.71
CUTTING/STIRRING
SCALDING
stirrers and pump
DRAINING ETC
0.03
1.71
0.65
MOULDING/PRESSING
0.65
BRINING
store
7.611
kg cream
kg whey
0.018
kg salt etc
RIPENING
17.38
0.12
WAXING/WRAPPING
START-UP/CLEANING
1.000
kg cheese
Energy per kg of final product (kJ)
Electrical
Other
Total
Energy per kg of feed (kJ)
Electrical
Other
Total
Installed Power (kW)
12.30
5.89
4.15
1.24
1.00
Electricity
ENERGY DIAGRAM
PRODUCT: Gouda Cheese (1)
QUALIFIER: Medium Dairy ( 10000 l milk/day)
ASSUMPTIONS:
1. Milk is received cool (7 deg)
2. Cream is batch pasteurised and packed
3. Negligible Product losses
4. Composition: Dry matter 58%,
Fat in total solids 54%, Salt 1.8%
5. Yield 1 kg cheese from 8.6 kg milk
Heat from
combustion
ENERGY INPUTS IN % OF TOTAL REQUIREMENTS
Main Product
By Product
17
921.48
1618.21
2539.69
SERVICES
LIGHTING
ICE BANK
COLD STORE
106.85
187.64
294.48
57.75
amc
8.255 kg raw milk
ice bank
1.90
mixer
35.54
ice bank
additives
0.73
1.73
stirrers
PRE-COOLING
HOLDING
pumps
0.06
CLARIFICATION
PASTEURISATION
COOLING
mixer
1.28
BLENDING
INOCULATION
FERMENTATION
RENNETING
CUTTING/STIRRING
7.273
kg whey
HEATING
SEPARATION
SCALDING/STIRRING
DRAINING
MOULDING/PRESSING
0.018
kg salt etc
BRINING
0.43
WRAPPING/WAXING
RIPENING
1.000
kg cheese
Energy per kg of final product (kJ)
Electrical
Other
Total
Energy per kg of feed (kJ)
Electrical
Other
Total
Installed Power (kW)
Main Product
By Product
Electricity
0.00
START-UP/CLEANING
SERVICES
LIGHTING
ICE BANK
COLD STORE
25.82
4.15
17.27
10.81
0.28
6681.09
0.00
6681.09
809.33
0.00
809.33
104.89
PRODUCT: Gouda Cheese (2)
QUALIFIER: Small Dairy ( 500 l batch)
ASSUMPTIONS:
1. Milk is received from the parlour
2. Cream is not separated
3. Negligible Product losses
4. Composition: Dry matter 56% ;
Fat in total solids 53.9 %, Salt 1.8%
5. Yield 1 kg cheese from 8.26 kg milk
ENERGY INPUTS IN % OF TOTAL REQUIREMENTS
Heat from
combustion
18
amc
Energy in South African food processing –
Opportunities for improving efficiency
o
o
o
o
Realities regarding energy
Realities regarding the food industry
Audits and benchmarks
Energy saving – four stages of energy
saving
o Energy saving measures for Food
Processors
o Conclusion
19
amc
Demand Side Management
o
o
o
o
20
Behavioral change
Operational efficiency
Equipment efficiency
Process improvements
amc
Dimensions of Energy
Management
Behavioral
Organisational
21
Technical
amc
Energy in South African food processing –
Opportunities for improving efficiency
o
o
o
o
Realities regarding energy
Realities regarding the food industry
Audits and benchmarks
Energy saving – four stages of energy
saving
o Energy saving measures for Food
Processors
o Conclusion
22
amc
Energy Saving - Organisational
and Equipment
o
o
o
o
o
o
o
o
o
23
Natural Light
Insulation
Cold store doors
Steam Traps
Boilers
Pumps, Centrifuges etc
Shrink wrap and shrink label
Waste heat recovery
Cleaning – CIP and COP
amc
Cleaning
o CIP
o Reuse systems
o Hygienic design of equipment
o Cold CIP where possible
o Spray devices
o Returns from fillers
o COP
o Hygienic design of buildings
o Reuse in crate washers and dishwashers
24
amc
Rotational
Dual axis
Rotational
Low pressure
Stationary
25
Rotational
High pressure
amc
Marefa
26
Marefa
amc
Energy Saving - process
o Using continuous, instead of batch,
pasteurisers
o Alternative sterilisation and pasteurisation
o Partial treatments eg partially
homogenizing milk to reduce the size of
heat exchangers
o Efficient Concentration methods
o Drying systems and pre drying
o Heat Pumps
27
amc
Alternative
Pasteurisation/sterilisation
o Ultra violet
o Ultra high pressure
o Induction heating
28
amc
Alternative - Induction
heating
29
amc
Heat pump
30
amc
Heat Pump Evaporator
31
amc
Conclusion
o Energy is a major issue for the food
processing industry
o There are benchmarks available.
o People are being trained to carry out
audits and manage energy
o Energy management will become
essential for all plants.
o There are savings to be made.
32
amc
As the dairy industry we are convinced that
dairy farming has to bring a balance between
feeding the world and protecting the
environment. The sector should be pro-active.
We mustn’t wait for legislation from our
various governments, but must act as
individuals and all within the value chain and
make sure that we farm under a clean and
friendly environment.
Tom Opio Oming, East
and Southern African Dairy Association
(ESADA) Chairman
33
amc
Thank you for your
attention.
www.foodengineering.co.za
[email protected]
34
amc
© Copyright 2026 Paperzz