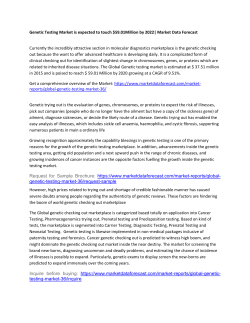
DNA polymorphism in genetic resources
of red pepper using microsatellite markers
P. Hanáček1, T. Vyhnánek1, M. Rohrer1, J. Cieslarová1, H. Stavělíková2
1
Department of Plant Biology, Faculty of Agronomy, Mendel University of Agriculture
and Forestry in Brno, Brno, Czech Republic
2
Department of Vegetables and Special Crops, Crop Research Institute, Prague-Ruzyně,
Workplace in Olomouc, Czech Republic
Abstract: Genetic variability among 41 accessions of red pepper (Capsicum annuum L.) was assessed using eight
microsatellite markers. Three of the microsatellite markers (Hpms 1-1, Hpms 1-168, and Hpms 1-274) had uniform
spectra in all the analyzed plants. Two to eight alleles were detected for the remaining loci. In total, 28 alleles were
detected, i.e. 3.5 alleles per one microsatellite locus on average. The highest number of different alleles was detected
with Hpms 1-5 (8 alleles) and Hpms 2-21 primers (7 alleles). Molecular data were complemented with morphological
measurements according to the descriptor list for the genus Capsicum. A dendrogram based on our genetic analysis
suggests a high level of similarity between some of the accessions presumed to be distant and, at the same time, genetic
variability between accessions of the same or similar name. These results show the possibility of duplicities in the current Czech collection of red pepper genetic resources.
Keywords: pepper; genetic resources; microsatellites; SSRs; variability
The often excessively large extent of the genetic
resources collections prevents a detail characterization of the individual accessions that is a prerequisite of their future use and, at the same time, it
hampers the process of efficient regeneration necessary to preserve the seed viability. The concept of
“core” collections was introduced in the 1980’s to
counter the trend of extensive and unmanageable
resources with a focus on preserving the broadest
possible genetic spectrum of the original collection based on detailed genetic, morphological and
agronomic description (Brown 1989). In order to
preserve the integrity and potency of seed samples
it is required that the whole spectrum of genetic
diversity is preserved on a long term basis while, at
the same time, sufficient amounts of seeds for the
potential use is preserved. It is very likely that the
gene banks contain a number of identical samples
kept under various numbers of the EVIGEZ (Czech
Information System of Genetic Resources). Such
duplicated accessions often originate from foreign resources, where they are kept under different
identification. As a result, duplications increase the
costs of preserving the collection and they cause
undesirable genetic erosion resulting in unfavourable ratio of collection size and overall genetic variability. All these inefficient genetic resources impede
the breeding progress and considerably reduce the
opportunities to respond to the requirements of
farmers and consumers.
At present, a number of methods are used to evaluate the genetic diversity and variability in the collections of genetic resources; e.g. morphological
characteristics, analysis of the genealogy, biochemical markers (in particular proteins and their various
iso-enzyme variants) and the dynamically developing
molecular (DNA) markers (Zhang et al. 2007). Within the DNA markers, the microsatellite markers (SSRs
– Simple Sequence Repeats), are especially useful due
to their high degree of polymorphism and co-dominant character of heredity. The use of microsatellite
polymorphisms to study the genetic diversity and variability was described for a number of plant species,
e.g. in pea (Haghnazari et al. 2005), tomato (Wang
Supported by the Internal Grant Agency of Mendel University of Agriculture and Forestry in Brno, Project No. DP1/AF/2008,
and the National Programme for the Preservation and Use of Genetic Resources of Plants and Agro-biodiversity of the Ministry
of Agriculture of the Czech Republic, Project No. 20139/2006-13020.
Hort. Sci. (Prague), 36, 2009 (4): 127–132
127
Table 1. Survey of the analyzed pepper accessions
Order
Number EVIGEZ
Name
Order
Number EVIGEZ
Name
1
09H3100071
Tetenyi
22
09H3100139
Aufrechte Cayenne
2
09H3100243
Kalocsai Furzer (Edes)
23
09H3100140
Aufrechte Cayenne
3
09H3100244
Kalocsai Furzer (Edes)
24
09H3100111
Bogyisloi
4
09H3100245
Kalocsai Furzer (Edes)
25
09H3100112
Bogyiszloi
5
09H3100290
Vinedale
26
09H3100113
Bogyiszloi
6
09H3100291
Vinedale
27
09H3100114
Bogyiszloi Vastaghusu
7
09H3100055
Astrachanskij
28
09H3100351
Japan Madarszen
8
09H3100056
Astrachanskij
29
09H3100503
Japan Madarszen
9
09H3100057
Astrachanskij
30
09H3100504
Japan Madarszen
10
09H3100058
Astrachanskij
31
09H3100505
Japan Madarszen
11
09H3100541
Astrachanskij
32
09H3100067
Tetenyi
12
09H3100059
Astrachanskij 147
33
09H3100068
Tetenyi
13
09H3100416
Hatvani
34
09H3100069
Tetenyi
14
09H3100350
Japan Madarszen
35
09H3100070
Tetenyi
15
09H3100419
Hatvani Csemege
36
09H3100288
Vinedale
16
09H3100418
Hatvani
37
09H3100349
Japan Hontakka
17
09H3100417
Hatvani
38
09H3100501
Japan Hontakka
18
09H3100354
Konservnyj Belyj 289
39
09H3100502
Japan Hontakka
19
09H3100292
Vinedale
40
09H3100352
Konservnyj Belyj 289
20
09H3100137
Aufrechte Cayenne
41
09H3100353
Konservnyj Belyj 289
21
09H3100138
Aufrechte Cayenne
et al. 2006) and rape (Li et al. 2007). In the present
study we evaluated the variability of SSR markers in
selected accessions of pepper in the collection of the
Crop Research Institute, Prague-Ruzyně, Department
of Vegetables and Special Crops in Olomouc.
MATERIAL AND METHODS
Genetic variability was assessed in 41 accessions
of pepper (Capsicum annuum L.) (Table 1). The
plants were grown in isolation cages on plots of the
Research Institute Gene Bank Olomouc and the
genotypes were described according to two classifiers: IPGRI – 27 characters (Ipgri 1995) and UPOV
– 44 characters (Upov 2006). The applied classifiers
are complementary since they provide different type
of description. The Ipgri classifier is intended for
morphological description of genetic resources and
the Upov classifier serves for morphological characterization of certified varieties. In total, 54 characteristics were evaluated for pepper: one in seedlings,
128
eight in plants, 10 in leaves, 10 in flowers and 25 descriptors in fruits. DNA polymorphism, detected by
the SSR method, was used as genetic marker.
The genomic DNA was isolated using the Invisorb Spin Plant Mini Kit (INVITEK, Germany)
from leaves collected from plants at the beginning
of flowering. Three plants of each accession were
sampled by collecting four leaf discs from each
plant (approximately 80 mg). The DNA concentration was measured fluorimetrically. Eight SSR
markers described previously for pepper were used
(Lee et al. 2004; Minamiyama et al. 2006). The
25 μl-reaction mixture for PCR contained: 30 ng
template DNA, 1 U Taq polymerase (PROMEGA,
USA), 1× concentrated reaction buffer, 0.2µM of
fluorescence-labelled forward primer, 0.2µM of reverse primer, and 0.1mM dNTPs.
The PCR program consisted of initial denaturation for 3 min at 94°C, followed by 35 cycles of 1 min
at 94°C, 1 min at 50–55°C (subject to the used pair
of primers), 2 min at 72°C, and 1 cycle 10 min at
72°C. The PCR amplification was verified by agarHort. Sci. (Prague), 36, 2009 (4): 127–132
Table 2. Characteristics of the SSR markers
SSR marker
Linkage group
Number of alleles
Range (bp)
Hpms 1-1
1
1
270
Hpms 1-5
6
8
269–322
Hpms 1-168
16
1
172
Hpms 1-172
11
2
338–340
Hpms 1-274
7
1
175
Hpms 2-21
10
7
266–296
Cams 163
5
2
248–250
Cams 647
3
6
188–224
Average number of alleles per locus
3.5
Table 3. Statistical evaluation of the analyzed SSR markers
SSR marker
DI
PI
PIC
Hpms 1-1
0.00
1.00
0.00
Hpms 1-5
0.73
0.04
0.72
Hpms 1-168
0.00
1.00
0.00
Hpms 1-172
0.18
0.69
0.16
Hpms 1-274
0.00
1.00
0.00
Hpms 2-21
0.68
0.09
0.67
Cams 163
0.31
0.52
0.26
Cams 647
0.75
0.03
0.74
Average
0.33
0.55
0.32
DI – diversity index, PI – probabilities of identity, PIC – polymorphic information content
ose electrophoresis before loading of the samples on
capillary electrophoresis ABI Prism 3100 (Applied
Biosystems, USA). The number and size of the
amplicons were evaluated by the Gene Marker 1.3
software. The amplicons at polymorphic loci were
scored as presence (1) or absence (0) of an allele
and used to construct a binary matrix. These values
were statistically evaluated using UPGMA (Jaccard
coefficient) by the FreeTree programme (Hampl et
al. 2001) and a dendrogram was constructed by the
TreeView programme (Page 1996). Following values
were assessed for each SSR marker: diversity index
(DI), probability of identity (PI) and polymorphous
information content (PIC) (Russell et al. 1997).
RESULTS AND DISCUSSION
We tested the variability of microsatellite markers within the collection of pepper genetic resources.
Hort. Sci. (Prague), 36, 2009 (4): 127–132
Out of eight analyzed SSR markers three had a uniform spectrum (Hpms 1-1, Hpms 1-168, and Hpms
1-274) in all the analyzed pepper plants. In the other
microsatellites two to eight alleles were detected (total 28), i.e. average 3.5 alleles per locus (Table 2). The
size of amplicons ranged between 172 and 340 bp
(Table 3). The maximal difference from the average
size (Lee et al. 2004; Minamiyama et al. 2006) was
determined in the SSR marker Hpms 1-168 (+36 bp)
and Cams 163 (+46 bp). The highest number of alleles was detected in microsatellites Hpms 1-5 (8 alleles) and Hpms 2-21 (7 alleles). Minamiyama et
al. (2006) detected a high number of alleles in the
SSR markers Cams 163 (9 alleles) and Cams 647
(10 alleles) which, in our case, had a lower number
of alleles, i.e. Cams 647 (6 alleles) and Cams 163
(2 alleles). The obtained number of alleles per locus
is comparable with other authors who found average values of 2.9 (Minamiyama et al. 2006) and
3.0 (Kwon et al. 2007) (Table 2).
129
Fig. 1. Dendrogram of similarity of the analyzed pepper plants
130
Hort. Sci. (Prague), 36, 2009 (4): 127–132
The average DI (diversity index) value was
0.33 (0.00–0.74), average of PI (probability of identity) 0.55 (0.04–1.00) and for PIC (polymorphous
information content) average value was 0.32 (0.00 to
0.73) (Table 3). The average value of PIC was lower
than the value of 0.76 described by Lee et al. (2004)
when studying various members of the genus Capsicum. Minamiyama et al. (2006) quoted a similar
value of 0.46 in their studies of dihaploid pepper
lines (C. annuum). The low value of PIC implies a
higher level of genetic similarity within the analyzed pepper genotypes.
Within the analyzed accessions, alleles specific
for certain genotypes were detected, e.g. 296 bp
amplicon of Hpms 1-5 specific for the accession
Hatvani (No. 13) and in Hpms 2-21 the following genotype-specific sizes: Astrachanskij (No. 9)
– 296 bp; Japan Madarszen (No. 28) – 292 bp and
Japan Hontakka (No. 37) – 266 bp. Intragenotype
variability was detected for some markers; e.g. in
Japan Hontakka (No. 39) – 306 bp and 309 bp alleles (Hpms 1-5) were determined in individual
plants. In the same microsatellite marker we detected a unique 332 bp allele on one of the three
plants of the accession Astrachanskij 147 (No. 12)
which did not appear in any other of the remaining
122 analyzed plants.
Based on statistical evaluation we constructed
a similarity dendrogram of the analyzed pepper
genotypes (Jaccard coefficient) (Fig. 1). Four accessions were significantly (Hatvani (No. 13), Japan
Madarszen (No. 29, No. 30 and No. 31)) different
from the other 37 analyzed accessions. These four
accessions differed not only in their SSR markers
but also according to descriptive morphological
data (No. 29 – chilli pepper; Nos. 30 and 31 – spice
pepper). The distribution of the analyzed genotypes
in the dendrogram indicated a high level of similarity within some items of the same or similar name,
e.g. Kalocsai Furzer (Edes) (Nos. 3 and 4), Hatvani
and Hatvani Csemege (Nos. 15 and 16); Bogyiszloi
(No. 26) and Bogyiszloi Vastaghusu (No. 27). No
differences among these accessions were detected
even when evaluating morphological characters using the Upov classifier. Minimal differences were
observed when the Ipgri classifier was used for
the evaluations, i.e. in characteristics which could
be affected by the environment, e.g. different level
of nutrients in the soil. Taken together we can consider these samples as examples of duplicity within
the pepper genetic resources.
By contrast, other accessions within the studied collection can be considered as being able to
encompass genetically different material since we
Hort. Sci. (Prague), 36, 2009 (4): 127–132
detected variability of microsatellites in individual
plants within the presumed accessions. The highest variability was detected in the accession Astrachanskij (No. 7) as is documented by the position
of individual analyzed plants in the dendrogram. A
lower level of variability was observed also in accessions Astrachanskij (No. 10), Konservnyj Belyj
289 (No. 18) and Tetenyi (No. 32). The differences
detected at the molecular level could not be confirmed by morphological evaluation as all three
plants appeared as identical.
CONCLUSION
Distribution of the analyzed accessions in the
dendrogram implies a high level of similarity within some accessions and, in contrast, the presence
of genetically different material within other accessions of the same or similar name. Molecular data
were complemented with morphological measurements according to the descriptor list for the genus Capsicum. Taken together, the results show the
possibility of duplicities in the current collection of
genetic resources of red pepper.
References
BROWN A.H.D., 1989. Core collections: A practical approach to genetic resources management. Genome, 31:
818–824.
HAGHNAZARI A., SAMIMIFARD R., NAJAFI J., MARDI
M., 2005. Genetic diversity in pea (Pisum sativum L.) accessions detected by sequence tagged microsatellite markers.
Journal of Genetics and Breeding, 59: 145–152.
HAMPL V., PavlíČek A., Flegr J., 2001. Construction and
bootstrap analysis of DNA fingerprinting-based phylogenetic trees with a freeware program FreeTree: Application to
Trichomonad parasites. International Journal of Systematic
and Evolutionary Microbiology, 51: 731–735.
IPGRI, AVRDC, CATIE 1995. Descriptors for Capsicum (Capsicum spp.). International Plant Genetic Resources Institute,
Rome, Italy; Asian Vegetable Research and Development
Center, Taipei, Taiwan. Turrialba, Costa Rica, Centro Agronomico Tropical de Investigacion y Esenanza: 1–42.
KWON Y.S., MOON J.Y., YI S.I., BAE K.M., SON E.H.,
CHO I.H., KIM B.D., 2007. Comparative analysis of pepper (Capsicum annuum L.) varieties using morphological
characters, AFLP and SSR markers. Korean Journal of
Genetics, 29: 11–20.
LEE J.M., NAHM S.H., KIM Y.M., KIM D.D., 2004. Characterisation and molecular genetic mapping of microsatellite
loci in pepper. Theoretical and Applied Genetics, 108:
619–627.
131
LI M., ZHANG C., QIAN W., MENG J., 2007. Genetic diversity of Brassica species revealed by amplified fragment
length polymorphism and simple sequence repeat markers.
Horticulture, Environment, and Biotechnology, 48: 9–15.
MINAMIYAMA Y., TSURO M., HIRAI M., 2006. An SSRbased linkage map of Capsicum annuum. Molecular
Breeding, 18: 157–169.
Page R.D.M., 1996. TREEVIEW: An application to display
phylogenetic trees on personal computers. Computer Applications in the Biosciences, 12: 357–358.
RUSSELL J., FULLER J., YOUNG G., THOMAS B., TARAMINO G., MACAULAY M., WAUGH R., POWELL W.,
1997. Discriminating between barley genotypes using
microsatellite markers. Genome, 40: 442–450.
UPOV, 2006. International Union for the Protection of New
Varieties of Plants. Sweet Pepper, Hot Pepper, Paprika,
Chili: 1–47. Available at: http://www.upov.int/en/publications/tg-rom/tg076/tg_76_8.pdf
WANG R., LI Y., YANG L., LI L., FANG F., LI W., 2006. Analysis of genetic diversity based on SSR and morphological
markers among tomato cultivars. Journal of Tropical and
Subtropical Botany, 14: 120–125.
ZHANG L., LI H., WANG H., LI L., 2007. Genetic diversification of the Chinese wheat landrace Mazhamai as revealed
by morphological characteristics, seed storage proteins,
and microsatellite markers. Canadian Journal of Plant
Science, 87: 763–771.
Received for publication January 30, 2009
Accepted after corrections June 19, 2009
Polymorfizmus DNA genetických zdrojů papriky pomocí
mikrosatelitních markerů
Abstrakt: Genetická variabilita mezi 41 položkami papriky (Capsicum annuum L.) byla hodnocena pomocí
osmi mikrosatelitních markerů. Tři z těchto mikrosatelitních markerů (Hpms 1-1, Hpms 1-168 a Hpms 1-274)
měly uniformní spektrum u všech analyzovaných rostlin. Dvě až osm alel bylo detekováno ve zbývajících lokusech.
Celkem bylo detekováno 28 alel, což je v průměru 3,5 alely na jeden mikrosatelitní lokus. Nejvyšší počet alel byl
detekován pomocí primerů Hmps 1-5 (8 alel) a Hpms 2-21 (7 alel). Molekulární data byla doplněna o morfologický
popis podle klasifikátoru pro rod Capsicum. Dendrogram na základě našich genetických analýz naznačuje vyšší
stupeň podobnosti mezi některými položkami v kontrastu s jinými položkami se stejným označením. Výsledky
ukazují na možnost duplicit v rámci studované kolekce genových zdrojů papriky.
Klíčová slova: paprika; genetické zdroje; mikrosatelity; SSR; variabilita
Corresponding author:
Ing. Pavel Hanáček, Ph.D., Mendelova zemědělská a lesnická univerzita v Brně, Agronomická fakulta,
Ústav biologie rostlin, Zemědělská 1, 613 00 Brno, Česká republika
tel.: + 420 545 133 343, fax: + 420 545 133 025, e-mail: [email protected]
132
Hort. Sci. (Prague), 36, 2009 (4): 127–132
© Copyright 2026 Paperzz