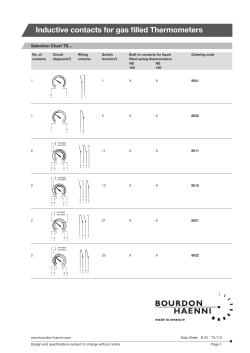
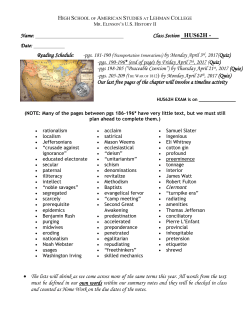
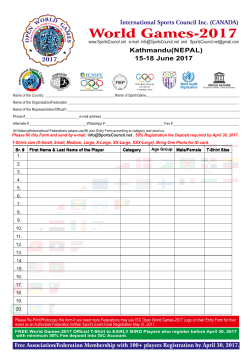
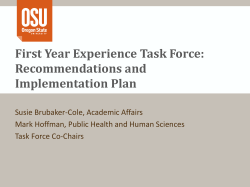
GP OOHSS GP Out-of-Hours Surveillance System: England 23 May 2017 In This Issue: Key Messages. Weekly summary. Year: 2017 Week: 20 Key messages Data to: 22 May 2017 There was nothing new to report during week 20. Total contacts. Syndromic indicators. Notes and caveats. Further information. Acknowledgements. Syndromic indicators at a glance: Number of contacts and percentage of Read coded contacts. Key indicator All OOH contacts, all causes Acute respiratory infection Influenza-like illness Bronchitis/bronchiolitis Difficulty breathing/wheeze/asthma Pharyngitis Gastroenteritis Diarrhoea Vomiting Myocardial infarction No. of contacts 168,767 10,539 63 124 1,430 73 3,434 868 1,171 750 % Week 20 % Week 19 13.38 0.08 0.16 1.82 0.09 4.36 1.10 1.49 0.95 12.78 0.09 0.15 2.03 0.10 4.37 1.09 1.49 0.97 Trend* *Trend: reports on the trend seen over previous weeks in the percentage of Read coded contacts. 1: Total out-of-hours contacts: 50,000 40,000 Number of contacts Daily total number of out-of-hours and unscheduled contacts and 7 day average (adjusted for bank holidays). 60,000 30,000 20,000 10,000 0 23/05/16 20/06/16 18/07/16 15/08/16 12/09/16 10/10/16 07/11/16 05/12/16 02/01/17 30/01/17 27/02/17 27/03/17 24/04/17 22/05/17 GP OOHSS 23 May 2017. Year: 2017 Week: 21 2: Acute Respiratory Infection daily contacts. 40 Shown as a percentage of the total contacts with a Read code and as a 7 day average*. 30 Percentage of Read coded contacts 35 25 20 15 10 5 0 23/05/16 20/06/16 18/07/16 15/08/16 12/09/16 10/10/16 07/11/16 05/12/16 02/01/17 30/01/17 27/02/17 27/03/17 24/04/17 22/05/17 Acute Respiratory Infection baseline 4.5 3: Influenza-like illness daily contacts. 4.0 3.5 Percentage of Read coded contacts Shown as a percentage of the total contacts with a Read code and as a 7 day average*. 7 day average (adjusted for bank holidays) 3.0 2.5 2.0 1.5 1.0 0.5 0.0 23/05/16 20/06/16 18/07/16 15/08/16 12/09/16 10/10/16 07/11/16 05/12/16 02/01/17 30/01/17 27/02/17 27/03/17 24/04/17 22/05/17 Influenza-like illness baseline 1.2 4: Bronchitis/ bronchiolitis daily contacts. 1.0 Percentage of Read coded contacts Shown as a percentage of the total contacts with a Read code and as a 7 day average*. 7 day average (adjusted for bank holidays) 0.8 0.6 0.4 0.2 *7-day moving average adjusted for bank holidays. 0.0 23/05/16 20/06/16 18/07/16 15/08/16 12/09/16 10/10/16 07/11/16 05/12/16 02/01/17 30/01/17 27/02/17 27/03/17 24/04/17 22/05/17 Bronchitis 7 day average (adjusted for bank holidays) baseline Page 2. GP OOHSS 23 May 2017. Year: 2017 Week: 21 5: Difficulty breathing/ wheeze/asthma daily contacts. 5.0 Percentage of Read coded contacts Shown as a percentage of the total contacts with a Read code and as a 7 day average*. 6.0 4.0 3.0 2.0 1.0 0.0 23/05/16 20/06/16 18/07/16 15/08/16 12/09/16 10/10/16 07/11/16 05/12/16 02/01/17 30/01/17 27/02/17 27/03/17 24/04/17 22/05/17 Difficulty Breathing/Wheeze/Asthma 6: Acute pharyngitis and persistent sore throat. 0.40 Shown as a percentage of the total contacts with a Read code and as a 7 day average*. 0.30 7 day average (adjusted for bank holidays) baseline Percentage of Read coded contacts 0.35 0.25 0.20 0.15 0.10 0.05 0.00 23/05/16 20/06/16 18/07/16 15/08/16 12/09/16 10/10/16 07/11/16 05/12/16 02/01/17 30/01/17 27/02/17 27/03/17 24/04/17 22/05/17 Pharyngitis 12 Shown as a percentage of the total contacts with a Read code and as a 7 day average*. 10 Percentage of Read coded contacts 7: Gastroenteritis daily contacts 7 day average (adjusted for bank holidays) baseline 8 6 4 2 *7-day moving average adjusted for bank holidays. 0 23/05/16 20/06/16 18/07/16 15/08/16 12/09/16 10/10/16 07/11/16 05/12/16 02/01/17 30/01/17 27/02/17 27/03/17 24/04/17 22/05/17 Gastroenteritis 7 day average (adjusted for bank holidays) baseline Page 3. GP OOHSS 23 May 2017. Year: 2017 Week: 21 16 7a: Gastroenteritis weekly contacts by age group. Percentage of Read coded contacts 14 12 10 8 6 4 2 0 22/05/16 19/06/16 17/07/16 14/08/16 11/09/16 09/10/16 06/11/16 04/12/16 01/01/17 29/01/17 26/02/17 26/03/17 23/04/17 21/05/17 <1yr 5-14yrs 15-24yrs 25-44yrs 45-64yrs 65-74yrs >=75yrs 4.0 8: Diarrhoea daily contacts. 3.5 3.0 Percentage of Read coded contacts Shown as a percentage of the total contacts with a Read code and as a 7 day average*. 1-4yrs 2.5 2.0 1.5 1.0 0.5 0.0 23/05/16 20/06/16 18/07/16 15/08/16 12/09/16 10/10/16 07/11/16 05/12/16 02/01/17 30/01/17 27/02/17 27/03/17 24/04/17 22/05/17 Diarrhoea 7 day average (adjusted for bank holidays) baseline 4.0 8a: Diarrhoea weekly contacts by age group. Percentage of Read coded contacts 3.5 3.0 2.5 2.0 1.5 1.0 0.5 *7-day moving average adjusted for bank holidays. 0.0 22/05/16 19/06/16 <1yr 17/07/16 14/08/16 1-4yrs 11/09/16 5-14yrs 09/10/16 06/11/16 15-24yrs 04/12/16 25-44yrs 01/01/17 29/01/17 45-64yrs 26/02/17 65-74yrs 26/03/17 23/04/17 21/05/17 >=75yrs Page 4. GP OOHSS 23 May 2017. Year: 2017 Week: 21 6 9: Vomiting daily contacts. 5 Percentage of Read coded contacts Shown as a percentage of the total contacts with a Read code and as a 7 day average*. 4 3 2 1 0 23/05/16 20/06/16 18/07/16 15/08/16 12/09/16 10/10/16 07/11/16 05/12/16 02/01/17 30/01/17 27/02/17 27/03/17 24/04/17 22/05/17 Vomiting 7 day average (adjusted for bank holidays) baseline 7 9a: Vomiting weekly contacts by age group. Percentage of Read coded contacts 6 5 4 3 2 1 0 22/05/16 19/06/16 17/07/16 14/08/16 11/09/16 09/10/16 06/11/16 04/12/16 01/01/17 29/01/17 26/02/17 26/03/17 23/04/17 21/05/17 <1yr 5-14yrs 15-24yrs 25-44yrs 45-64yrs 65-74yrs >=75yrs 3.0 10: Myocardial Infarction daily contacts. 2.5 Percentage of Read coded contacts Shown as a percentage of the total contacts with a Read code and as a 7 day average*. 1-4yrs 2.0 1.5 1.0 0.5 *7-day moving average adjusted for bank holidays. 0.0 23/05/16 20/06/16 18/07/16 15/08/16 12/09/16 10/10/16 07/11/16 05/12/16 02/01/17 30/01/17 27/02/17 27/03/17 24/04/17 22/05/17 Myocardial Infarction 7 day average (adjusted for bank holidays) baseline Page 5. GP OOHSS 23 May 2017. Notes and caveats: Year: 2017 Week: 21 Further information: This bulletin presents data from the Public Health England (PHE) GP Out -of-hours\Unscheduled Care Surveillance System (GP OOHSS). Fully anonymised data from GP out-of-hours (OOH) and unscheduled care service providers in England are being transferred to the PHE for analysis and interpretation by the PHE Real-time Syndromic Surveillance Team (ReSST). This system supplements existing PHE syndromic surveillance systems by monitoring data on general practitioner consultations outside of routine surgery opening times (evenings, weekends and bank holidays) and unplanned contacts within NHS primary care. The key indicators presented within this bulletin are derived by grouping selected Read coded consultations. GP OOH consultation data are analysed on a daily basis to identify national and regional trends. A statistical algorithm underpins each system, routinely identifying activity that has increased significantly or is statistically significantly high for the time of year. Results from these daily analyses are assessed by the ReSST, along with analysis by age group, and anything deemed of public health importance is alerted by the team. Baselines represent seasonally expected levels of activity and are constructed from historical data. Furthermore, they take into account any known substantial changes in data collection, population coverage or reporting practices. Baselines are refreshed using the latest data on a regular basis. The GP Out-of-Hours Surveillance System Bulletin can also be downloaded from the PHE Real-time Syndromic Surveillance website which also contains more information about syndromic surveillance: https://www.gov.uk/government/collections/syndromic-surveillance-systems-and-analyses Acknowledgements: We are grateful to Advanced Health and Care and the GP out-of-hours and unscheduled care service providers who have kindly agreed to participate in this system. PHE Out-of-Hours/Unscheduled Care Surveillance Contact ReSST: syndromic.surveillance @phe.gov.uk Produced by: PHE Real-time Syndromic Surveillance Team 6th Floor, 5 St Philip’s Place, Birmingham, B3 2PW Tel: 0344 225 3560 > Option 4 > Option 2 Fax: 0121 236 2215 Web: https://www.gov.uk/government/collections/syndromic -surveillance-systems-and Page 6. -analyses
© Copyright 2026 Paperzz