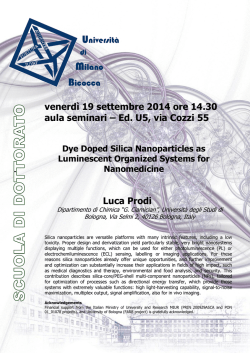
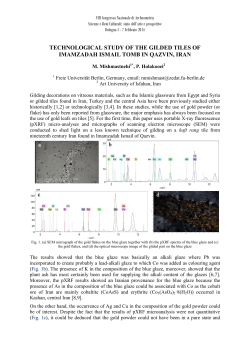
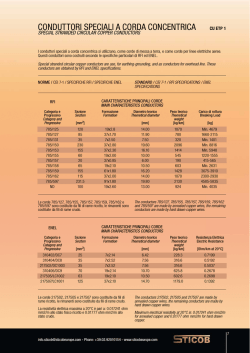
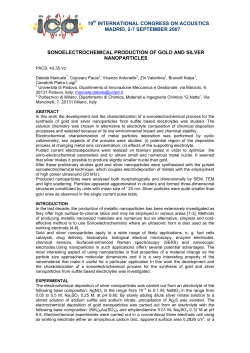
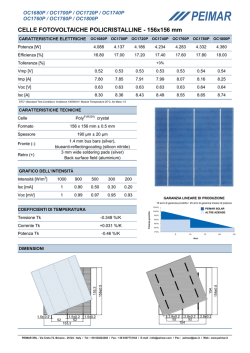
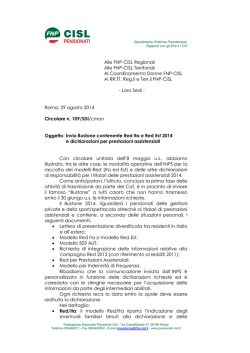
JOURNAL OF APPLIED PHYSICS VOLUME 93, NUMBER 12 15 JUNE 2003 Copper in glazes of Renaissance luster pottery: Nanoparticles, ions, and local environment S. Padovani, C. Sada, and P. Mazzoldi Dipartimento di Fisica, INFM, Università di Padova, Via Marzolo 8, 35131 Padova, Italy B. Brunetti,a) I. Borgia, and A. Sgamellotti Dipartimento di Chimica, INSTM, Università di Perugia, Via Elce di Sotto 8, 06123 Perugia, Italy A. Giulivi Dipartimento di Chimica, INSTM, Università di Perugia, Via Elce di Sotto 8, 06123 Perugia and Agenzia Polo Ceramico s.r.l., Via Granaroto 62, 48018 Faenza, Italy F. D’Acapito INFM, ESRF, GILDA-CRG, B.P. 220, 38043 Grenoble, France G. Battaglin Dipartimento di Chimica Fisica, INFM, Università di Venezia, Dorsoduro 2137, 30123 Venezia, Italy 共Received 6 November 2002; accepted 13 March 2003兲 Following the recent finding that luster decorations in glazes of historical pottery consist of copper and silver nanoparticles dispersed in a glassy medium, the glaze in-depth composition and distribution of copper nanoparticles, copper ions, and their local environment have been studied in original samples of gold and red luster. The study has been fully carried out by nondestructive techniques such as Rutherford backscattering spectrometry, ultraviolet and visible spectroscopy, x-ray fluorescence, and extended x-ray absorption fine structure 共EXAFS兲. Elemental analyses indicate that gold decorations are characterized by silver and copper, while red decorations by copper only. The color is determined mainly by metal nanoparticles. Specifically, silver nanoparticles determine the gold color, while the red color is determined by nanoparticles of copper. EXAFS measurements, carried out at the Cu K edge, indicate that in both gold and red luster copper is mostly the oxidized form (Cu⫹ and Cu2⫹ ) with a large prevalence of Cu⫹ . States and local environment of copper ions are similar to those found in copper–alkali ion-exchanged silicate glass samples. This strongly supports the view that luster formation is mediated by a copper– and silver–alkali ion exchange as a first step, followed by nucleation and growth of metal nanoparticles. © 2003 American Institute of Physics. 关DOI: 10.1063/1.1571965兴 I. INTRODUCTION Metal–glass nanocomposites, formed by nanometersized crystalline metal clusters embedded in a glass matrix, are characterized by specific optical and magnetic properties. In particular, due to the third order optical nonlinearities, they are of current interest in the development of glass-based devices for optoelectronics.1,2 It has been recently found that luster decorations, typical of the Medieval and Renaissance pottery of the Mediterranean basin, substantially consist of a metal–glass nanocomposite thin layer.3,4 Indeed, by scanning electron microscopy 共SEM兲 and transmission electron microscopy 共TEM兲 it has been shown that luster consists of a thin film composed of a heterogeneous distribution of silver and copper nanoparticles of sizes ranging from 5 to 100 nm. These decorations show peculiar optical properties, producing brilliant reflections of different colors, cangiant effects, and iridescence.5 Historically, luster was developed in Mesopotamia, during the IX century, and subsequently diffused throughout the a兲 Author to whom correspondence should be addressed; electronic mail:[email protected] 0021-8979/2003/93(12)/10058/6/$20.00 Mediterranean basin, together with the spread of the Islamic culture. It arrived in Spain during the XII century and was particularly developed in Paterna and Manises, near Valencia, during the XIV and XV centuries. From Spain, the luster technique arrived in the center of Italy, where it was exploited to produce the well known polychrome luster Renaissance pottery of Deruta and Gubbio.5 The origin of luster decoration technique is one of the most complex and fascinating issues of the ceramic history. Luster preparation is described by Cipriano Piccolpasso in the second book of I tre libri dell’arte del vasaio, 1557.6 The copper/silver deposition was obtained by putting a mixture of copper and silver salts and oxides, together with vinegar, ochre, and clay, on the surface of a previously glazed pottery. Then, the whole system was heated to about 600 °C in a reductive atmosphere, produced by the introduction of smoking substances in the kiln. In these conditions, metal ions were reduced to metal, which remained trapped within the first layer of the glaze.5 Surprisingly, the formation of nanoparticles is strongly analogous to that of the modern synthesis of metal–glass nanocomposites, consisting of ion implantation,1 ion exchange,7 sol–gel,8 or sputtering deposi- 10058 © 2003 American Institute of Physics Downloaded 31 May 2003 to 160.103.2.52. Redistribution subject to AIP license or copyright, see http://ojps.aip.org/japo/japcr.jsp Padovani et al. J. Appl. Phys., Vol. 93, No. 12, 15 June 2003 FIG. 1. 共Color兲 Samples of XVI century pottery from Deruta. The studies were performed on the red luster of sample D52 and on the gold luster of sample D78. tions of ions9 in a glass matrix, followed by annealing at 600 °C in a reductive atmosphere.10 In spite of the large historical documentation, only little scientific information on luster is available, both on relations composition–structure–optical properties and on the nanoparticle formation mechanism. Luster chromatic effects are expected to depend on the properties of the nanoparticle colloidal dispersion. Indeed, surface plasmon resonances 共SPRs兲 typical of silver and copper nanoparticle dispersions in a transparent medium have been observed for lusters of different colors.3,4,11 However, luster optical properties may also be influenced by the presence of ionic copper in the glaze because, when present in specific oxidation, it could modify the glaze refraction index or even contribute directly to its coloration.12 In addition, copper ions can play a relevant role in the luster formation mechanism. To investigate the presence of nanoparticles and of copper ions in the luster glaze and to determine copper ion states and their local order, a study has been performed on the original samples of Umbrian Renaissance luster pottery exclusively by nondestructive techniques. The measurements revealed that copper is present in both gold and red luster decorations. In gold luster, copper is practically only in the oxidized Cu⫹ and Cu2⫹ states; in red luster, copper is partially in the form of metal nanoparticles, but mostly in the form of Cu⫹ . II. EXPERIMENT Compositional, structural, and optical measurements were performed on two selected fragments of Umbrian Renaissance luster pottery where gold and red luster decorations were present. The shards, belonging to the Museo Regionale della Ceramica di Deruta, are shown in Fig. 1. The measurements were carried out on the red 共sample D52兲 and gold 共sample D78兲 decorations, indicated with white arrows in the picture. Compositional in-depth information on the first few m below the surface were obtained by Rutherford backscattering spectrometry 共RBS兲, using a 4 He⫹ beam at an energy of 2.2 MeV, at Istituto Nazionale di Fisica Nucleare Laboratory of Legnaro 共Padova, Italy兲. The in-depth profiles were obtained from the results of RBS spectra simulation, by assuming that the density of the glassy matrix is 2.5 g/cm3 . Optical absorption spectra were recorded in a wavelength range from 250 to 800 nm, by using a Cary 5 ultra- 10059 violet and visible 共UV-VIS兲 dual-beam spectrophotometer in reflectance mode. X-ray fluorescence 共XRF兲 measurements were performed by an energy dispersive spectrometer. Extended x-ray absorption fine structure measurements 共EXAFS兲 at the Cu K edge were performed at the European Synchrotron Radiation Facility on the Italian beamline GILDA. The sagittally focusing monochromator, used in the so-called dynamical focusing mode13 was equipped with two Si(311) crystals. The flux on the sample was on the order of 1⫻1010 photons s⫺1 on a 2 mm spot size. Due to the low Cu concentration in the samples, the x-ray absorption spectra were collected in fluorescence mode, by a high-purity 13element Ge detector. Absorption spectra of a Cu metallic foil, and of CuO and Cu2 O crystalline powders, were also measured at liquid nitrogen temperature in transmission mode, in order to have reference spectra. Data processing was carried out by Fourier filtering and multiparameter fit in the R space. Theoretical scattering amplitude and phase were generated by the FEFF8 code.14 The multielectron amplitude reduction factor S 20 in standard EXAFS formula was fixed to the value obtained from the Cu2 O EXAFS spectrum (S 20 ⫽0.7⫾0.1). III. RESULTS Previous SEM and TEM micrographs on Umbrian Renaissance glazed pottery indicated that glaze is generally of the thickness of about 100 m and is characterized by the average composition: 15–35 wt. % PbO, 65– 45 wt. % SiO2 , 2–5 wt. % Al2 O3 , 3–7 wt. % SnO2 , and 10–14 wt. % alkali.3,4 The composition of the glaze, in the case of the two decorations of the present study, is well within the values mentioned above. In both cases, RBS measurements of the present work put in evidence the lack of lead in the external surface. In fact, RBS measurements indicate that the lead concentration, initially absent for a layer of about 60 nm depth, gradually increases moving into the glaze, finally achieving the typical value of the bulk glaze mentioned above. In particular, in the case of gold luster, the composition of the bulk glaze is reached at about 100 nm, while in the case of red luster at about 200 nm. This means that, in the case of gold luster, the variation in the in-depth lead concentration occurs more abruptly. In the gold luster, for a depth range from 60–120 nm, silver appears to be diffused within the glaze, with an average concentration of approximately 20 wt. %. The composition of the glaze in this layer also includes a small quantity of copper 共1%–3%兲 as evident by additional XRF measurements. In the red luster, RBS measurements indicate that the in-depth composition is substantially different from that of gold luster. Elemental copper is present unambiguously in a more extended depth, from 60 to 240 nm from the external surface, with an average concentration of about 8 wt. %. Therefore, copper in red luster is less concentrated than in the gold one but is more deeply penetrated into the glaze. Another difference is that in this layer no silver is present, as found by RBS and confirmed by XRF measurements. Downloaded 31 May 2003 to 160.103.2.52. Redistribution subject to AIP license or copyright, see http://ojps.aip.org/japo/japcr.jsp 10060 Padovani et al. J. Appl. Phys., Vol. 93, No. 12, 15 June 2003 FIG. 2. Optical absorption spectra for red and gold luster. UV–VIS spectroscopy measurements revealed the presence of metal nanoparticles both in gold and red lusters. The nanoparticle dispersions were nondestructively identified through the observation of the typical SPRs of silver and copper nanoparticles.2– 4,11 The luster optical absorption spectra of our samples are shown in Fig. 2. The gold luster spectrum exhibits a sharp band 共D兲 at 424 nm that corresponds to the SPR of silver.2 The red luster spectrum exhibits a band at about 560–570 nm 共B兲 which can be easily attributed to the presence of copper nanoparticles, being the SPR peak position of copper in silica is at about 570 nm.2 In the case of red luster, it is not straightforward to associate the broadbands at about 430 共A兲 and 680 共C兲 nm to specific structural properties of the decoration. The feature at 430 nm cannot be ascribed to silver, because of the lack of silver in this decoration. The feature at 680 nm could be tentatively assigned to the presence of Cu⫹ ions in the glaze matrix. In fact, it has been suggested that while pure Cu2 O clusters exhibit no absorption bands in the visible region, Cu⫺Cu2 O core–shell structures can lead to absorption at wavelengths higher than 600 nm.15 A quantitative fitting of the absorption spectra of Fig. 2 is a difficult task. In the framework of the Maxwell–Garnett theory,16,17 the dipolar absorption of spherical clusters of radii R, occupying a relative volume fraction p in a nonabsorbing medium of dielectric constant m , is determined by the size-dependent metal dielectric function ( , R) ⫽ 1 ( , R)⫹i 2 ( , R). In particular, the absorption coefficient ␣ ( , p, R) is given by ␣ 共 , p, R 兲 ⫽9 p ⫻ 3/2 c m 2共 , R 兲 关 1 共 , R 兲 ⫹2 m 兴 2 ⫹ 2 共 , R 兲 2 . From this expression, it is obvious that a variation in either ( , R) or m induces a shift in the SPRs of the system.2 Moreover, the absorption spectrum depends linearly on the volume fraction of the clusters in the dielectric host. Therefore, it is not possible to correlate univocally the spectrum features with a large number of variables, such as nature, relative composition, size distribution, and volumetric fraction of the metal nanoparticles. In addition, the correlation FIG. 3. Cu K-edge absorption coefficient spectra for the red and gold luster recorded in fluorescence mode 共dotted line兲 and compared to that of copper in glass with state of valence (1⫹) and (2⫹) and with metallic copper, respectively, indicated as Cu(⫹), Cu(2⫹), and Cu(0). Together with the experimental data the simulation of luster spectra are reported 共dashed lines兲. The simulation is made by a linear combination of Cu(⫹) and Cu(2⫹) spectra for the gold luster and of Cu(⫹) and metallic copper one for the red one. between the optical and structural features of the samples is even more complicated by the possible presence of nonreduced silver and copper that may locally further modify the refractive index of the medium. For these reasons, no fitting of the spectra have been attempted. It has already been demonstrated that the exploitation of synchrotron radiation techniques allow for obtaining much important information on glass–metal nanostructured composites.18,19 Moreover, it is well established that EXAFS spectroscopy can provide information, not available with diffraction techniques, about oxidized phases or atom clusters dispersed in the matrix.20 Therefore, in order to study possible nonreduced copper both in gold and red luster, EXAFS measurements have been carried out at Cu K edge 共8979 eV兲 and a comparison has been carried out for the two decorations. An analogous study will be carried out on silver at Ag K edge, in the next future. In Fig. 3, the absorption coefficient spectra measured for both gold and red luster are reported, together with the spectra of copper ions in glass with different oxidation state, Cu⫹ and Cu2⫹ . Together with the experimental data the simulation of the luster spectra are reported 共dashed lines兲. Figure 4 shows their k 3 -weighted Fourier transform moduli and the results of the two-shell fitting procedure are reported in Table I. For the gold luster, the results indicate that, within the detection limit of the method, no relevant quantity of copper is present in the metallic phase. As shown in Table I, the copper–oxygen first shell distance (1.88 Å) and coordination number 共2.6兲 are close but not identical to those of Cu2 O (1.85 Å and 2), these values appear to be shifted towards the higher CuO values (1.95 Å and 4). In order to quantitatively determine the relative amounts of the two possible valence states for Cu in the glaze, the x-ray absorption near edge structure region has been simulated as a linear combination of those of two models for Cu⫹ and Cu2⫹ in glass.20 The same method has been yet applied to the case of Downloaded 31 May 2003 to 160.103.2.52. Redistribution subject to AIP license or copyright, see http://ojps.aip.org/japo/japcr.jsp Padovani et al. J. Appl. Phys., Vol. 93, No. 12, 15 June 2003 FIG. 4. Moduli of Fourier transform for red and gold luster spectra 关共square兲 experimental, 共solid line兲 fit兴. Transformations were performed in the interval k⫽2.6⫺9 Å ⫺1 with a k 3 weight. Cu in glass.18 In this way it is possible to estimate that 40% of copper is in the oxidation state Cu⫹ , while the remaining 60% is in the state Cu2⫹ 共see Fig. 3兲. For the red luster, the fitting results show that copper atoms are mainly in the Cu⫹ oxidized state and, in a minor quantity, in the Cu metallic phase. In this case, by simulating the spectrum with a linear combination of the absorption coefficient of metallic copper and Cu⫹ in glass,18,20 we estimate that 80% of copper is in the Cu⫹ form, while the remaining 20% is in the metallic phase 共see Fig. 3兲. As shown in Table I, copper coordinates oxygen atoms at 1.86 Å which is, inside the experimental error, the interatomic distance for the first shell of Cu2 O. The low coordination number 共1.3 instead of 2, in Cu2 O) can be explained taking into account that part of the copper atoms which are in the reduced metallic phase. In the second shell, Cu coordinates other copper atoms at 2.51 Å, a distance that is shorter than that of bulk copper (2.55 Å) due to the nanometric dimension of the particles.21 IV. DISCUSSION As shown by RBS measurements, in both cases of gold and red luster, silver and copper begin to be present at a depth of about 60 nm below the external surface of the glaze. 10061 This finding is in agreement with previous observations by TEM indicating that the luster metallic layer is usually covered by 50–100 nm of pure glaze.1 A significant property of this first glaze layer is the lack of lead. This is in contrast to the composition of the bulk glaze, where Pb is one of the most relevant elements, usually between 15% and 35% wt.3,4 The absence of lead in the more external layer, and its gradual increase moving towards the depth, seems to be a general case for tin-opacified leadglazed luster pottery, as confirmed by preliminary x-ray photoelectron spectroscopy measurements on several other samples.22 However, at present, it is not possible to establish if the observed low lead concentration at the external surface is to be attributed to the luster deposition process or simply to weathering. UV–VIS spectra indicate that, at least as a first instance, the luster color depends on the relative quantities of copper/ silver nanoparticles. Indeed, UV–VIS spectra of codoped Cu/Ag nanoparticle glasses are known to show spectra where both Ag SPR and Cu SPR are present, with relative intensities according to their fraction in the dielectric host.23,24 Typical silver nanoparticle dispersions show SPR characterized by a very pronounced peak at 400– 420 nm, while those of copper show a less evident feature consisting of a weak shoulder around 570 nm. Therefore, in the case of gold luster, the clear signal of Ag SPR at about 420 nm and the absence of evident Cu SPR at 570 nm can be considered as an indication of a significant presence of silver nanoparticles, accompanied by the absence or negligible quantity of nanoparticles of copper. Conversely, the red color in luster is definitely determined by the copper nanoparticles, as indicated by the well evident copper SPR at 570 nm, without any presence of silver. These results are confirmed by numerous UV–VIS spectra recorded on analogous samples. In spite of the complex nature of the nanoparticle formation mechanism, it has been recently suggested that luster formation consists reasonably of a first step where an ion exchange occurs between the alkali ions present in the glaze and the silver and copper ions present in the mixture of the luster historical recipe.4 The ion penetration into the glaze matrix is followed by the reduction to silver and copper nanoparticles, produced by the reductive atmosphere created by the introduction in the kiln of smoking organic substances, at about 600 °C. After the first nucleation, the crystal growth can be regarded as a spontaneous process due to the TABLE I. Interatomic distance R, coordination number N, and Debye–Waller factor 2 resulting from the EXAFS analysis. For the standards, N is fixed to the crystallographic values, while R and 2 are derived from the fitting procedure. Cu–O Cu–Cu R (Å) N 2 (10⫺4 Å 2 ) R (Å) N 2 (10⫺4 Å 2 ) Red luster Gold luster CuO 1.86⫾0.02 1.88⫾0.02 1.95⫾0.02 1.3⫾0.3 2.6⫾0.4 4 34⫾24 57⫾9 29⫾12 Cu2 O Cu met 1.85⫾0.02 — 2 — 16⫾12 — 2.51⫾0.03 — 2.89⫾0.02 3.07⫾0.02 3.04⫾0.03 2.55⫾0.02 1.6⫾0.9 — 4 4 12 12 121⫾50 — 35⫾19 58⫾37 106⫾57 40⫾10 Downloaded 31 May 2003 to 160.103.2.52. Redistribution subject to AIP license or copyright, see http://ojps.aip.org/japo/japcr.jsp 10062 Padovani et al. J. Appl. Phys., Vol. 93, No. 12, 15 June 2003 supersaturation of the elemental concentrations in the region where clustering occurs.25 The reliability of this mechanism is based on the consideration that silver– and copper–alkali ion exchange is known to occur efficiently at the surfaces of glasses immersed in a molten salt mixture.26 –30 In addition, Ag⫹ and Cu⫹ ionimplanted or ion-exchanged glasses, at 600 °C in a reductive atmosphere (5% H2 in N2 ), are known to easily produce metal nanoparticles.31 The results of the present study confirm a general mechanism involving an ion exchange followed by an annealing process. In fact the luster is characterized by an external layer of metal nanoparticles, strongly evident through the spectroscopic SPRs, but also by a large quantity of copper ions 共and presumably also silver ions兲, coordinated to the oxygen atoms of the silicate matrix. A remarkable observation is that the copper ions dispersed in the glaze are mostly in the Cu⫹ state, both for gold and red luster. This finding could be attributed to the fact that luster pottery is fired in a reductive atmosphere. This is expected to decrease the quantity of Cu2⫹ ions possibly present. However, the large dominance of Cu⫹ can be attributed to specific properties of the ion exchange. Recent experimental studies on ion exchange between soda–lime glasses and salts containing Cu⫹ or Cu2⫹ ions show that Cu⫹ is mainly exchanged with Na⫹ , with a relative quantity of exchanged Cu2⫹ ions ranging from 30%, in the most favorable case, to less than 10%.28 In addition, it is known that the substrate composition can influence the equilibrium between the different copper oxidation states.27,32 Therefore, copper–alkali ion exchange has also been studied for glass substrates containing both Na⫹ and K⫹ ions. In this case, the ion exchange was again found to be mainly governed by Cu⫹ exchange process, both with Na⫹ and K⫹ , although a direct exchange of Cu2⫹ with two alkali ions cannot be completely neglected.27 From the point of view of the ion chemical environment, EXAFS studies carried out on copper–alkali ion exchange with soda–lime glasses in different conditions, have shown that generally the exchanged Cu⫹ ions are bound with two or three O atoms in the first shell with a bond length of 1.85 ⫾0.04 Å independent of the substrate and preparation details. Substantially, it appears that Cu⫹ ions are all strongly bound to nonbridging oxygen atoms of the glassy network with a bond distance similar to that of Cu2 O oxide. A comparison of these data with those obtained by the present EXAFS study on gold and red luster reveals strong analogies. Copper in gold luster was found to be coordinated with 2.6 oxygen atoms, with a mean bond length of about 1.88⫾0.02 Å, which is very close to that of Cu2 O (1.85 ⫾0.02 Å). This is a significant indication that copper ions are strongly bound to the nonbridging oxygen atoms of the glaze matrix, as in the case of ion-exchanged glasses. An analogous situation is found in the case of red luster where the Cu–O bond distance (1.86⫾0.02 Å) is practically identical to that of Cu2 O, with a lower average coordination number due to the significant formation of metallic copper nanoparticles. Substantially, the analogy of the copper state and local environment in luster glazes and ion exchanged glasses constitute a good additional support to the view that luster formation is mediated by an ion exchange as a first step. Being the Cu–O bond length is significantly lower than the measured Na–O distance in glass (2.3 Å), 33 the Cu⫹ ⫺Na⫹ exchange leads to a local structural rearrangement of the glaze due to both the differences in the ionic radii and in the polarizability of Cu⫹ compared to Na⫹ ions. A similar rearrangement is present in the glaze matrix of luster. It is known that structural rearrangement of the glaze matrix in copper–alkali ion exchange can be accompanied by a local modification of the refractive index.27 Although on the basis of the present results it is not possible to quantify this phenomenon in the luster glazes, the local modification of the glassy host could indeed influence the luster optical properties. V. CONCLUSION In conclusion, in gold luster, elemental silver and copper are present at concentrations of ⬃20 and 1–3 wt. %, respectively, distributed within a thin layer from 60–120 nm depth. Metal nanoparticles are practically made up of silver only, being copper mostly or exclusively as Cu⫹ and Cu2⫹ ions. In the case of red luster, elemental copper is present at about 8 wt. % distributed within a wider layer from 60 to 180 nm, with no silver. Nanoparticles of copper are present. However, only a minor fraction of copper is in the reduced metallic form (⬃20%), being mostly copper in the form of Cu⫹ surrounded by the nonbonding oxygen of the glaze matrix. The gold and red colors can be attributed mainly to the silver and copper nanoparticles, respectively. The fact that in both gold and red luster, copper is significantly present in oxidized forms explains the failure of previous attempts, carried out by XRF or inductively coupled plasma atomic emission spectroscopy, to put in relation the elemental copper/ silver ratio with the luster color. The chromatic effects are determined only by the fraction of metal ions reduced to nanoparticles. States and local environment of Cu ions are similar to those found in copper–alkali ion-exchanged silicate glasses. This finding strongly supports the view that luster formation is mediated by a copper– and silver–alkali ion exchange as a first step, followed by nucleation and growth of metal nanoparticles. In red luster, characterized by a large quantity of Cu⫹ , the higher polarizability and the smaller ionic radii of the exchanged Cu⫹ ions compared to that of the substituted alkali are responsible of a local structural rearrangement of the glaze matrix. The local modification could locally modify the refraction index of the glassy host, therefore influencing the luster optical properties. ACKNOWLEDGMENTS The work has been developed within the activities of the PARNASO Project No. T2 4892, coordinated by the Agenzia Polo Ceramico di Faenza and of the MIUR Center of Excellence on ‘‘Advanced scientific methodologies applied to ar- Downloaded 31 May 2003 to 160.103.2.52. Redistribution subject to AIP license or copyright, see http://ojps.aip.org/japo/japcr.jsp Padovani et al. J. Appl. Phys., Vol. 93, No. 12, 15 June 2003 chaeology and art-historical artefacts’’ of the University of Perugia. A partial support of CNR 共Progetto Finalizzato Beni Culturali and Agenzia 2000兲 is acknowledged. The authors wish to thank M. Vendrell, J. Molera, and J. Perez for helpful discussions. The help offered by the Museo Regionale della Ceramica di Deruta through M. Mastice and G.Busti is also acknowledged. Special thanks go to E. Pantos, for his contageous enthusiasm and encouragement, and to G. Bottaro and C. Miliani for their help in the experimental work and discussions. 1 F. Gonella and P. Mazzoldi, in Handbook of Nanostructured Materials and Nanotechnology, Vol. 4, edited by H. S. Nalwa 共Academic, San Diego, 2000兲, pp. 81–158. 2 U. Kreibig and M. Vollmer, Optical Properties of Metal Cluster 共Springer, Berlin, 1995兲. 3 J. Pérez-Arantegui et al., J. Am. Ceram. Soc. 84, 442 共2001兲. 4 I. Borgia, B. Brunetti, I. Mariani, A. Sgamellotti, F. Cariati, P. Fermo, M. Mellini, and C. Viti, Appl. Surf. Sci. 185, 206 共2002兲. 5 A. Caiger-Smith, Luster Pottery. Technique, Tradition and Innovation in Islam and the Western World 共Faber & Faber, London, UK, 1985兲. 6 C. Piccolpasso, I Tre Libri dell’Arte del Vasaio, 1557 共Edizioni all’Insegna del Giglio, Firenze, Italy, 1976兲. 7 F. Garrido, F. Caccavale, F. Gonella, and A. Quaranta, Pure Appl. Opt. 4, 771 共1995兲. 8 G. De, G. Mattei, P. Mazzoldi, C. Sada, G. Battaglin, and A. Quaranta, Chem. Mater. 12, 2157 共2000兲. 9 S. Padovani et al., Eur. Phys. J. B 25, 11 共2002兲. 10 F. Gonella, G. Mattei, P. Mazzoldi, C. Sada, G. Battaglin, and E. Cattaruzza, Appl. Phys. Lett. 75, 55 共1999兲. 11 G. Mie, Ann. Phys. 共Leipzig兲 25, 377 共1908兲. 12 C. R. Bamford, Color Generation and Control in Glass 共Elsevier, Amsterdam, The Netherlands, 1977兲. 13 S. Pascarelli, F. Boscherini, F. D’Acapito, J. Hardy, C. Meneghini, and S. Mobilio, J. Synchrotron Radiat. 3, 147 共1996兲. 10063 14 A. L. Ankudinov, B. Ravel, J. J. Rehr, and S. D. Conradson, Phys. Rev. B 58, 7565 共1998兲. 15 G. Battaglin et al., Nucl. Instrum. Methods Phys. Res. B 175–177, 410 共2001兲. 16 J. C. Maxwell-Garnett, Philos. Trans. R. Soc. London, Ser. A 203, 385 共1904兲. 17 J. C. Maxwell-Garnett, Philos. Trans. R. Soc. London, Ser. A 205, 385 共1906兲. 18 F. D’Acapito, S. Mobilio, G. Battaglin, E. Cattaruzza, F. Gonella, F. Caccavale, P. Mazzoldi, and J. Regnard, J. Appl. Phys. 87, 1819 共2000兲. 19 F. Gonella et al., J. Non-Cryst. Solids 280, 241 共2001兲. 20 F. D’Acapito, S. Mobilio, J. R. Regnard, E. Cattaruzza, F. Gonella, and P. Mazzoldi, J. Non-Cryst. Solids 232–234, 364 共1998兲. 21 P. A. Montano, G. K. Shenoy, E. E. Alp, W. Schulze, and J. Urban, Phys. Rev. Lett. 56, 2076 共1986兲. 22 R. Bertoncello and A. Giulivi 共unpublished results兲. 23 R. H. Magruder III, D. H. Osborne Jr., and R. A. Zuhr, J. Non-Cryst. Solids 176, 299 共1994兲. 24 G. De, M. Catalano, G. Battaglin, F. Caccavale, F. Gonella, P. Mazzoldi, and R. F. Haglund, Appl. Phys. Lett. 68, 3820 共1996兲. 25 A. Miotello, G. De Marchi, G. Mattei, P. Mazzoldi, and A. Quaranta, Appl. Phys. A: Mater. Sci. Process. 67, 527 共1998兲; 70, 415 共2000兲. 26 F. Gonella, Appl. Phys. Lett. 69, 314 共1996兲. 27 F. Gonella, F. Caccavale, L. D. Bogomolova, F. D’Acapito, and A. Quaranta, J. Appl. Phys. 83, 1200 共1998兲. 28 F. D’Acapito, S. Colonna, S. Mobilio, F. Gonella, E. Cattaruzza, and P. Mazzoldi, Appl. Phys. Lett. 71, 2611 共1997兲. 29 E. Borsella, E. Cattaruzza, G. De Marchi, F. Gonella, G. Mattei, P. Mazzoldi, A. Quaranta, G. Battaglin, and R. Polloni, J. Non-Cryst. Solids 245, 122 共1999兲. 30 F. Gonella, Nucl. Instrum. Methods Phys. Res. B 166–167, 831 共2000兲. 31 G. De, M. Gusso, L. Tapfer, M. Catalano, F. Gonella, G. Mattei, P. Mazzoldi, and G. Battaglin, J. Appl. Phys. 80, 6734 共1996兲. 32 S. Sakka, K. Kamiya, and K. Kato, J. Non-Cryst. Solids 52, 77 共1982兲. 33 S. N. Houde-Walter, J. M. Inman, A. J. Dent, and G. N. Greaves, J. Phys. Chem. 97, 9330 共1993兲. Downloaded 31 May 2003 to 160.103.2.52. Redistribution subject to AIP license or copyright, see http://ojps.aip.org/japo/japcr.jsp
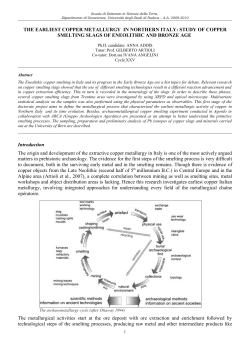
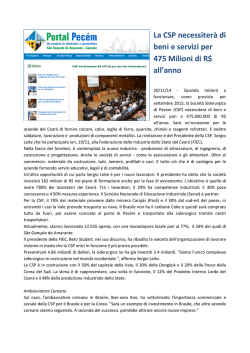
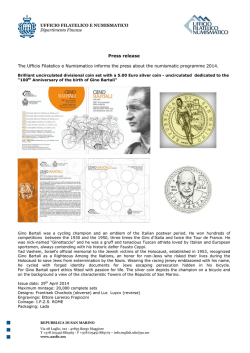
© Copyright 2026 Paperzz