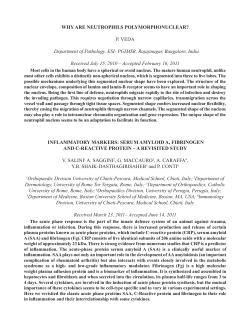
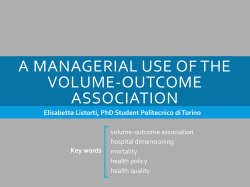
JBUON 2015; 20(2): 443-451
ISSN: 1107-0625, online ISSN: 2241-6293 • www.jbuon.com
E-mail: [email protected]
ORIGINAL ARTICLE
Quality of life in colorectal cancer patients during
chemotherapy in the era of monoclonal antibody therapies
Fatih Teker, Guzin Demirag, Dilek Erdem, Yasemin Kemal, Idris Yucel
19 Mayis University Medical Faculty, Department of Medical Oncology Samsun, Turkey
Summary
Purpose: Colorectal cancer (CRC) survivors are currently
living longer due to better therapies but they also need to
maintain their quality of life (QoL). QoL is increasingly
being used as primary outcome measure in clinical studies. This study was designed to gain knowledge about QoL
during chemotherapy across different lines and different
regimens.
Methods: The study comprised 101 CRC out patients receiving chemotherapy who completed the EORTC QLQ-C30
questionnaire. The Shapiro-Wilk, Kruskal-Wallis, and
Mann-Whitney U tests were used for statistical analyses.
Results: The demographics of the patients were evaluated
for QoL. Prior surgery, prior radiotherapy, working status,
stage, comorbidity and sex had no effect on global health
status in CRC patients, although some other demographics
such as education, monthly income, age and type of chemotherapy regimen did have an effect on global health status.
Role functioning was worse in older than in younger ones
(p<0.05). Adjuvant chemotherapy did not affect the QoL
scores negatively but palliative chemotherapy negatively
affected the cognitive function, appetite loss and nausea/
vomiting scores (p<0.05). According to chemotherapy regimen, the best QoL was observed with adjuvant FUFA regimen. In the palliative setting FOLFOX/Bevacizumab was
associated with the best QoL scores whereas FOLFIRI/Cetuximab were associated with the worst QoL scores.
Conclusions: Palliative chemotherapy maintained
irrespective of the chemotherapy line in metastatic
(mCRC) patients. Some demographics affect QoL
different chemotherapy regimens showed different
scores.
QoL
CRC
and
QoL
Key words: chemotherapy, colorectal cancer, quality of
life, EORTC QoL C-30 Questionnaire
Introduction
Cancer is a significant health problem which
affects the QoL. Improving QoL is as important
as survival prolongation. In the last 10 years,
with the development of new anticancer drugs, it
has become generally possible to prolong overall survival and more patients receive multiple
treatment lines. Patients require not only chemotherapy administration, but they also need maintaining their QoL. The only effective treatment to
improve QoL for mCRC is chemotherapy. Patients
receiving different chemotherapy regimens and
lines.
In CRC, many drugs are being used for therapy. Drugs are divided into two groups: cytotoxic drugs and biological agents. In CRC these two
groups are usually combined in mCRC and most
patients are offered second and third line therapies when tumor progression or severe toxicity
occurred with previous therapy.
Quality of Life
According to the World Health Organization
(WHO), definition of QoL is “An individual’s perception of life, values, objectives, standards, and
Correspondence to: Fatih Teker, MD. 19 Mayis University Medical Faculty, Department of Medical Oncology Samsun, Turkey.
Tel: +90 3623121919(2072), Fax: +90 3624576091, E-mail: [email protected]
Received: 24/09/2014; Accepted: 25/10/2014
444
Quality of life in colorectal cancer patients
Table 1. Scoring the QLQ-C30 version 3.0
Scale
Item
Version 3.0
Range
Item numbers
2
6
29,3
Number of items
Global health status/QoL
Global health status / QoL (revised)
QL2
Functional scales
Physical functioning
PF2
5
3
1 to 5
Role functioning
RF2
2
3
6,7
Emotional functioning
EF
4
3
21 to 24
Cognitive functioning
CF
2
3
20,25
Social functioning
Symptom scales/ Items
Fatigue
FA
3
3
10,12,18
Nausea and vomiting
NV
2
3
14,15
Pain
PA
2
3
9,19
Dyspnoa
DY
1
3
8
Insomnia
SL
1
3
11
Appetite loss
AP
1
3
13
Constipation
CO
1
3
16
Diarrhoea
DI
1
3
17
Financial difficulties
FI
1
3
28
interests in the framework of culture”. Cancer
patients experience problems such as “dyspnea,
cough, hemoptysis, pain, fatigue, insomnia, loss
of appetite, nausea, vomiting, diarrhea, constipation, weight loss, changes in urinary habits, anxiety, fear, depression, changes in body image, and
impaired family and social relationships”, all of
which have adverse impact on QoL [1] . Chemotherapy causes side effects and toxicities on patients’ emotional, physical, and spiritual well-being, whereas patients undergoing chemotherapy
experience positive improvements in their QoL
with respect to the chemotherapy regimen [2].
QoL can be assessed using more than 50 different instruments [3], most of which have been
evaluated for reliability and validity for different
nationalities [4]. The EORTC-QLQ-C30 was developed specifically for cancer patients and is a widely-used reliable instrument to measure QoL. QoL
assessments studies may help to notice the effects
of disease, different chemotherapy regimens and
morbidities [2].
The aim of this study was to evaluate the QoL
in CRC patients undergoing chemotherapy and to
JBUON 2015; 20(2): 444
explore the relationships between QoL and patient
characteristics (age, gender, disease stage, comorbidities etc) and to evaluate the relationship of
QoL with different chemotherapy regimens.
Methods
Ethics statement
This research was approved by the Ethics Committee of 19 Mayis University, and informed oral consent
was obtained from all participants prior to completion
of the questionnaires.
Patients
This study was performed in the chemotherapy
units of two tertiary referral hospitals. If the following
criteria were met, patients were invited to participate:
1.
2.
3.
4.
CRC at any stage
ECOG performance status 0-2
Age 18 years or older
Received chemotherapy for at least 3 months
Patients who completed the questionnaire were
Quality of life in colorectal cancer patients
Table 2. Clinical and therapy characteristics (N=101)
Patients,
N
%
Colon
65
64.3
Rectum
36
35.6
0
0
445
Instruments
II
9
8.9
III
20
19.8
IV
72
71.2
Yes
70
69.3
No
31
30.6
The standardized EORTC QLQ-C30 questionnaire
was used to evaluate QoL in the current study. The QLQ
C-30 includes 30 items that are divided into 3 main
categories: global health status scale/QoL, functional scales and symptom scales (Table 1). A high score
of QoL and a high score of functional scales show a
good level, whereas a high score of symptom scale represents bad level. The questionnaire also contains 12
questions about sociodemographic features (gender,
age, education, employment status, perceived income
status) and the illness of the patient (diagnosis of cancer, stage of cancer, prior surgery, prior radiotherapy,
anticancer therapy name and line). After the questionnaires were completed, they were checked to ensure
that they had been fully completed.
Yes
21
20.8
Statistics
No
80
79.2
Adjuvant
28
28
Palliative
73
74
FUFA
12
12
FOLFOX+Cetuximab
15
15
FOLFIRI+Bevacizumab
28
28
FOLFOX
29
29
FOLFIRI+Cetuximab
9
9
FOLFOX+Bevacizumab
8
8
Yes
44
44
Power analysis was performed before starting
the study and the minimum sample size required was
found to be 100 to evaluate possible significant differences. Statistical analyses were performed using SPSS
software package, version 20. The questionnaire points
were calculated according to the EORTC QLQ-C30 Scoring Manual. Compliance with the normal distribution
of continuous variables was examined with the Shapiro-Wilk test. For comparison of normal distribution of
the variables in 3 or more groups, the Kruskal-Wallis
test was used and for comparison of two groups the
Mann-Whitney U test was used. A p value less than
0.05 was accepted as significant in all the statistical
analyses.
No
57
57
Characteristics
Primary
Stage
I
Prior surgery
Prior radiotherapy
Chemotherapy setting
Chemotherapy protocol
Comorbidity
Results
Patient characteristics
included in the study since most chemotherapy regimens last about 6 months, it was decided to complete
the questionnaires during the second half of the treatment to be able to better observe drug side effects. A
total of 101 consecutive patients with CRC who were
undergoing chemotherapy were included. Only few patients refused to participate because of their poor clinical condition. Symptom distress and the QoL of the
patients were evaluated using the EORTC QLQ C-30
questionnaire. Personal, disease and therapy characteristics were retrieved from patient files. The following
patient data were registered: age, gender, educational
status, work status, income status, primary tumor site,
chemotherapy drug, chemotherapy line, prior surgery/
radiotherapy and comorbid diseases. Confidentiality
was guaranteed to the patients. Permission to use the
questionnaires was obtained from EORTC Quality of
Life Group.
The median patient age was 57.8 years and
was similar between (neo) adjuvant and metastatic patients. Male patients predominated (58%).
The majority of patients were married. Education
level was low in most of the patients. The clinical characteristics of patients are shown in Table 2. All patients were receiving chemotherapy
for CRC. More than half of the patients (64.3%)
had colon cancer and the remaining (35.7%) had
rectal cancer. As chemotherapy is not required
in stage 1, there were no patients in the study at
that stage. Stage 2 and 3 patients received only
FUFA and FOLFOX chemotherapy. Irinotecan and
biological agents were only used in stage 4 patients. The majority of the patients (71.2%) had
stage 4 disease and were receiving anti-EGFR
and anti-VEGF therapy combined with cytotoxic
chemotherapy.
JBUON 2015; 20(2): 445
446
Quality of life in colorectal cancer patients
Figure 1. Results of the EORTC QLQC30 questionnaire (Europan Organisation for Research and Treatment of
Cancer, Quality of Life Questionnaire, version 3,0). Indicated values are the mean of all pooled patients (N=101).
QoL: quality of life, PF2: physical functioning, RF2: role functioning, EF2: emotional functioning, CF2: cognitive
functioning, SF2: social functioning, FA: fatigue, NV: nausea and vomiting, PA: pain, DY: dyspnoea, SL: insomnia,
AP: appetite loss, CO: constipation, DI: diarrhoea, FI: financial difficulties.
Result of the questionnaires
The mean value of the global health status/
QoL was 56 points ±26.6 standard deviation (SD).
Within the functional scales, physical function
(pf) was rated lowest with a mean score of 61±27.3
points, whereas the cognitive function (cf) was
rated highest with a mean of 76±25 points. The
most distinctive symptom was fatigue (fa) with a
mean value of 45±28.5 points, and the lowest was
dyspnea with a mean value of 14±21 points (Figure 1).
The patients were evaluated according to age
and were divided into two groups (<65years and
>65 years). The age of 65 was used as cut off, with
the World Health Organization (WHO) definition
of an older person. There was no significant difference in global health status (58 and 50 respectively, p=0.315) and symptom scales, but the role
functioning was lower in older than in younger
patients (76 and 58 respectively, p<0.05) (Table 3).
In this sample, 70 patients had undergone
a palliative or a curative surgical operation and
31 had not. It was searched whether these procedures had affected the global health status/QoL,
but no difference was found in scores between the
patients who had or had not surgery (56 and 58.6
respectively; p>0.05).
The impact of radiotherapy on QoL was also
investigated. Twenty one patients had received
radiotherapy and 80 had not; no difference was
observed between the two groups.
Comorbid diseases also did not cause any difference in QoL (p=0.066, narrowly missing statistical significance).
With respect to the relationship between
JBUON 2015; 20(2): 446
metastatic (N=29) and non-metastatic patients
(N=72), there was no significant difference in
global health status, but in functional scales the
patients who were receiving adjuvant therapy
showed better cognitive function (p<0.05). All
the symptom scores were better in the adjuvant
group but only nausea and vomiting and appetite loss were statistically significant (p<0.05). Although there were differences between the adjuvant and the palliative groups (Table 4) there was
no change in metastatic patients during palliative
chemotherapy, irrespective of chemotherapy line
(Table 5). Patients who were receiving different
chemotherapy regimens were compared for QoL
(Table 6). Despite a similar global health status
and functional scales, the dyspnea score was higher in the cetuximab (N=24) combination regimens
than in the bevacizumab (N=36) combination regimens (p<0.05). Appetite loss score was lowest
in the FUFA group and highest in the FOLFOX+cetuximab group (p<0.05).
Patients were also divided into groups according to level of education and the results showed
that there was a significant correlation between
QoL and education level. Better scores were obtained from university degree patients with respect to nausea and vomiting symptoms than
from lower education groups (p<0.05).
Income levels were classified in 3 levels as
good, moderate and low. There was no difference
in global health status but there were some differences in the symptom scales. For instance, the
nausea and vomiting and appetite loss scores
were worse in the low income group than in the
others (p<0.05).
Quality of life in colorectal cancer patients
447
Table 3. Age-related quality of life
Global health status
Age <65 years
Age 65+ years
p value
QoL (mean±SD)
Median (range)
58.09 ± 27.64
54.17 ± 24.50
0.315
58.33 (0-100)
50.00 (0-100)
Functional scales
Physical functioning (PF2)
Role functioning (RF2)
Emotional functioning (EF)
Cognitive functioning (CF)
Social functioning (SF)
65.41 ± 25.62
54.58 ± 29.88
73.33 (0-100)
63.33 (0-100)
76.81 ± 30.14
58.85 ± 38.10
83.33 (0-100)
50.00 (0-100)
70.22 ± 29.48
68.75 ± 30.01
75.00 (0-100)
75.00 (0-100)
75.85 ± 27.20
78.65 ± 20.41
83.33 (0-100)
83.33 (0-100)
69,08 ± 29,19
70,31 ± 27,99
66,67 (0-100)
75,00 (0-100)
0.073
0.031*
0.826
0.961
0.926
Symptom scales/items
Fatigue (FA)
Nausea and vomiting (NV)
Pain (PA)
Dyspnoea (DY)
Insomnia (SL)
Appetite loss (AP)
Constipation (CO)
Diarrhoea (DI)
Financial difficulties (FI)
44.12 ± 29.11
48.61 ± 27.62
33.33 (0-100)
44.44 (0-100)
19.81 ± 28.91
20.31 ± 24.95
0 (0-100)
16.67 (0-100)
30.15 ± 30.91
31.77 ± 30.92
16.67 (0-100)
16.67 (0-100)
15.46 ± 27.16
12.50 ± 25.04
0 (0-100)
0 (0-100)
35.75 ± 33.97
32.29 ± 34.38
33.33 (0-100)
33.33 (0-100)
31.40 ± 36.55
40.63 ± 38.55
33.33 (0-100)
33.33 (0-100)
30.43 ± 34.65
27.08 ± 36.35
33.33 (0-100)
0 (0-100)
25.49 ± 29.99
33.33 ± 36.91
33.33 (0-100)
33.33 (0-100)
42.03 ± 34.61
37.50 ± 33.60
33.33 (0-100)
33.33 (0-100)
Discussion
Although gastrointestinal tumors represent a
major health care problem worldwide, data for the
QoL for patients suffering from this kinds of cancer are rare, especially data deriving from routine
clinical practice [5]. QoL has become more important in health care practice and clinical researches
[6]. Despite the importance of QoL evaluations,
standardized methods are not applied in most
oncology centers. In this study, a single, well-established and reliable assessment tool was used
instead of several different specific questionnaires
for patients. Despite the milder type and intensity
0.387
0.566
0.75
0.575
0.602
0.22
0.513
0.395
0.542
of chemotherapy, elderly patients derive equivalent benefit compared with their younger counterparts [7]. Elderly patients showed similar QoL
with the youngers in global health status, and
only worse outcomes in role function were determined. Transportation to receive chemotherapy
sessions may be more difficult in older patients
and this may keep the elderly away from daily
activities and hobbies. A history of surgical operation did not lead to any differences. Conditions
affecting the QoL could be related to stoma but
the stoma status was not evaluated because at the
time of the current study the Turkish version of
JBUON 2015; 20(2): 447
448
Quality of life in colorectal cancer patients
Table 4. Quality of life in metastatic and non-metastatic patients
Global health status
Metastatic
Non-metastatic
p value
QoL, mean±SD
58.33 ± 20.54
56.28 ± 28.73
0.782
Median (range)
58.33 (8.33-100)
58.33 (0-100)
Functional scales
Physical functioning (PF2)
Role functioning (RF2)
Emotional functioning (EF)
Cognitive functioning (CF)
Social functioning (SF)
67.14 ± 22.58
60.00 ± 28.89
73.33 (6.67-100)
66.67 (0-100)
71.43 ± 33.60
71.00 ± 34.02
83.33 (0-100)
83.33 (0-100)
72.32 ± 24.43
68.75 ± 31.36
75 (0-100)
75 (0-100)
87.50 ± 14.79
72.60 ± 27.13
83.33 (50-100)
83.33 (0-100)
70.83 ± 25.51
68.95 ± 29.96
75 (0-100)
66.67 (0-100)
0.419
0.962
0.947
0.011
0.991
Symptom scales/items
Fatigue (FA)
Nausea and vomiting (NV)
Pain (PA)
Dyspnoea (DY)
Insomnia (SL)
Appetite loss (AP)
Constipation (CO)
Diarrhoea (DI)
Financial difficulties (FI)
39.29 ± 25.57
47.99 ± 29.48
33.33 (0-100)
44.44 (0-100)
7.74 ± 13.21
24.66 ± 30.19
0 (0-50)
16.67 (0-100)
22.62 ± 28.04
33.80 ± 31.40
16.67 (0-100)
33.33 (0-100)
11.90 ± 22.62
15.53 ± 27.82
0 (0-66.67)
0 (0-100)
32.14 ± 34.52
35.61 ± 33.94
33.33 (0-100)
33.33 (0-100)
17.86 ± 27.94
40.64 ± 38.59
0 (0-100)
33.33 (0-100)
23.81 ± 32.53
31.51 ± 35.96
0 (0-100)
33.33 (0-100)
22.62 ± 31.47
30.09 ± 32.70
0 (0-100)
33.33 (0-100)
32.14 ± 32.05
43.84 ± 34.64
33.33 (0-100)
33.33 (0-100)
EORTC QLQ-CR29 (a specific module of CRC patients especially useful for stoma patients about
sphincter control and sexual life) was not available. Patients were compared according to the
stages of disease and differences were found in
the cognitive function. Studies in literature have
shown that depression is very common in metastatic cancer survivors [8]. This depressive mood
may influence the cognitive functions negatively.
In the adjuvant group, cognitive function, appetite loss and nausea/vomiting scores were better.
These differences may primarily be related to impairments because of a longer time since diagnosis, disease progression and cumulative toxicity
JBUON 2015; 20(2): 448
0.171
0.005
0.079
0.61
0.61
0.005
0.37
0.241
0.117
of drugs [9,10].
In the current study, there was no difference
between different chemotherapy lines of metastatic patients (p>0.05). This means that palliative
chemotherapy did not negatively affect QoL [10].
On the contrary, chemotherapy maintained the
QoL. When deciding on further chemotherapy, we
usually use ECOG performance status and ask a
few brief questions to understand the tolerability potential of the patient. Actually, applying the
questionnaire to every new patient provides more
detailed information about the patient. Differences in QoL with different regimens may primarily
be related to the type of chemotherapeutic drugs
Quality of life in colorectal cancer patients
449
Table 5. Quality of life between chemotherapy lines
Global Health Status
Palliative
chemotherapy
1st line
2nd line
3rd line
QoL, mean±SD
52.89 ± 27.98
60.19 ± 31.38
72.22 ± 23.37
50 (0-100)
66.67 (0-100)
79.17 (33.33-100)
Median (range)
Palliative
chemotherapy
Palliative
chemotherapy
p value
0.197
Functional scales
Physical functioning (PF2)
Role functioning (RF2)
Emotional functioning (EF)
Cognitive functioning (CF)
Social functioning (SF)
54.15 ± 29.52
73.33 ± 20.96
67.78 ± 33.31
66.67 (0-93.33)
73.33 (33.33-100)
80 (0-86.67)
65.65 ± 35.26
84.26 ± 24.57
75.00 ± 41.83
66.67 (0-100)
91.67 (0-100)
100 (0-100)
64.93 ± 32.66
76.85 ± 26.13
75.00 ± 34.56
75 (0-100)
83.33 (0-100)
91.67 (8.33-100)
69.73 ± 27.78
78.70 ± 27.30
77.78 ± 20.18
83.33 (0-100)
83.33 (0-100)
75 (50-100)
67.35 ± 30.80
69.44 ± 29.29
80.56 ± 26.70
66.67 (0-100)
66.67 (0-100)
91.67 (33.33-100)
0.054
0.187
0.357
0.367
0.552
Symptom scales/items
Fatigue (FA)
Nausea and vomiting (NV)
Pain (PA)
Dyspnoea (DY)
Insomnia (SL)
Appetite loss (AP)
Constipation (CO)
Diarrhoea (DI)
Financial difficulties (FI)
53.71 ± 29.74
37.65 ± 28.30
33.33 ± 18.59
50 (0-100)
44.44 (0-100)
33.33 (11.11-55.56)
24.15 ± 28.48
32.40 ± 36.81
5.55 ± 8.61
16.67 (0-100)
16.67 (0-100)
5.56 (0-16.67)
37.50 ± 33.24
27.78 ± 21.39
22.22 ± 40.37
33.33 (0-100)
33.33 (0-66.67)
22.22 (0-100)
14.97 ± 28.92
14.81 ± 20.52
22.22 ± 40.37
0 (0-100)
0 (0-66.67)
22.22 (0-100)
39.46 ± 34.48
31.48 ± 33.28
16.67 ± 27.89
33.33 (0-100)
33.33 (0-100)
16.67 (0-66.67)
44.22 ± 41.04
35.19 ± 35.19
27.78 ± 25.09
33.33 (0-100)
33.33 (0-100)
27.78 (0-66.67)
34.69 ± 39.65
25.93 ± 29.27
22.22 ± 17.21
0 (0-100)
33.33 (0-100)
22.22 (0-33.33)
33.33 ± 36.39
24.07 ± 25.06
22.22 ± 17.21
33.33 (0-100)
33.33 (0-66.67)
22.22 (0-33.33)
45.58 ± 35.81
44.44 ± 30.25
27.78 ± 38.97
33.33 (0-100)
50 (0-100)
27.78 (0-100)
or additional monoclonal antibodies. As far as we
know, this is the first study about the effects of
different chemotherapy regimens on QoL in patients with CRC. For example, even the treatment
sequence of FOLFOX and FOLFIRI changes toxicity [11]. Bevacizumab-based therapy has been
reported to have a more favorable toxicity profile
with less severe diarrhea and neutropenia [5]. In
the current study, treatment regimens with bevacizumab were also shown to yield better QoL and
in contrast to the data reported by Unger et al.,
0.103
0.182
0.294
0.763
0.237
0.648
0.855
0.775
0.439
the QoL scores were worse with combinations of
cetuximab [12].
Although no relationship has been demonstrated between education and QoL scores in
several studies, a variation was observed in the
current study at different levels of education in
nausea/vomiting. The nausea/vomiting scores were
lower in univpersity graduate patients than in
others. Patients with higher levels of education
are usually more aware of the effects of treatment
and they might use antiemetics more regularly.
JBUON 2015; 20(2): 449
Quality of life in colorectal cancer patients
450
Table 6. Six different chemotherapy regimens and correlation with QoL
Global
health
status
QoL,
mean±SD
Median
(range)
FUFA
FOLFOX+
Cetuximab
FOLFIRI+
Bevacizumab
FOLFOX
FOLFIRI+
Cetuximab
FOLFOX +
Bevacizumab
68.06 ± 18.06
55.56 ± 35.59
58.33 ± 27.69
51.15 ± 24.37
52.78 ± 20.83
62.5 ± 28.87
66.67 (33.3-100)
50 (0-100)
54.17 (0-100)
50 (0-100)
50 (0-83.33)
62.5 (16.67100)
p value
0.465
Functional scales
PF2
RF2
EF
CF
SF
72.22 ± 24.53
49.33 ± 34.07
63.81 ± 25.56
58.85 ± 26.25
63.70 ± 24.97
65.83 ± 25.06
83.3 (6.7-100)
53.3(0-100)
70 (13,3-100)
66.7 (0-100)
73.3 (6.7-86.7)
73.3 (33.3-100)
88.88 ± 24.96
61.11 ± 41.15
71.43 ± 32.67
66.67 ± 33.63
75.93 ± 34.47
72.92 ± 32.04
100 (16.7-100)
66.7(0-100)
83.3 (0-100)
66.7 (0-100)
100 (0-100)
83.3 (16.7-100)
79.17 ± 22.33
58.93 ± 35.12
75.00 ± 28.60
68.10 ± 26.64
53.70 ± 34.64
80.21 ± 30.19
87.5 (33.3-100)
62.5(0-100)
83.3 (0-100)
75 (0-100)
50 (8.3-100)
91.7 (8.3-100)
87.50 ± 14.43
67.78 ± 31.79
73.21 ± 29.17
80.46 ± 23.18
77.78 ± 23.57
75.00 ± 12.60
83.3 (50-100)
83.3(0-100)
83.3 (0-100)
83.3 (16.7-100)
83.3 (33.3-100)
66.7 (66.7-100)
81.94 ± 18.06
55.56 ± 34.31
71.43 ± 30.04
67.24 ± 27.63
70.37 ± 35.14
77.08 ± 12.40
83,3 (33,3-100)
50(0-100)
75 (0-100)
66,7 (0-100)
66,7 (0-100)
75 (66,7-100)
0.106
0.322
0.16
0.429
0.303
Symptom scales/items
FA
NV
PA
DY
SL
AP
CO
DI
FI
26.85 ± 24.83
51.85 ± 32.98
46.09 ± 31.98
47.13 ± 24.96
48.15 ± 26.06
51.39 ± 24.44
22.2 (0-88.9)
55.5 (0-100)
33.3 (0-100)
44.4 (11.1-100)
44.4 (11.1-100)
55.6 (0-88.9)
2.78 ± 6.49
17.78 ± 25.56
23.21 ± 28.45
21.26 ± 27.05
25.93 ± 35.46
27.08 ± 36.67
0 (0-16.7)
16.7 (0-100)
16.7 (0-100)
16.7 (0-100)
16.7 (0-100)
8.3 (0-100)
11.11 ± 24.96
41.11 ± 40.76
30.86 ± 31.25
33.33 ± 26.35
37.04 ± 32.03
22.92 ± 21.71
0 (0-83.3)
33.3 (0-100)
16.7 (0-100)
33.3 (0-100)
33.3 (0-83.3)
16.7 (0-66.7)
5.56 ± 19.25
31.11 ± 40.76
5.95 ± 15.85
18.39 ± 26.10
22.22 ± 28.86
4.17 ± 11.79
0 (0-66.7)
0 (0-100)
0 (0-66.7)
0 (0-100)
0 (0-66.7)
0 (0-33.3)
16.67 ± 22.47
51.11 ± 41.53
35.71 ± 35.05
34.48 ± 35.05
37.04 ± 26.06
25.00 ± 23.57
0 (0-66.7)
33.3 (0-100)
33.3 (0-100)
33.3 (0-100)
33.3 (0-66.7)
33.3 (0-66.7)
2.78 ± 9.62
46.67 ± 39.44
38.10 ± 43.24
35.63 ± 33.25
44.44 ± 40.83
29.17 ± 27.82
0 (0-33.3)
33.3 (0-100)
33.3 (0-100)
33.3 (0-100)
33.3 (0-100)
33.3 (0-66.7)
30.56 ± 36.12
35.56 ± 36.66
30.95 ± 32.62
27.59 ± 35.71
18.52 ± 33.79
29.17 ± 45.21
33.3 (0-100)
33.3 (0-100)
33.3 (0-100)
0 (0-100)
0 (0-100)
0 (0-100)
25.00 ± 32.18
28.89 ± 33.01
27.16 ± 32.08
24.14 ± 29.41
25.93 ± 27.78
50 ± 47.14
16.7 (0-100)
33.3 (0-100)
33.3 (0-100)
0 (0-100)
33.3 (0-66.7)
50 (0-100)
30.56 ± 33,21
60.00 ± 40.24
39.29 ± 35.20
36.78 ± 30.01
33.33 ± 28.87
45.83 ± 35.36
33.3 (0-100)
66.7 (0-100)
33.3 (0-100)
33.3 (0-100)
33.3 (0-66.7)
50 (0-100)
0.143
0.192
0.093
0.030*
0.264
0.024
0.841
0.806
0.329
For abbreviations see previous Tables
The results of this study showed a strong correlation between income level and nausea-vomiting, appetite loss and financial difficulties. Constant nausea causes difficulty in selecting food
because some kinds of food exacerbate nausea.
JBUON 2015; 20(2): 450
If an individual’s income level is low it will be
difficult to always find every kind of food he/she
likes to eat and this may be the reason for appetite loss.
In our clinic, questionnaires about the pa-
Quality of life in colorectal cancer patients
tient’s QoL are not used regularly. However, at the
end of this study it was noticed that, according to
the survey, a lot of patients with high pain and
nausea/vomiting scores had received incomplete
treatment for pain and emesis and therefore additional treatment was provided. A disadvantage
of the study is the small number of patients for
different types of chemotherapy regimens. Larger
studies are surely needed, but the present study
described the results of a particular region, ensuring the advantage of homogeneity.
In a study including gastric, CRC and pancreaticobiliary cancers, overall survival was compared
in optimal and suboptimal chemotherapy groups,
showing that patients with gastrointestinal cancers (especially CRC and gastric cancer) had better survival in the optimally-treated group [13]. In
the current study we didn’t evaluate survival but
chemotherapy was mainly associated with a stable QoL over time, irrespective of treatment line
451
and stage in CRC patients. Results of the GERGOR
OPTIMOX 1 study showed that QoL has prognostic value in mCRC patients and QoL scores could
give information to the clinician about the prognosis of a patient [14].
The decision of a chemotherapy regimen has
been influenced by a number of factors, such as
the patient’s performance, comorbidities, k-ras
status, resectability potential or desires [15]. Further treatments were seen to improve QoL and
indirectly the survival in CRC patients and this
may be encouraging for patients as there is still a
social stigma attached to chemotherapy by a part
of the society in Turkey.
Acknowledgements
The authors thank the chemotherapy nurses
for their help on data collection, and also thank all
of the study participants.
References
1. Greenlee R, Murray T, Bolden S, Wingo PA. Cancer
statistics. CA Cancer J Clin 2000;50:7-33.
2. Akin S1, Can G, Aydiner A, Ozdilli K, Durna Z. Quality
of life, symptom experience and distress of lung cancer patients undergoing chemotherapy. Eur J Oncol
Nurs 2010;14:400-409.
3. Feinstein AR, Josephy B, Wells CK. Scientific and clinical problems in indexes of functional disability. An
Intern Med 1986;105:413-420.
4. Aaronson NK, Ahmedzai S, Bergman B et al. The European Organization for Research and Treatment of
Cancer QLQ-C30: a quality-of-life instrument for use
in international clinical trials in oncology. J Natl Cancer Inst 1993;85:365–372.
5. Benoist C, Tournigand C, Andre T, de Gramont A. Therapeutic strategy in unresectable metastatic colorectal
cancer. Ther Adv Med Oncol 2011;4:75-89.
6. Testa MA, Simonson DC. Assesment of quality-of-life
outcomes. N Engl J Med 1996;334:835-840.
7. Bakogeorgos M, Mountzios G, Kotsantis G, Economopoulou P, Fytrakis N, Kentepozidis N. Chemotherapy compliance, tolerance and efficacy in elderly and
non-elderly patients with metastatic colorectal cancer: a single institution comparative study. J BUON
2013;18:629-634.
8. Low CA, Stanton AL. Activity Disruption and Depressive Symptoms in Women Living With Metastatic
Breast Cancer. Health Psychol 2015;34:89-92.
9. Cruzado JA, Lopez-Santiago S, Martinez-Marin V, Jo-
se-Moreno G, Custodio AB, Feliu J. Longitudinal study
of cognitive dysfunctions induced by adjuvant chemotherapy in colon cancer patients. Support Care Cancer
2014;22:1815-1823.
10. Wintner LM, Giesinger JM, Zabernigg A et al. Quality
of life during chemotherapy in lung cancer patients:
results across different treatment lines. Br J Cancer
2013;109:2301-2308.
11. Walker MS, Pharm EY, Kerr J, Yim YM, Stephanski EJ, Shwartzberg LS. Symptom burden & quality
of life among patients receiving second-line treatment of metastatic colorectal cancer. BMC Res Notes
2012;5:314.
12. Unger K, Niehammer U, Hahn A et al. Treatment of
metastatic colorectal cancer with cetuximab: influence
on the quality of life. J Gastroenterol 2013;51:733¬739.
13. Uyeturk U, Turker I, Bal O et al. Treatment decision
plans matter in elderly patients with gastrointestinal
cancer: suboptimal or optimal? J BUON 2014;19:365371.
14. Diouf M, Chibaudel B, Filleron T et al. Could baseline health-related quality of life (QoL) predict overall
survival in metastatic colorectal cancer? The results
of the GERCOR OPTIMOX 1 study. Health Qual Life
Outcomes 2014;12:69-81.
15. Rossi L, Vakiarou F, Zoratto F et al. Factors influencing
choice of chemotherapy in metastatic colorectal cancer (mCRC). Cancer Manag Res 2013;5:377-385.
JBUON 2015; 20(2): 451
© Copyright 2026 Paperzz